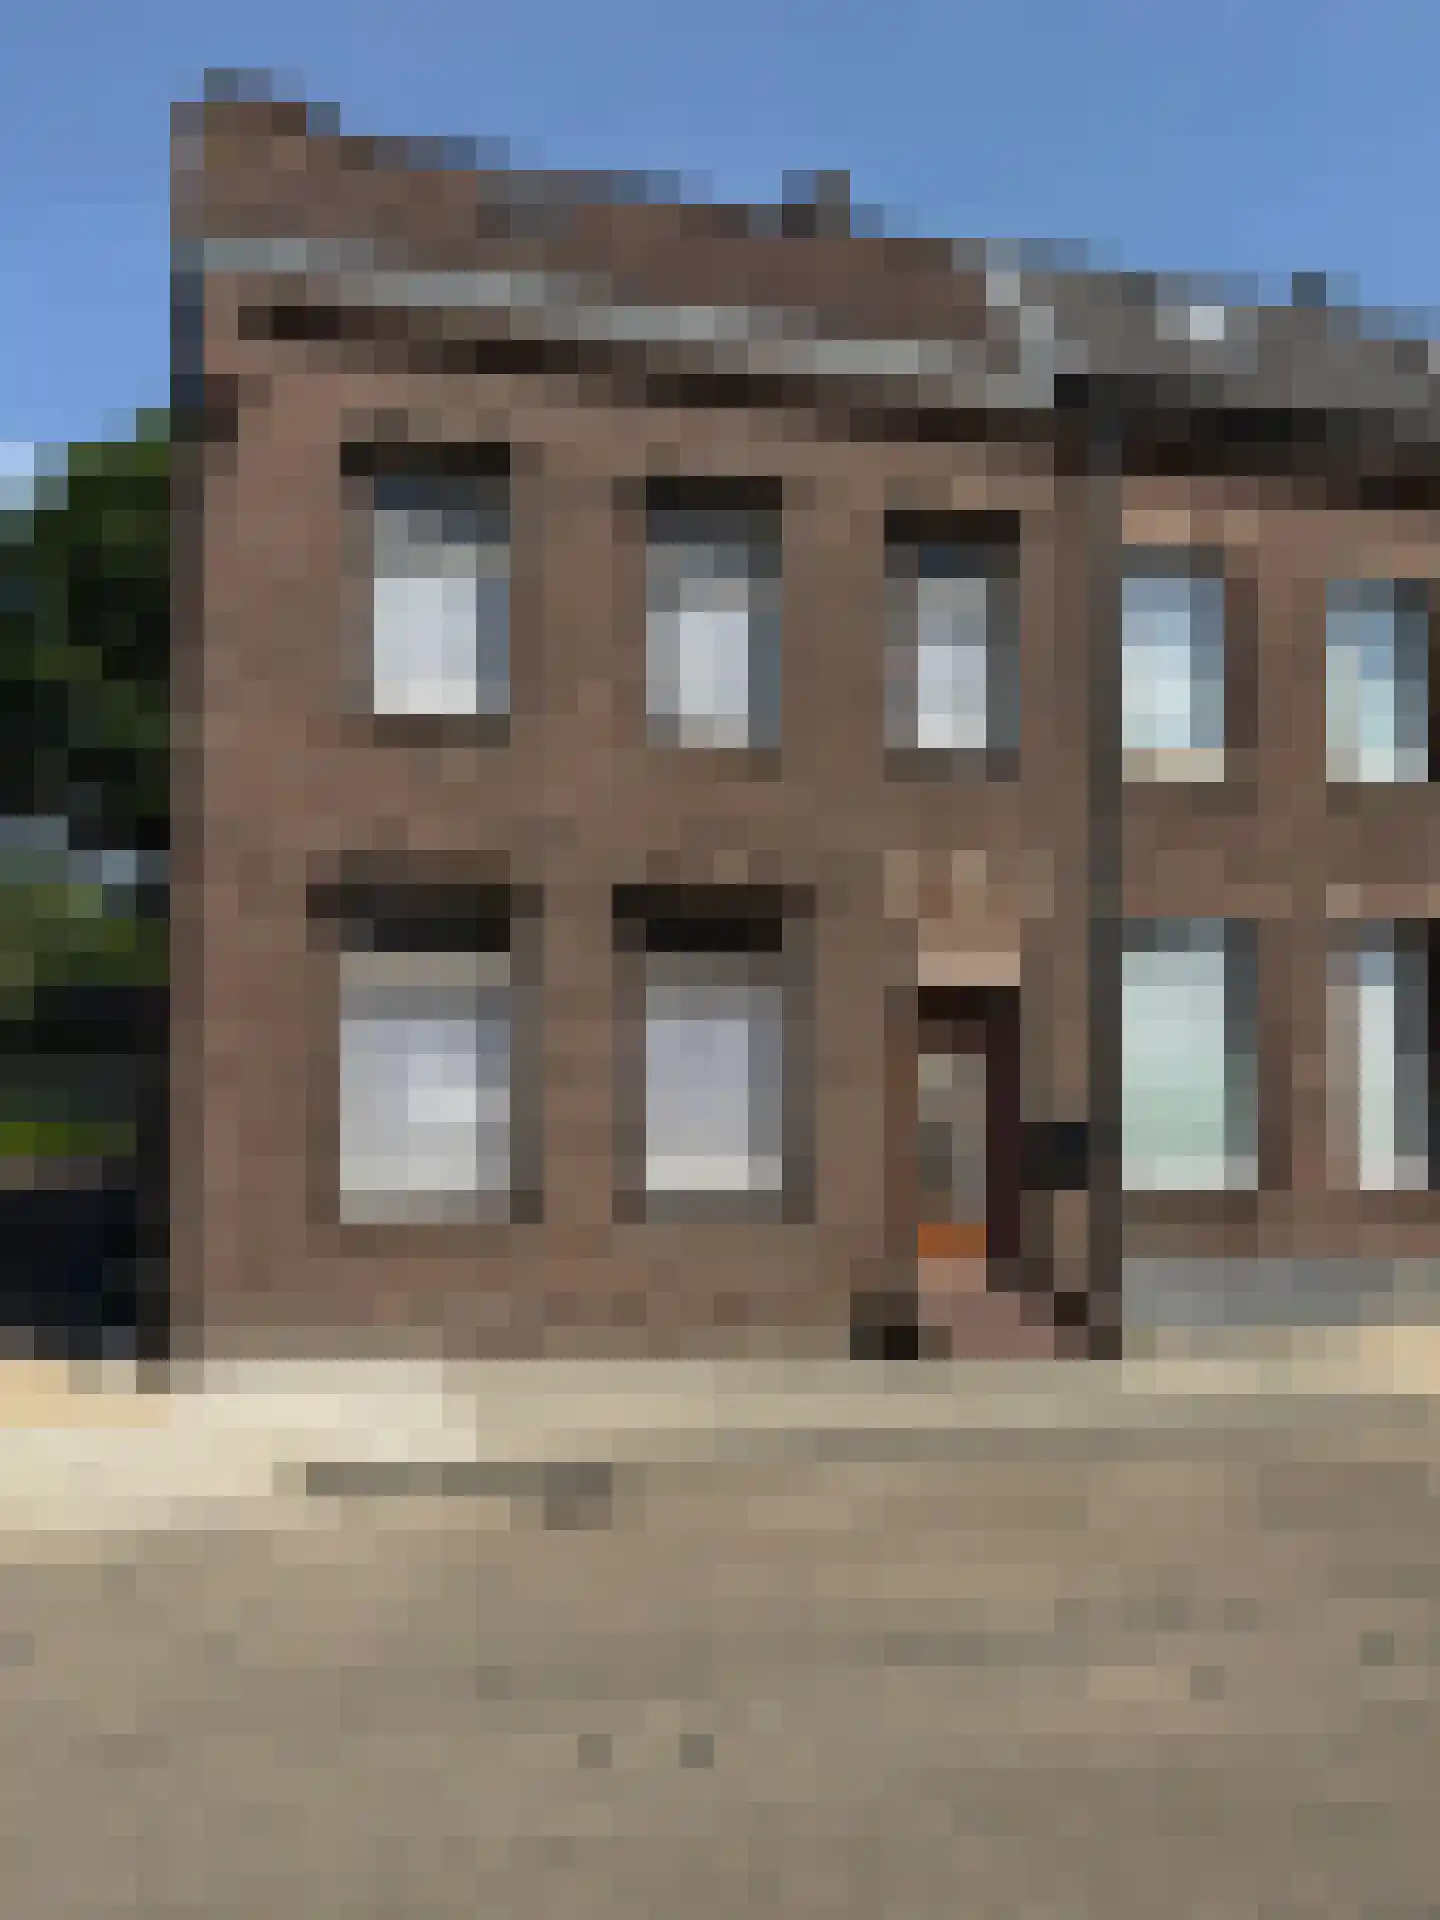
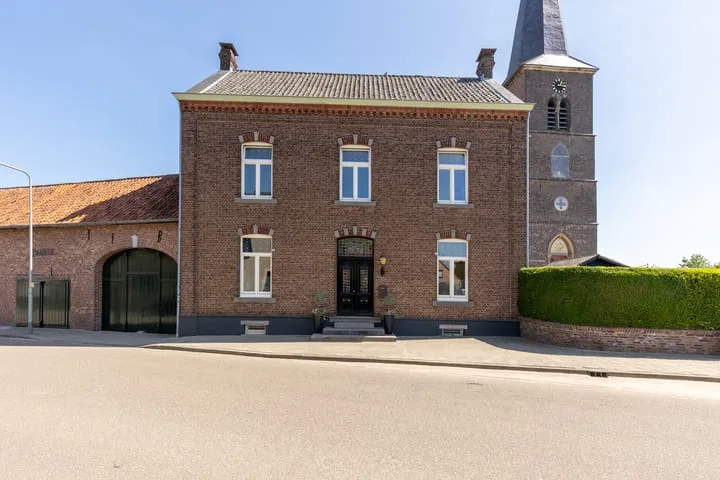
- Available
Kampstraat 17
6454BG Jabeek
€ 319.000 k.k.
€ 2.593/m²
- Living area
- 123 m²
- Land area
- 277 m²
- Bedrooms
- 4
Searching in 11 houses in Jabeek
Type to search. Use arrow down and arrow up to navigate through results and press Enter to open.
Hidden search suggestions.
View current properties in Jabeek or search targeted on street, postal code and property characteristics.
View the current housing stock in Jabeek and quickly filter by price, living area, rooms and more. There are currently 11 houses in this place within our selection.
6454BG Jabeek
€ 319.000 k.k.
€ 2.593/m²
6454AD Jabeek
€ 259.000 k.k.
€ 2.590/m²
6454AJ Jabeek
€ 689.000 k.k.
€ 2.907/m²
6454AC Jabeek
€ 349.000 k.k.
€ 2.705/m²
6454BG Jabeek
€ 398.000 k.k.
€ 3.317/m²
6454AJ Jabeek
€ 325.000 k.k.
€ 2.355/m²
6454AM Jabeek
€ 399.000 k.k.
€ 2.463/m²
6454AG Jabeek
€ 189.000 k.k.
€ 2.076/m²
6454AG Jabeek
€ 429.000 k.k.
€ 0/m²
6454AK Jabeek
€ 645.000 k.k.
€ 3.862/m²
6454BC Jabeek
€ 349.000 k.k.
€ 2.604/m²
Get free quotes from real estate agents with local market knowledge. Compare more than 52 real estate agents in Jabeek.
Selling a home in Jabeek? Compare all real estate agents in Jabeek or view the top 10 real estate agents in Jabeek for extra context for your choice.
Real estate agents make sharper offers when they know you're comparing — ask for quotes for sale or purchase.
Practical answers about housing supply, sales and comparing real estate agents in Jabeek.
The costs of a real estate agent in Jabeek depend on commission, setup costs, property presentation and the chosen service. Compare the 52 real estate agents in Jabeek via the real estate agent page and request multiple quotes to compare rates and approach well.
Within our selection, we are currently showing 11 houses in Jabeek. View also the sold houses in Jabeek to compare the current offering with recent transactions.
Take into account not only price and living area but also maintenance, energy label, location, outdoor space and sales status. This way you compare houses in Jabeek on more than just the asking price.
A local real estate agent knows the neighborhoods, recent transactions and demand in Jabeek. By comparing 52 real estate agents in the region you get a better insight into prices, sales strategy and expected yield; the top 10 in Jabeek provides a useful starting point.
Yes, when making a sales plan, a valuation in Jabeek is wise. You gain insight into a realistic asking price and can then compare offers from real estate agents specifically.
View current location data on residents, WOZ development, housing stock, energy consumption, business activity and safety in Jabeek. In 2026 were there 711 residents. The average WOZ value in 2025 is EUR 319.000.
These figures help to better assess and compare the housing stock in Jabeek with recent sold homes. Orient yourself then on suitable top real estate agents in Jabeek for sales advice in this region.
Residents
711
Last year: 2026
Average WOZ
EUR 319.000
Last year: 2025
Average income per person.
EUR 31.800
Source: AllNumbers
Crimes (current year)
22
Total registered
| Year | Residents |
|---|---|
| 2021 | 700 |
| 2022 | 710 |
| 2023 | 710 |
| 2024 | 720 |
| 2025 | 715 |
| 2026 | 711 |
| Year | Average WOZ |
|---|---|
| 2021 | EUR 239.000 |
| 2022 | EUR 256.000 |
| 2023 | EUR 291.000 |
| 2024 | EUR 295.000 |
| 2025 | EUR 319.000 |
Hoger
180
Praktisch
170
Middelbaar
210
Europa
110
Nederland
575
Buiten Europa
30
Label C
74
Label G
57
Label B
53
Label D
47
Label A
41
Label F
35
Label E
18
Label A+
0
Label A++
0
Label A+++
0
Label A++++
0
Label A+++++
0
| Year | Gas (m3) | Electricity (kWh) |
|---|---|---|
| 2020 | 1.570 | 3.460 |
| 2021 | 1.790 | 3.550 |
| 2022 | 1.370 | 3.370 |
| 2023 | 1.090 | 3.340 |
| 2024 | 1.080 | 3.300 |
Hoekwoning
Gas: 1.140 • Electricity: 3.380
Huurwoning
Gas: 840 • Electricity: 2.570
Koopwoning
Gas: 1.160 • Electricity: 3.550
Appartement
Gas: 580 • Electricity: 2.040
Tussenwoning
Gas: 960 • Electricity: 2.910
Vrijstaande woning
Gas: 1.340 • Electricity: 4.210
Twee-onder-één-kap woning
Gas: 1.010 • Electricity: 3.030
Total number of company establishments: 75
| Period | Crimes |
|---|---|
| jan 2026 | 1 |
| jul 2025 | 5 |
| jun 2025 | 2 |
| mei 2025 | 3 |
| mrt 2025 | 1 |
| mrt 2026 | 1 |
| nov 2024 | 4 |
| nov 2025 | 3 |
| okt 2024 | 3 |
| okt 2025 | 3 |
| sep 2024 | 6 |
| sep 2025 | 0 |
These figures give an indicative picture of safety trends in the living environment of Jabeek.
Short answers based on current local statistics, handy for a quick comparison of the living environment.
Jabeek telt in 2026 ongeveer 711 inwoners.
De gemiddelde WOZ-waarde in Jabeek is in 2025 circa € 319.000.
Het gemiddelde inkomen per inwoner in Jabeek ligt rond € 31.800 per jaar.
Voor het huidige jaar gaat het om ongeveer 22 geregistreerde misdrijven. Gebruik deze cijfers als indicatie en vergelijk trends per periode.
In Jabeek komt vooral "Twee-onder-één-kap woningen" veel voor, met ongeveer 129 woningen.