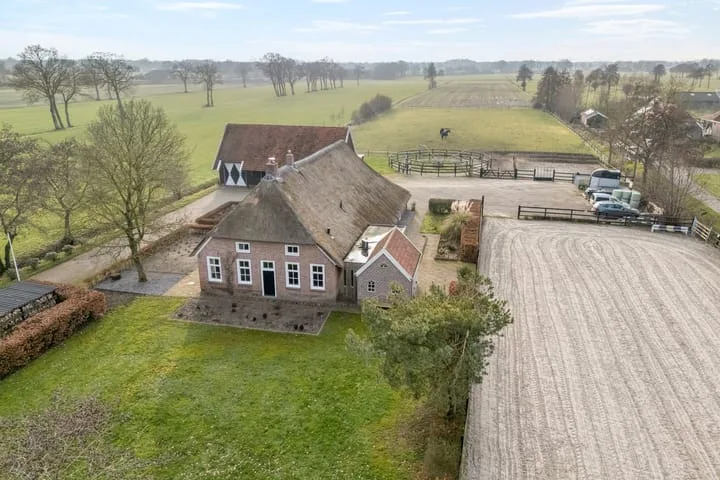
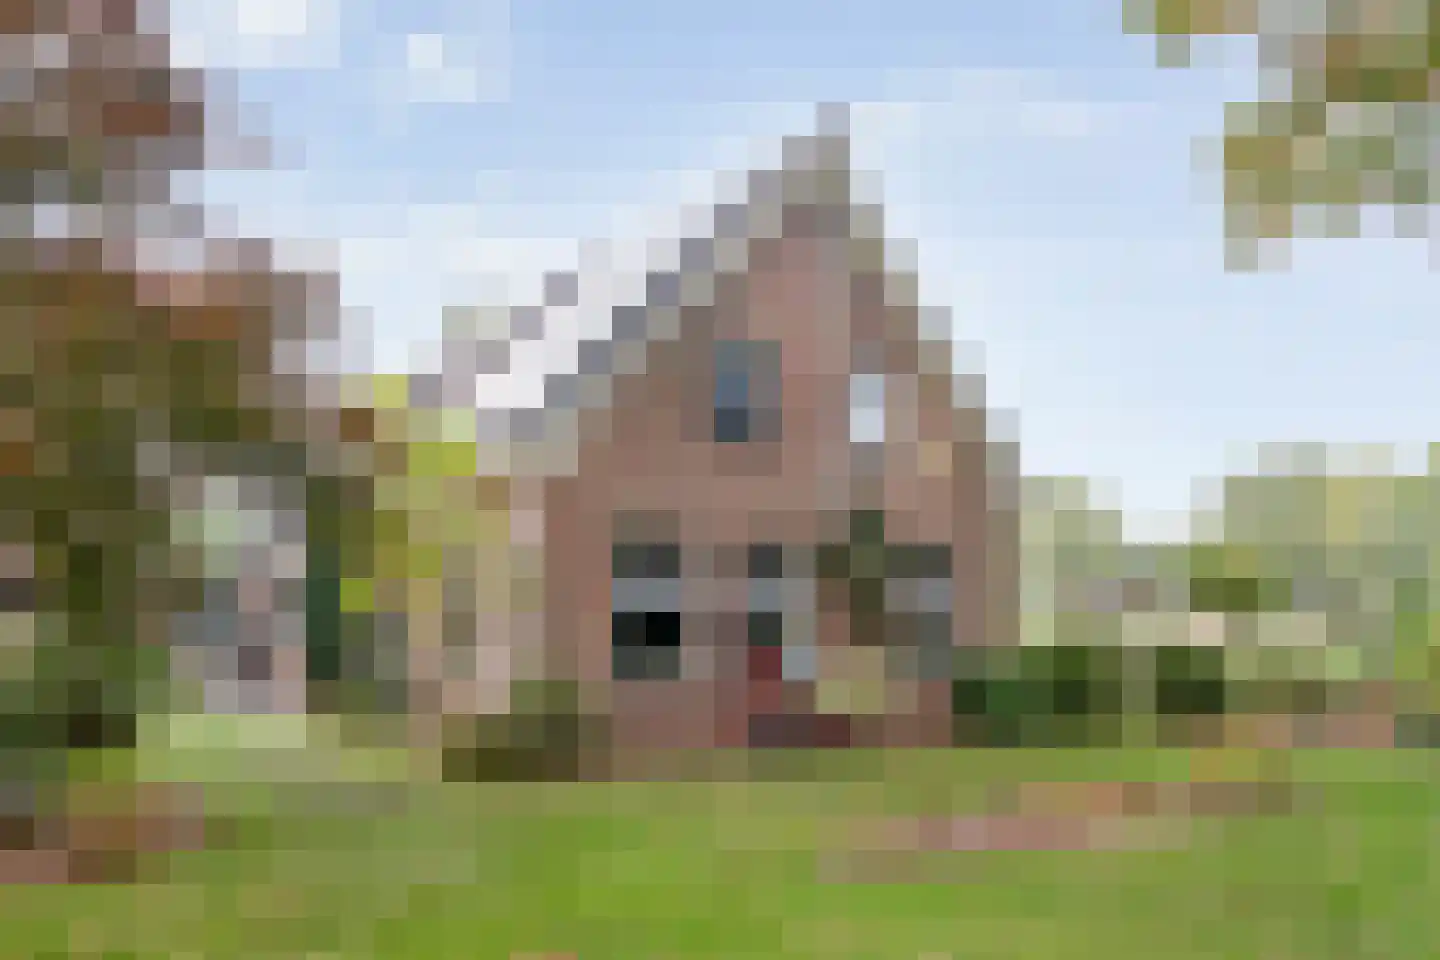
- Sold
Ruinerweg 39
7958RB Koekange
€ 1.095.000 k.k.
€ 6.257/m²
- Living area
- 175 m²
- Land area
- 16819 m²
- Bedrooms
- 4
View 19 sold houses in Koekange
Type to search. Use arrow down and arrow up to navigate through results and press Enter to open.
Hidden search suggestions.
Compare sold homes in Koekange or view the current offering in this location directly.
On this page you will find recently sold homes in Koekange. Use this overview to better estimate selling prices, popular neighborhoods, and the local housing supply before you choose a real estate agent. Also view the current housing supply with 30 houses in Koekange.
7958RB Koekange
€ 1.095.000 k.k.
€ 6.257/m²
7958NC Koekange
€ 425.000 k.k.
€ 3.080/m²
7958RK Koekange
€ 439.000 k.k.
€ 3.351/m²
7958VB Koekange
€ 349.500 k.k.
€ 2.865/m²
7958SR Koekange
€ 1.295.000 k.k.
€ 5.418/m²
7958RW Koekange
€ 595.000 k.k.
€ 3.520/m²
7958RZ Koekange
€ 324.500 k.k.
€ 3.415/m²
7958VB Koekange
€ 530.000 k.k.
€ 4.076/m²
7958PH Koekange
€ 589.000 k.k.
€ 3.308/m²
7958RD Koekange
€ 450.000 k.k.
€ 1.679/m²
7958SR Koekange
€ 695.000 k.k.
€ 3.994/m²
7958TJ Koekange
€ 349.500 k.k.
€ 3.640/m²
7958NC Koekange
€ 399.000 k.k.
€ 3.694/m²
7958RN Koekange
€ 349.500 k.k.
€ 0/m²
7958RH Koekange
€ 400.000 k.k.
€ 3.738/m²
7958VG Koekange
€ 250.000 k.k.
€ 2.551/m²
7958SC Koekange
€ 349.500 k.k.
€ 2.796/m²
7958SH Koekange
€ 349.500 k.k.
€ 2.688/m²
7958RE Koekange
€ 305.000 k.k.
€ 3.860/m²
Bekijk recente verkopen en ontvang gratis offertes van lokale makelaars. Vergelijk meer dan 28 makelaars in Koekange.
Zelf je woning verkopen in Koekange? Vergelijk verkoopmakelaars in Koekange of bekijk de beste verkoopmakelaars in Koekange als referentie bij jouw keuze.
Makelaars maken scherpere voorstellen als ze weten dat je vergelijkt — vraag offertes aan voor verkoop of aankoop.
Short answers about housing prices, sold homes and comparing real estate agents in Koekange.
De kosten van een makelaar in Koekange verschillen per kantoor, woningtype en verkoopaanpak. In Koekange kun je 28 real estate agents vergelijken; bekijk daarom ook de makelaars in Koekange om tarieven, presentatie en lokale ervaring beter naast elkaar te zetten.
On this page we currently show 19 sold houses in Koekange from our selection. This helps you to better assess recent transactions and the local housing market.
Houses sold in Koekange give insight into asking prices, house types and neighborhoods where recent transactions have taken place. Compare this also with the current housing stock in Koekange to better understand the market.
You can use sold homes as a first market indication, but a local real estate agent can better take into account finishing, location, maintenance and current demand in Koekange.
Vergelijk de 28 real estate agents in Koekange op lokale verkoopervaring, reviews, verwachte opbrengst, courtage en marketingaanpak. Bekijk verkoopmakelaars in Koekange of de top 10 makelaars in Koekange om snel sterke kantoren te ontdekken.
View current location data on residents, WOZ development, housing stock, energy consumption, business activity and safety in Koekange. In 2026 were there 2.585 residents. The average WOZ value in 2025 is EUR 421.000.
These figures help to better assess and compare the housing stock in Koekange with recent sold homes. Orient yourself then on suitable top real estate agents in Koekange for sales advice in this region.
Residents
2.585
Last year: 2026
Average WOZ
EUR 421.000
Last year: 2025
Average income per person.
EUR 33.900
Source: AllNumbers
Crimes (current year)
26
Total registered
| Year | Residents |
|---|---|
| 2021 | 2.495 |
| 2022 | 2.500 |
| 2023 | 2.575 |
| 2024 | 2.575 |
| 2025 | 2.590 |
| 2026 | 2.585 |
| Year | Average WOZ |
|---|---|
| 2021 | EUR 299.000 |
| 2022 | EUR 335.000 |
| 2023 | EUR 389.000 |
| 2024 | EUR 409.000 |
| 2025 | EUR 421.000 |
Hoger
590
Praktisch
380
Middelbaar
940
Europa
115
Nederland
2.360
Buiten Europa
115
Label C
278
Label G
224
Label A
171
Label B
169
Label D
135
Label F
67
Label E
32
Label A+
12
Label A++
6
Label A+++
5
Label A++++
0
Label A+++++
0
| Year | Gas (m3) | Electricity (kWh) |
|---|---|---|
| 2020 | 1.690 | 3.310 |
| 2021 | 1.930 | 3.460 |
| 2022 | 1.480 | 3.270 |
| 2023 | 1.240 | 3.150 |
| 2024 | 1.160 | 3.260 |
Hoekwoning
Gas: 970 • Electricity: 1.980
Huurwoning
Gas: 940 • Electricity: 1.970
Koopwoning
Gas: 1.300 • Electricity: 3.400
Appartement
Gas: 1.070 • Electricity: 2.620
Tussenwoning
Gas: 950 • Electricity: 2.070
Vrijstaande woning
Gas: 1.440 • Electricity: 3.690
Twee-onder-één-kap woning
Gas: 990 • Electricity: 2.970
Total number of company establishments: 385
| Period | Crimes |
|---|---|
| jan 2026 | 1 |
| jul 2025 | 1 |
| jun 2025 | 5 |
| mei 2025 | 4 |
| mrt 2025 | 0 |
| mrt 2026 | 1 |
| nov 2024 | 5 |
| nov 2025 | 3 |
| okt 2024 | 0 |
| okt 2025 | 0 |
| sep 2024 | 5 |
| sep 2025 | 4 |
These figures give an indicative picture of safety trends in the living environment of Koekange.
Short answers based on current local statistics, handy for a quick comparison of the living environment.
Koekange telt in 2026 ongeveer 2.585 inwoners.
De gemiddelde WOZ-waarde in Koekange is in 2025 circa € 421.000.
Het gemiddelde inkomen per inwoner in Koekange ligt rond € 33.900 per jaar.
Voor het huidige jaar gaat het om ongeveer 26 geregistreerde misdrijven. Gebruik deze cijfers als indicatie en vergelijk trends per periode.
In Koekange komt vooral "Vrijstaande woningen" veel voor, met ongeveer 565 woningen.