- Sold subject to confirmation
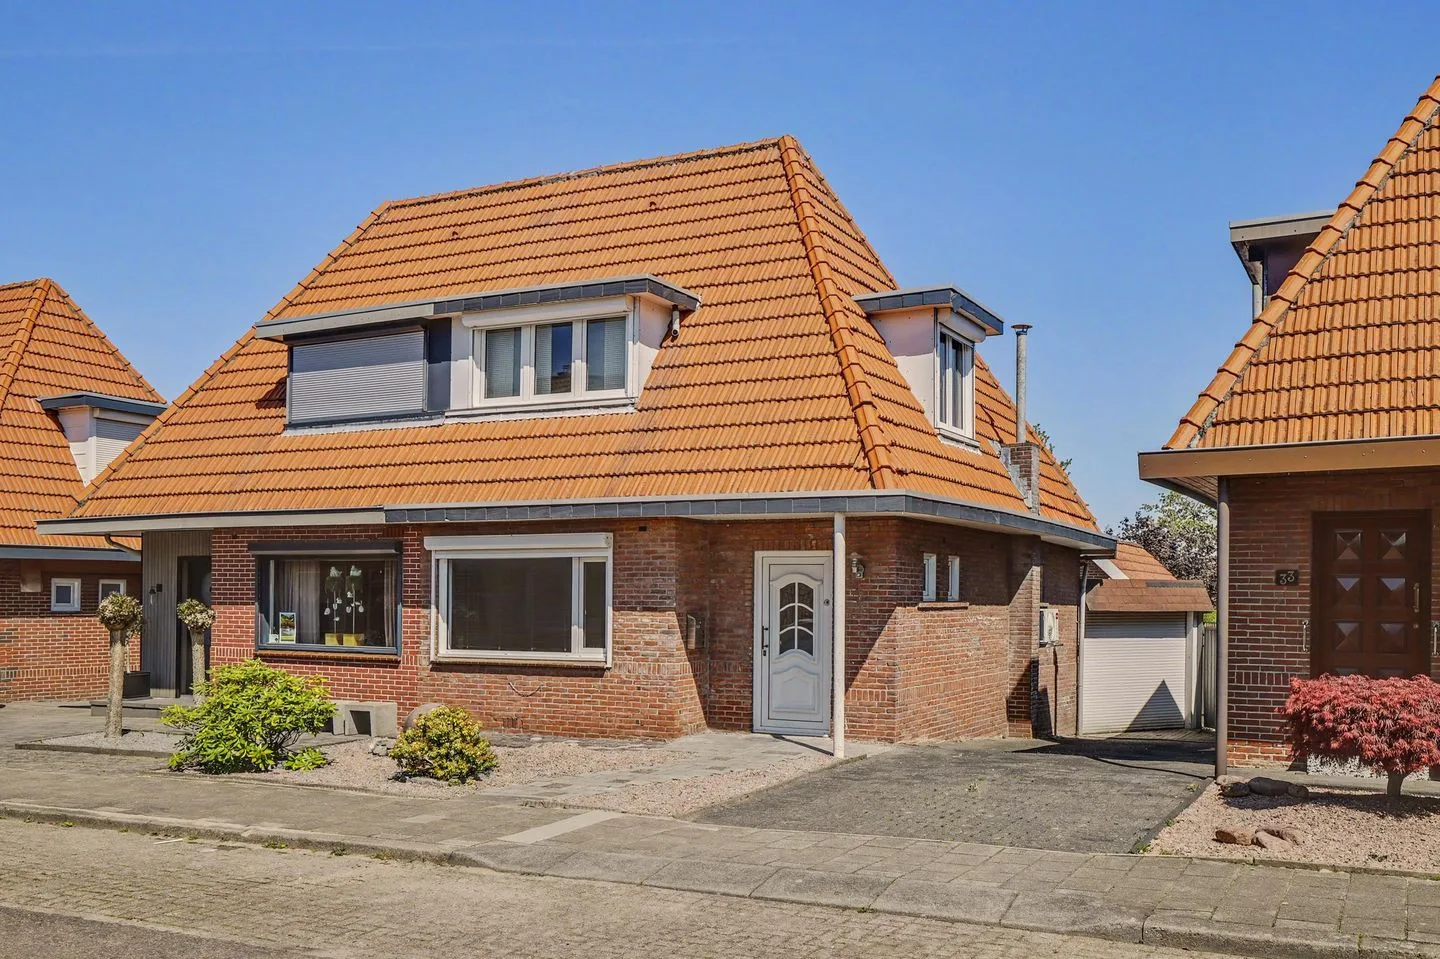
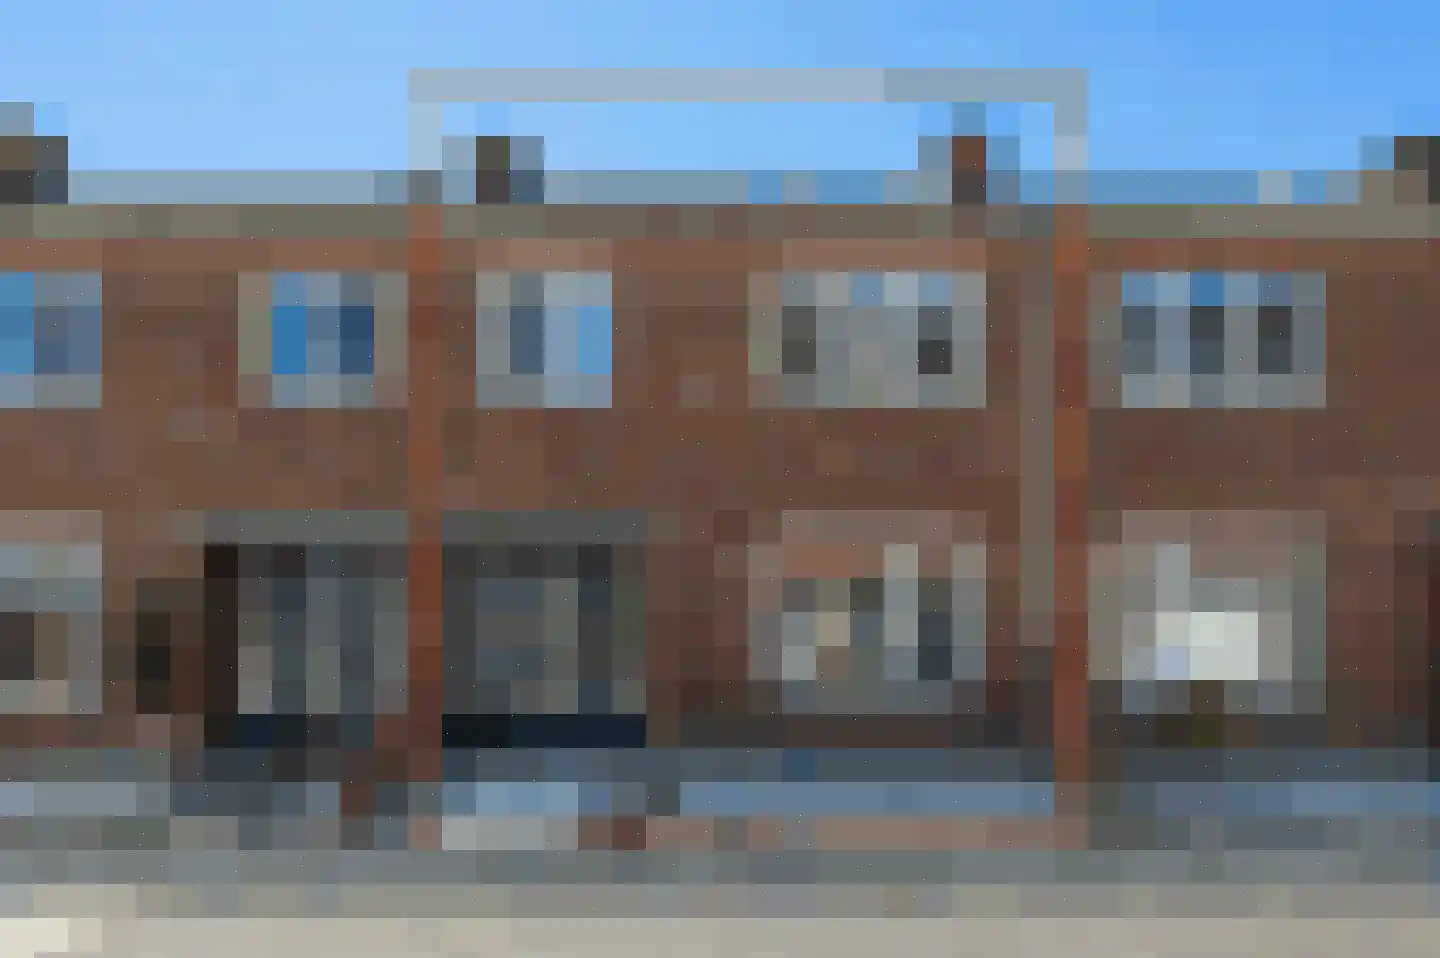
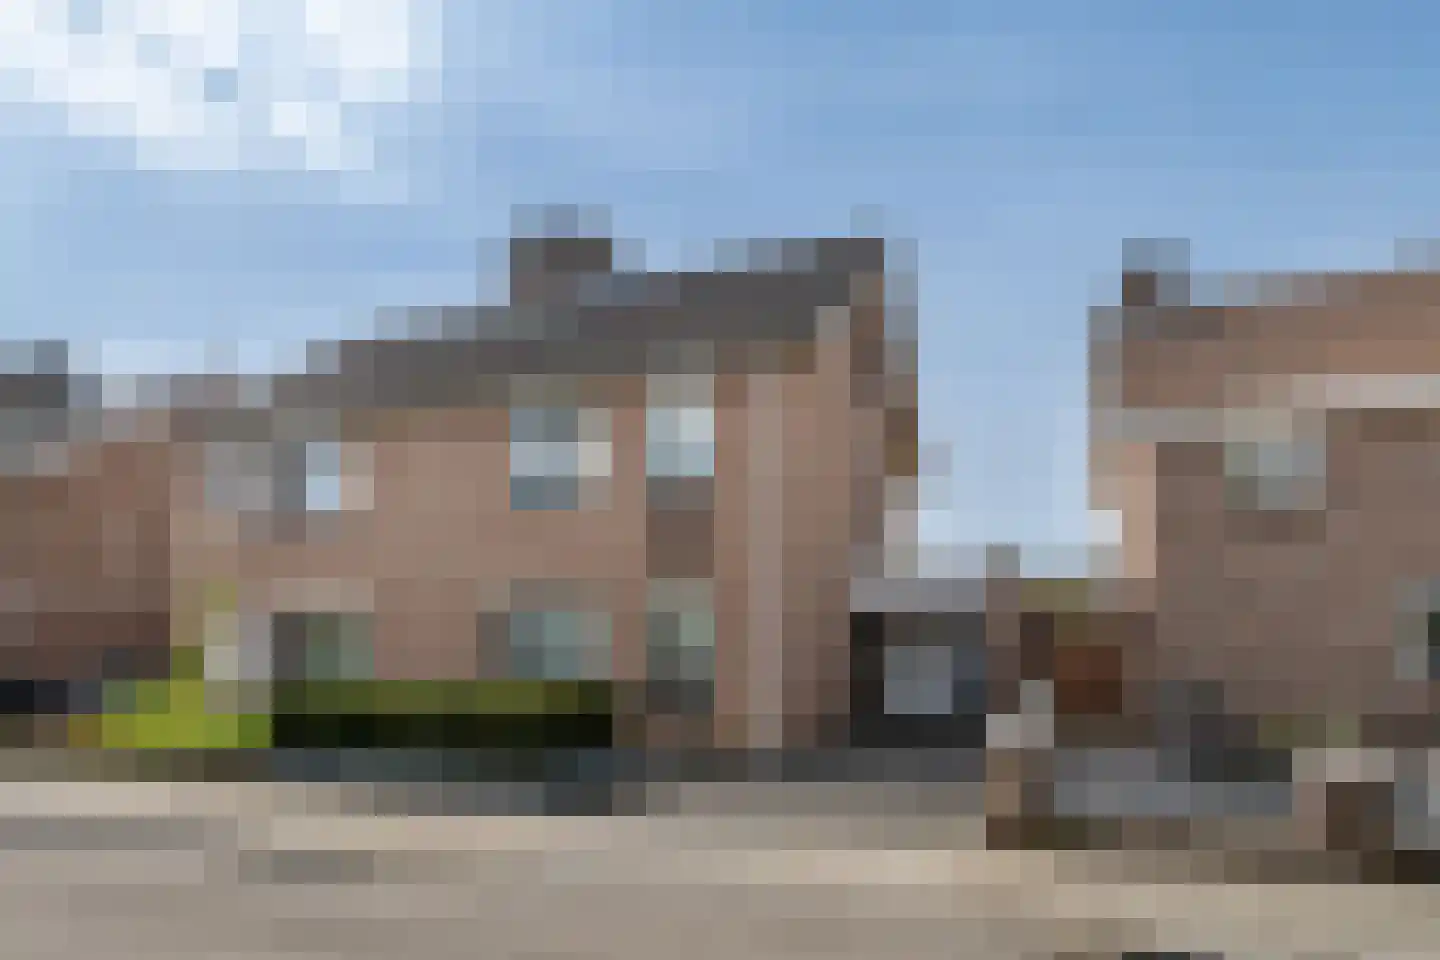
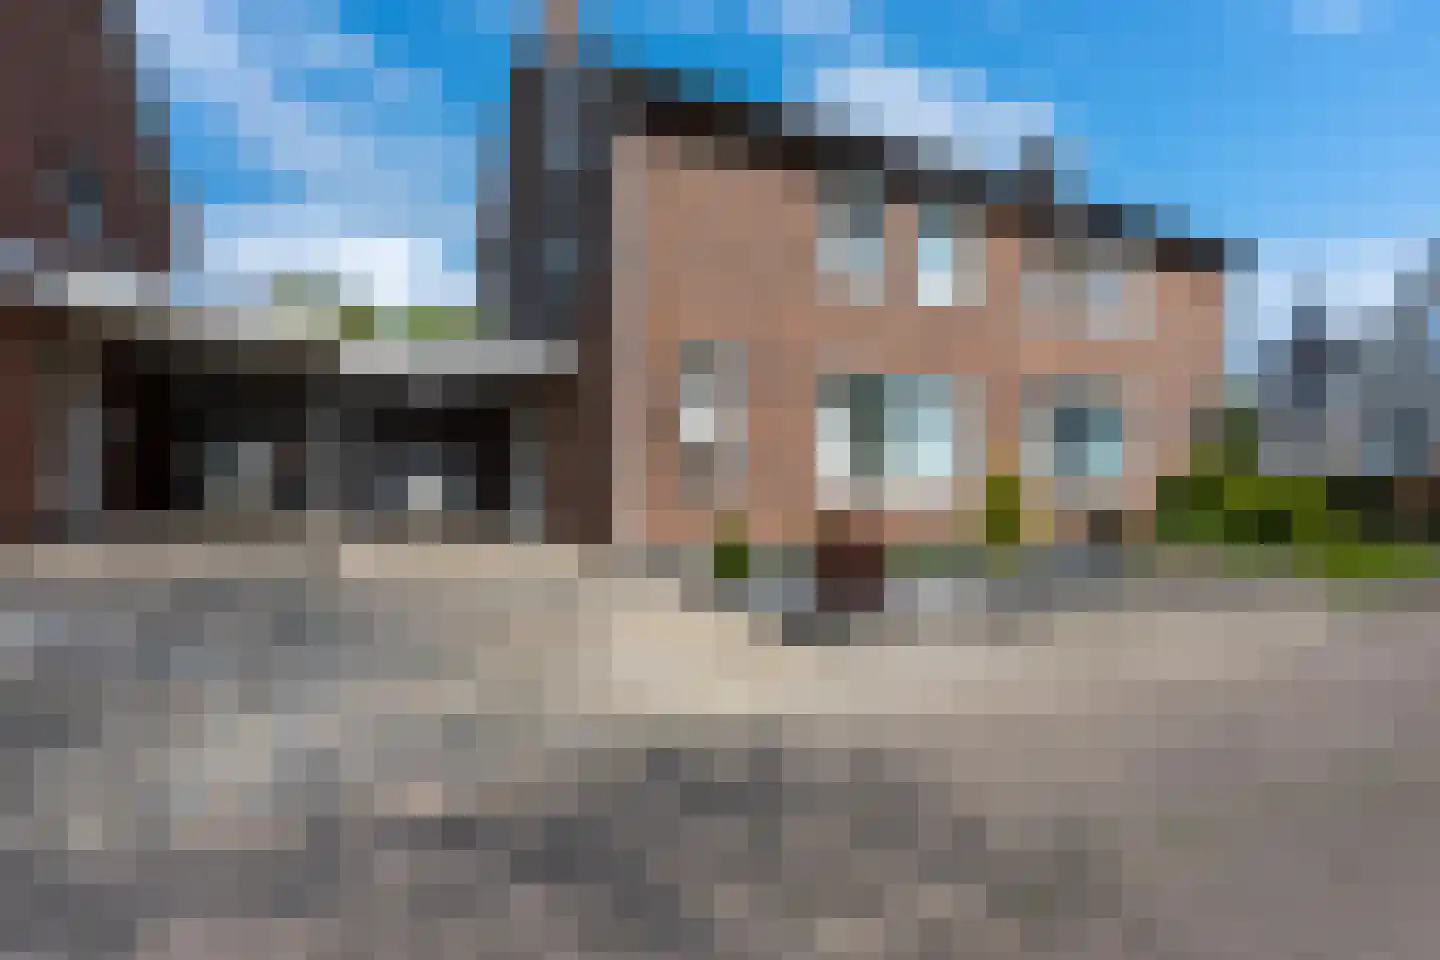
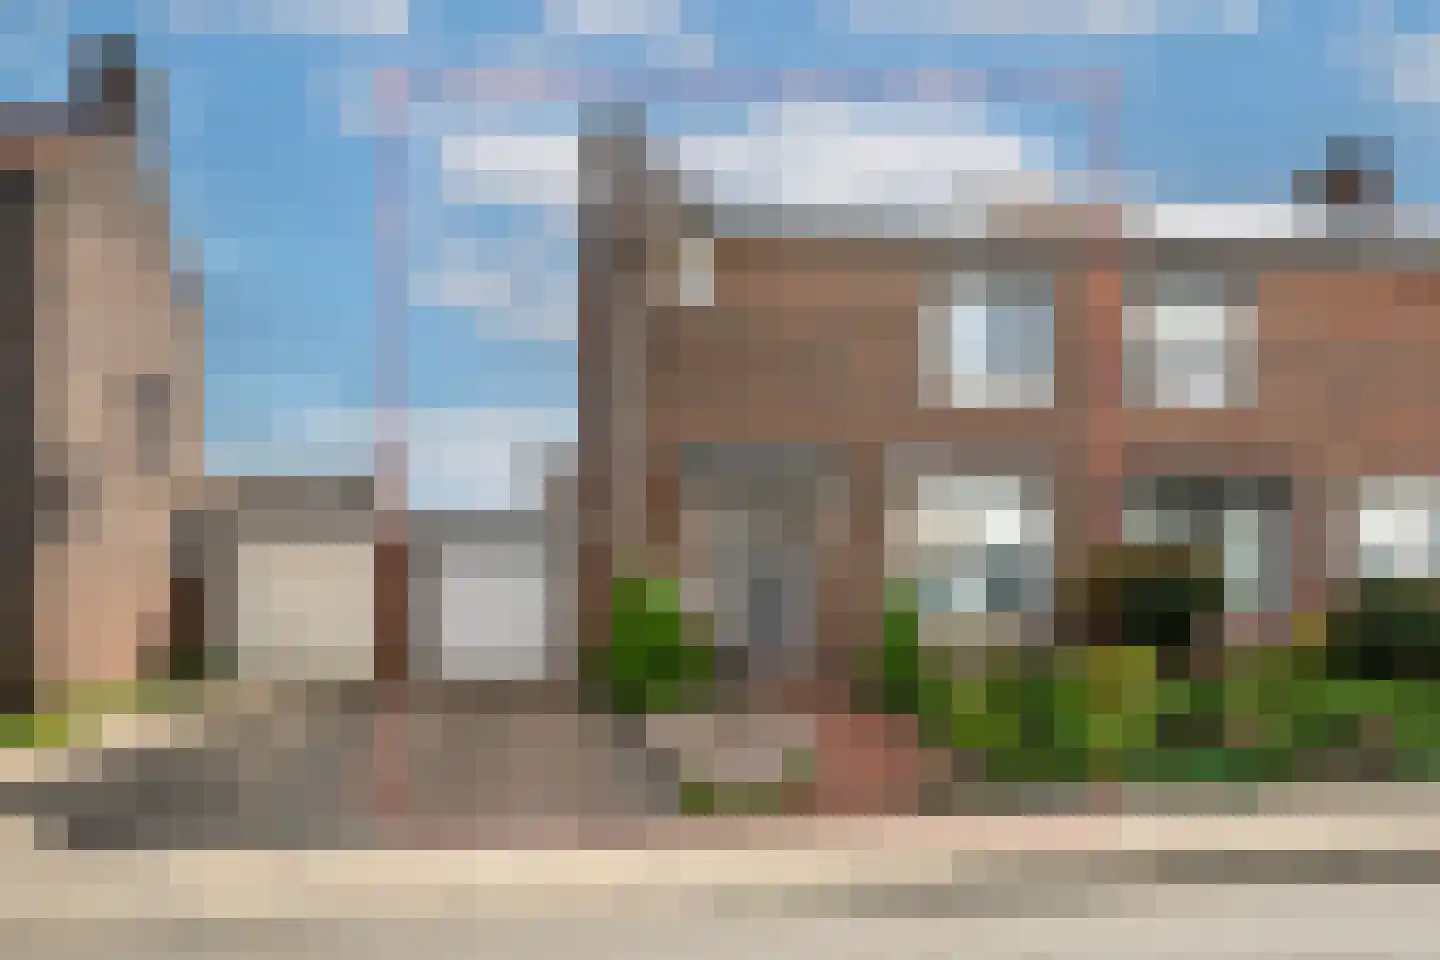
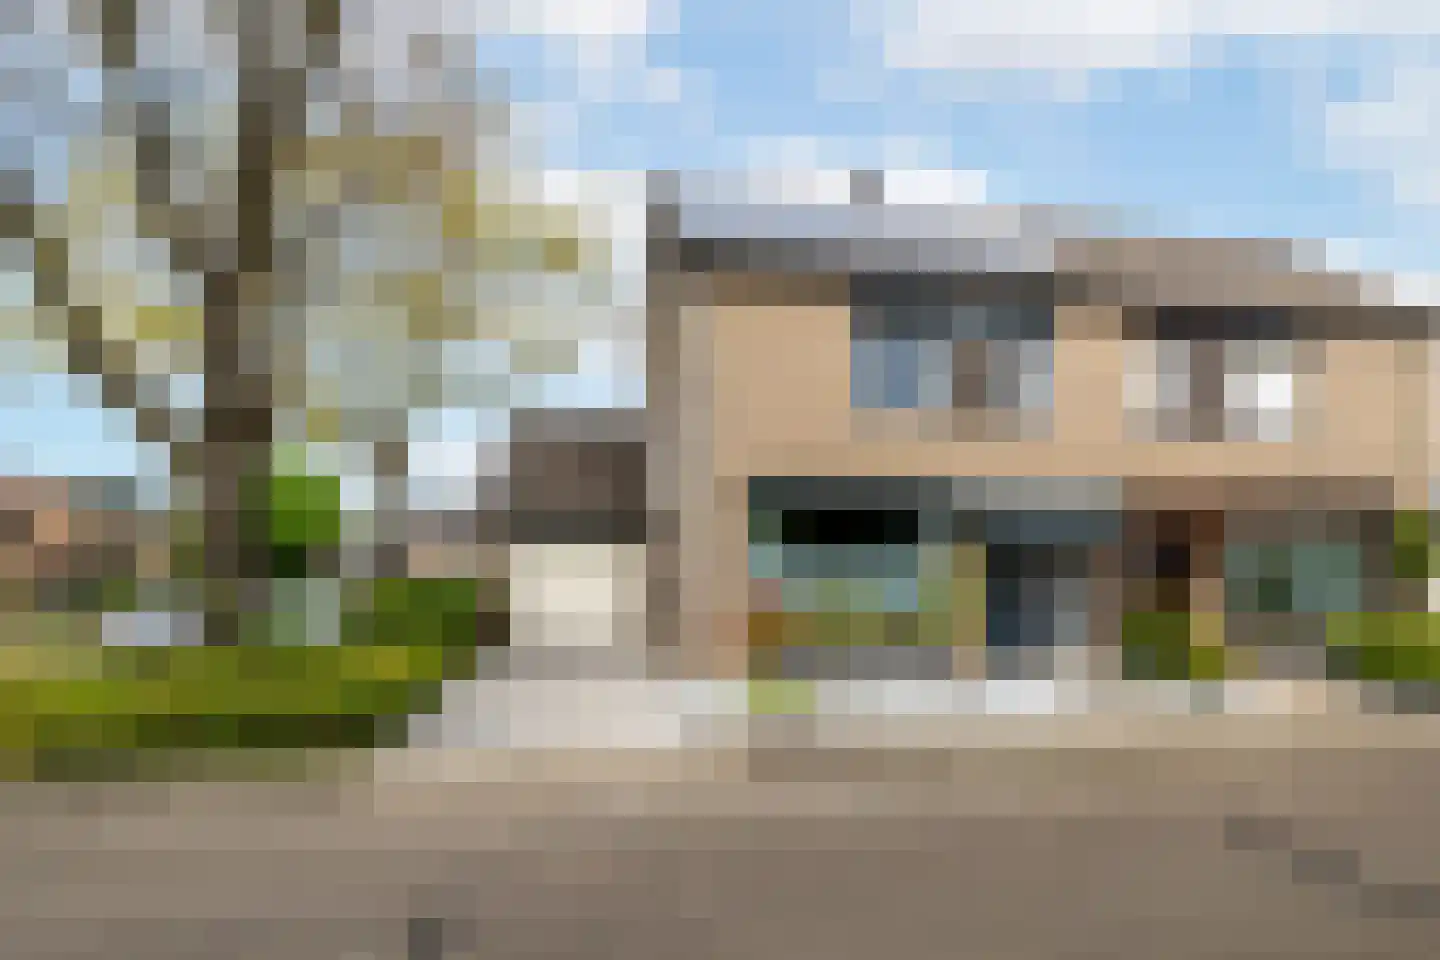
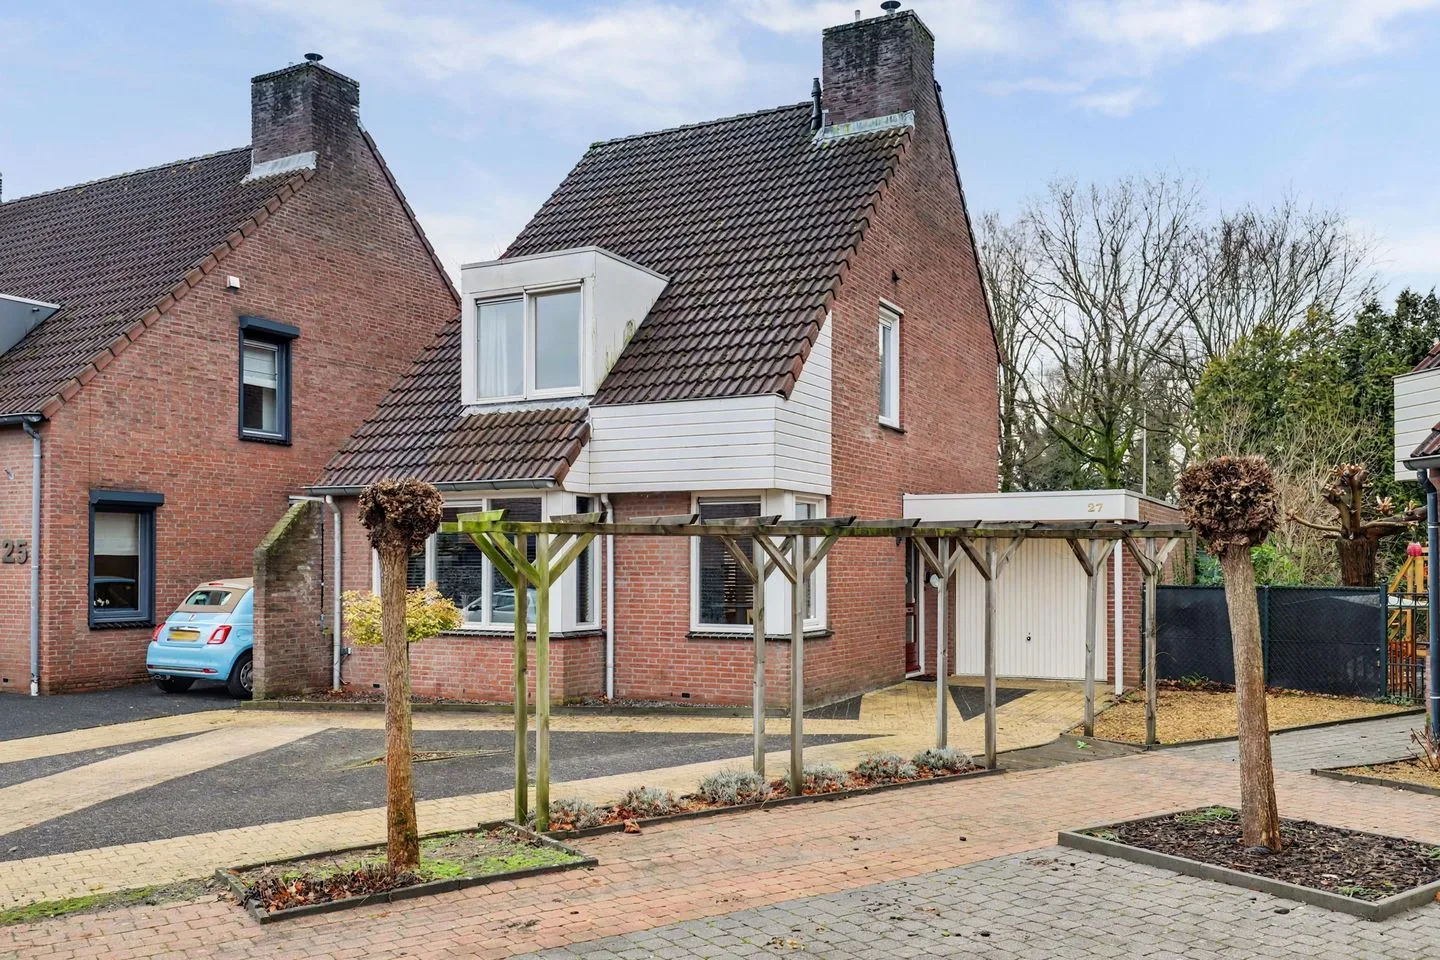
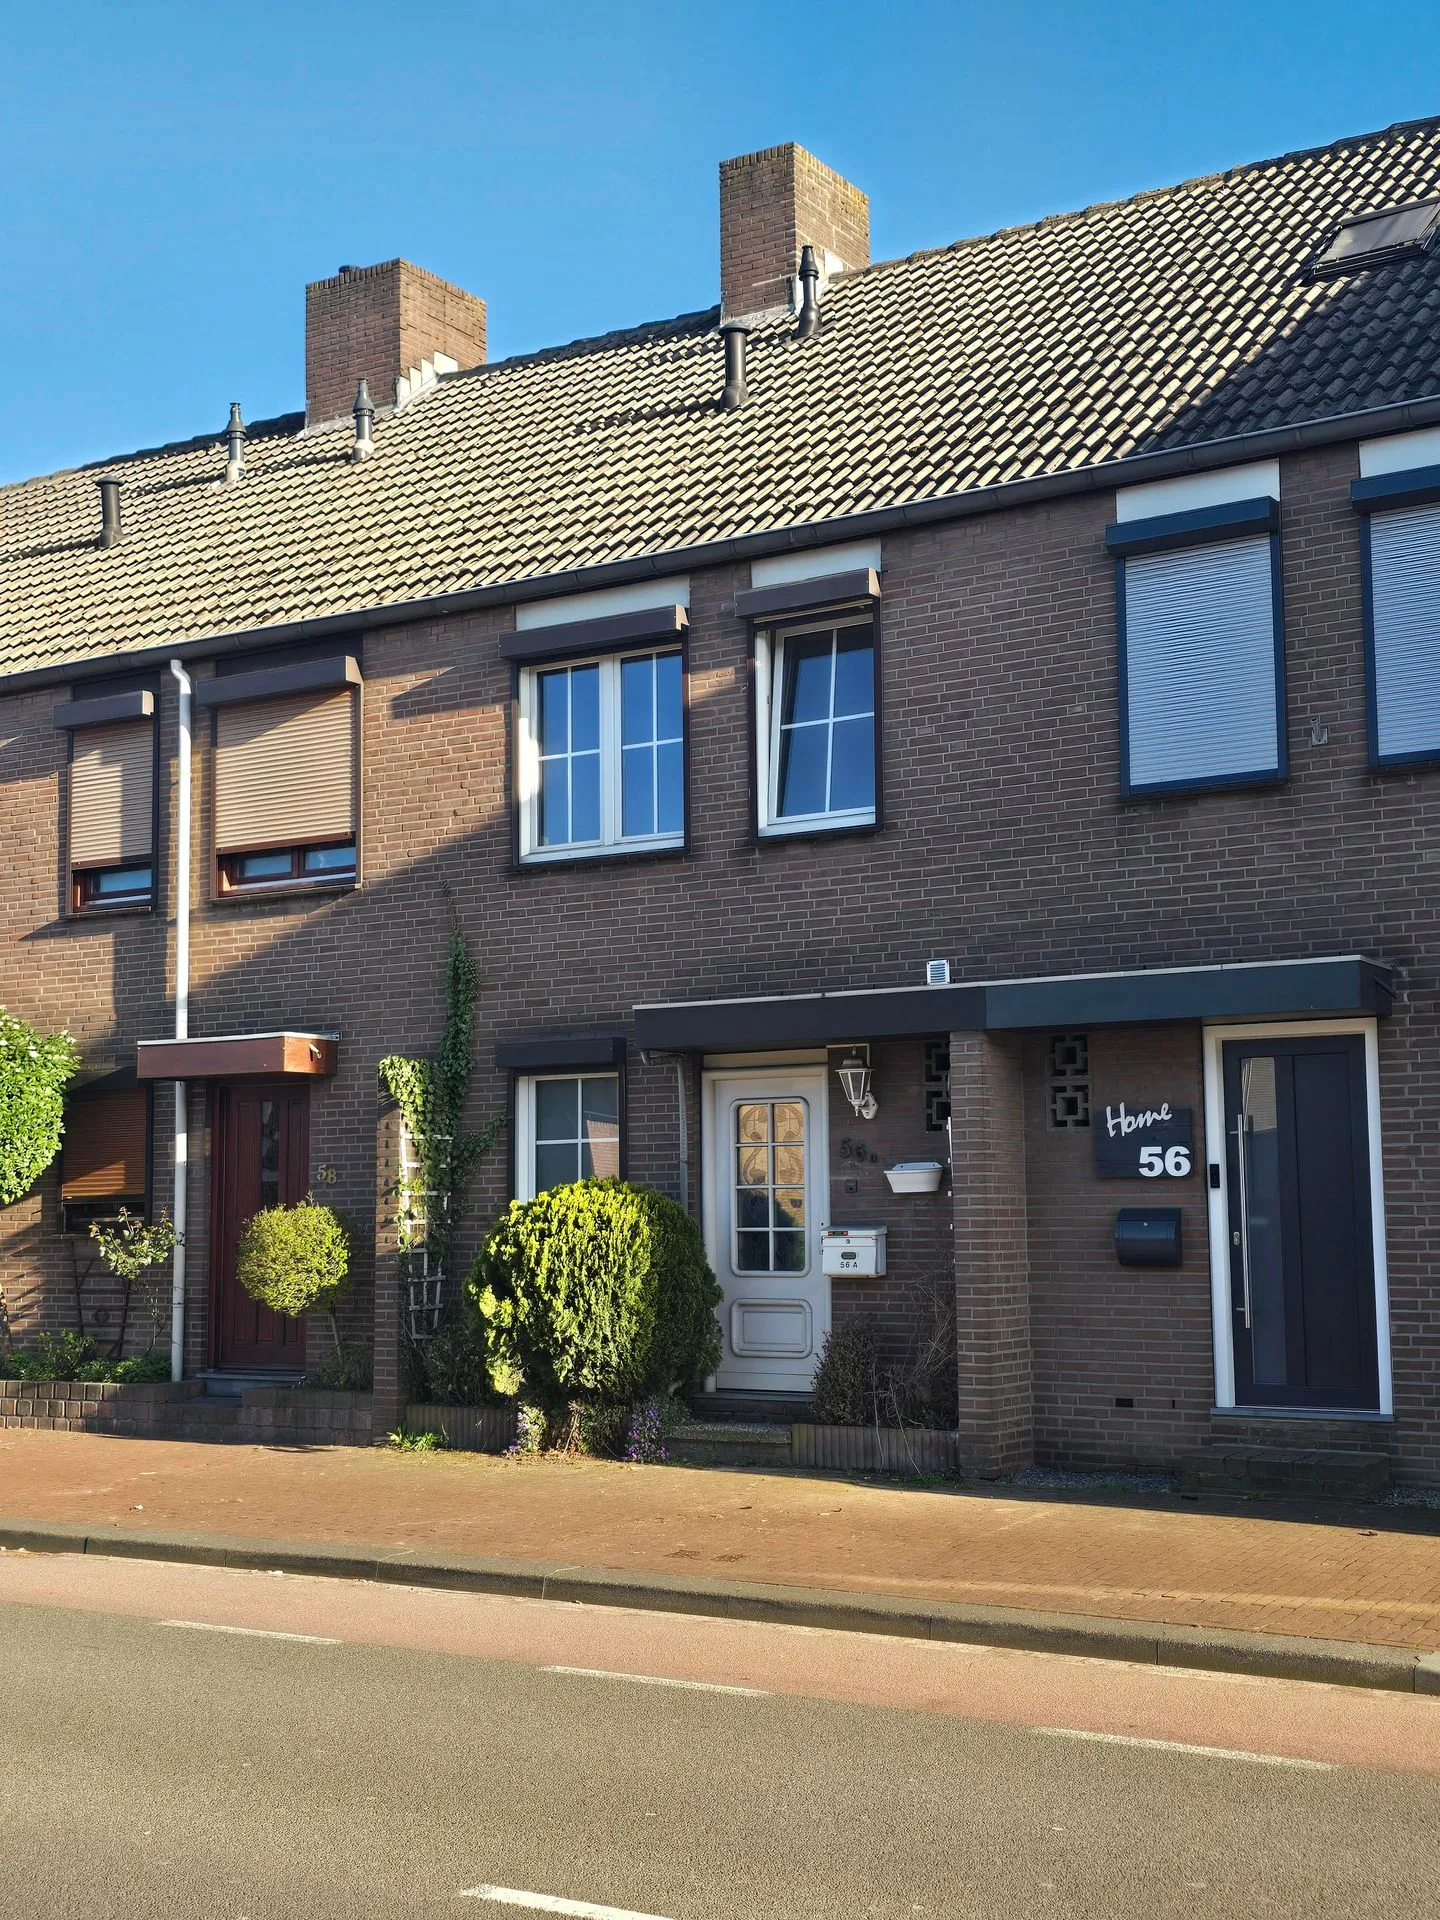
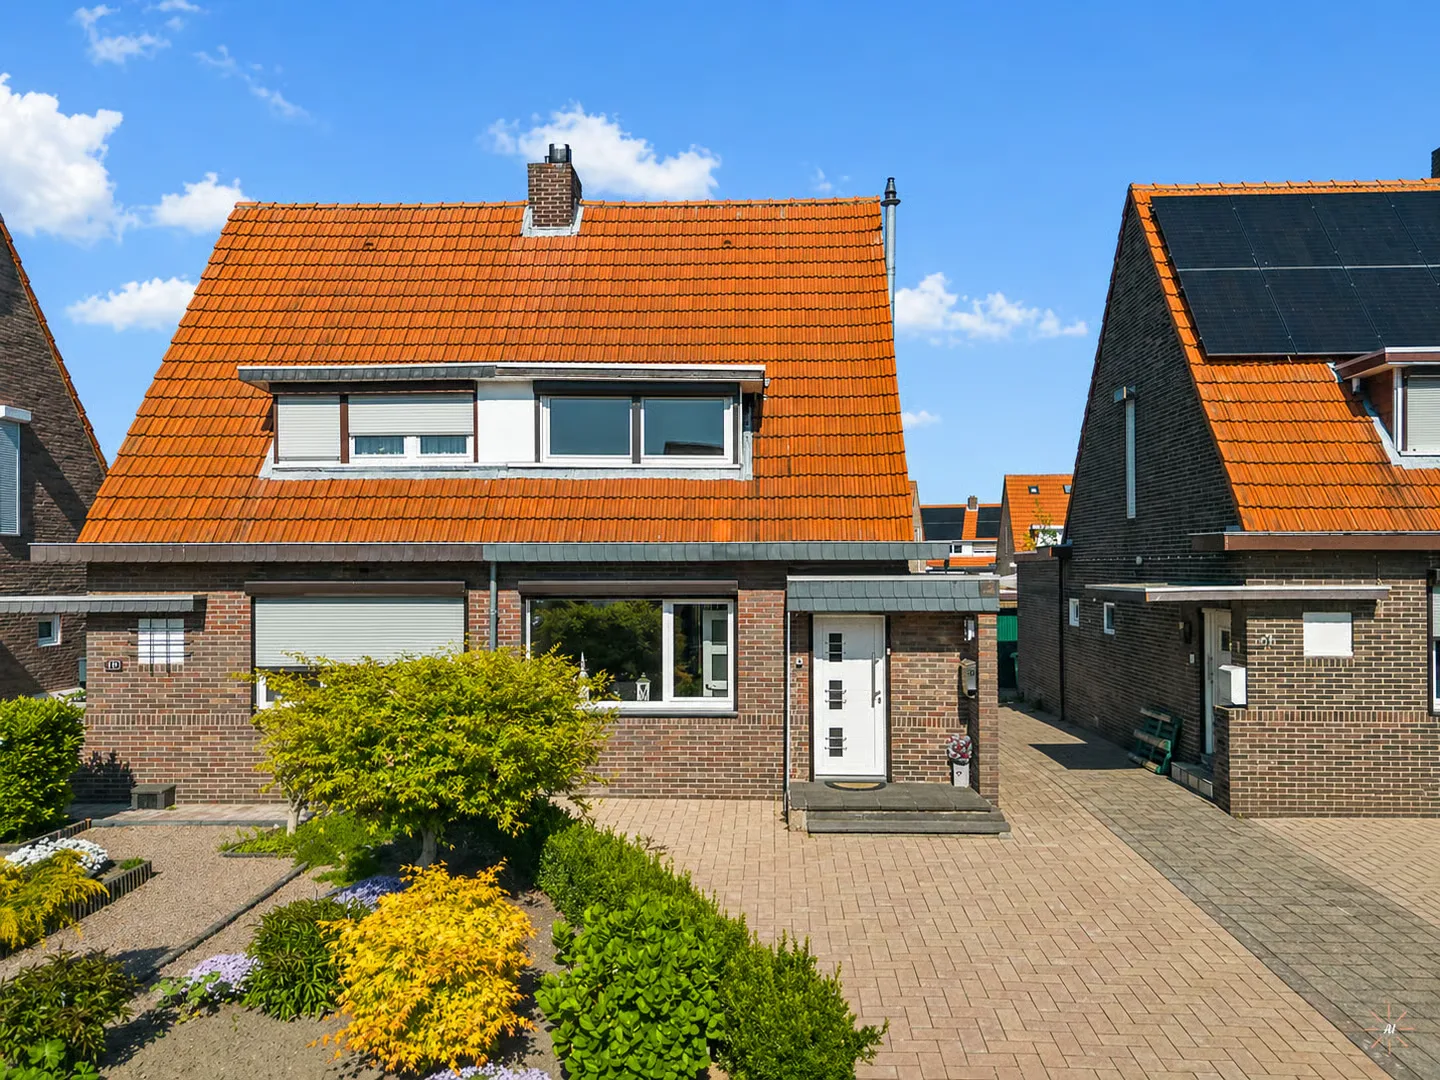
Nieuwenhagerstraat 19
6374XN Landgraaf
€ 215.000 k.k.
- Living area
- 78 m²
- Land area
- 256 m²
- Bedrooms
- 3
Searching in 475 houses in Landgraaf
Type to search. Use arrow down and arrow up to navigate through results and press Enter to open.
Hidden search suggestions.
View current properties in Landgraaf or search targeted on street, postal code and property characteristics.
View the current housing stock in Landgraaf and quickly filter by price, living area, rooms and more. There are currently 475 houses in this place within our selection. View also 310 sold houses in Landgraaf for extra insight into the local housing market.
6374XN Landgraaf
€ 215.000 k.k.
6374MS Landgraaf
€ 260.000 k.k.
6371CN Landgraaf
€ 725.000 k.k.
6374RW Landgraaf
€ 370.000 k.k.
6373LP Landgraaf
€ 309.000 k.k.
6374GN Landgraaf
€ 225.000 k.k.
€ 2.419/m²
6373XG Landgraaf
€ 449.000 k.k.
€ 3.351/m²
6373HJ Landgraaf
€ 239.000 k.k.
€ 2.366/m²
6373CK Landgraaf
€ 349.000 k.k.
€ 3.793/m²
6372AH Landgraaf
€ 235.000 k.k.
€ 3.357/m²
6372AX Landgraaf
€ 275.000 k.k.
€ 2.778/m²
6374PG Landgraaf
€ 679.000 k.k.
€ 3.612/m²
6374AS Landgraaf
€ 295.000 k.k.
€ 2.731/m²
6372KH Landgraaf
€ 419.000 k.k.
€ 2.993/m²
6374CZ Landgraaf
€ 398.000 k.k.
€ 2.948/m²
6374JA Landgraaf
€ 269.000 k.k.
€ 2.989/m²
6372LB Landgraaf
€ 398.000 k.k.
€ 3.289/m²
6374PN Landgraaf
€ 389.000 k.k.
€ 3.412/m²
6371GN Landgraaf
€ 1.075 p/m
€ 11/m²
6372TH Landgraaf
€ 298.000 k.k.
€ 2.785/m²
6371VT Landgraaf
€ 299.000 k.k.
€ 2.282/m²
6374VV Landgraaf
€ 250.000 k.k.
€ 2.809/m²
6374PG Landgraaf
€ 549.000 k.k.
€ 4.097/m²
6374VM Landgraaf
€ 199.000 k.k.
€ 2.261/m²
6374EC Landgraaf
€ 200.000 k.k.
€ 2.151/m²
6373KX Landgraaf
€ 315.000 k.k.
€ 2.864/m²
6373LV Landgraaf
€ 279.000 k.k.
€ 3.100/m²
6372NC Landgraaf
€ 329.000 k.k.
€ 2.653/m²
Get free quotes from real estate agents with local market knowledge. Compare more than 54 real estate agents in Landgraaf.
Selling a home in Landgraaf? View the sales-oriented guide sell a house in Landgraaf, compare all real estate agents in Landgraaf or view the top 10 real estate agents in Landgraaf for extra context to your choice.
Real estate agents make sharper offers when they know you're comparing — ask for quotes for sale or purchase.
Practical answers about housing supply, sales and comparing real estate agents in Landgraaf.
The costs of a real estate agent in Landgraaf depend on commission, setup costs, property presentation and the chosen service. Compare the 54 real estate agents in Landgraaf via the real estate agent page and request multiple quotes to compare rates and approach well.
Within our selection, we are currently showing 475 houses in Landgraaf. View also the sold houses in Landgraaf to compare the current offering with recent transactions.
Take into account not only price and living area but also maintenance, energy label, location, outdoor space and sales status. This way you compare houses in Landgraaf on more than just the asking price.
A local real estate agent knows the neighborhoods, recent transactions and demand in Landgraaf. By comparing 54 real estate agents in the region you get a better insight into prices, sales strategy and expected yield; the top 10 in Landgraaf provides a useful starting point.
Yes, when making a sales plan, a valuation in Landgraaf is wise. You gain insight into a realistic asking price and can then compare offers from real estate agents specifically.
View current location data on residents, WOZ development, housing stock, energy consumption, business activity and safety in Landgraaf. In 2026 were there 36.844 residents. The average WOZ value in 2025 is EUR 265.000.
These figures help to better assess and compare the housing stock in Landgraaf with recent sold homes. Orient yourself then on suitable top real estate agents in Landgraaf for sales advice in this region.
Residents
36.844
Last year: 2026
Average WOZ
EUR 265.000
Last year: 2025
Average income per person.
EUR 31.800
Source: AllNumbers
Crimes (current year)
1.375
Total registered
| Year | Residents |
|---|---|
| 2022 | 37.023 |
| 2023 | 37.175 |
| 2024 | 37.112 |
| 2025 | 36.839 |
| 2026 | 36.844 |
| Year | Average WOZ |
|---|---|
| 2021 | EUR 197.000 |
| 2022 | EUR 212.000 |
| 2023 | EUR 248.000 |
| 2024 | EUR 247.000 |
| 2025 | EUR 265.000 |
Hoger
23
Praktisch
34
Middelbaar
43
Europa
5.824
Nederland
27.859
Buiten Europa
3.156
Label C
4.932
Label A
3.139
Label B
2.575
Label D
2.345
Label F
2.076
Label G
1.573
Label E
1.278
Label A+
371
Label A+++
140
Label A++
120
Label A++++
22
Label A+++++
3
| Year | Gas (m3) | Electricity (kWh) |
|---|---|---|
| 2020 | 1.250 | 2.830 |
| 2021 | 1.430 | 2.870 |
| 2022 | 1.100 | 2.740 |
| 2023 | 910 | 2.660 |
| 2024 | 890 | 2.710 |
Hoekwoning
Gas: 950 • Electricity: 2.710
Huurwoning
Gas: 760 • Electricity: 2.080
Koopwoning
Gas: 1.000 • Electricity: 3.000
Appartement
Gas: 670 • Electricity: 1.900
Tussenwoning
Gas: 860 • Electricity: 2.630
Vrijstaande woning
Gas: 1.340 • Electricity: 3.890
Twee-onder-één-kap woning
Gas: 1.040 • Electricity: 2.920
Total number of company establishments: 3.090
| Period | Crimes |
|---|---|
| jan 2026 | 120 |
| jul 2025 | 128 |
| jun 2025 | 150 |
| mei 2025 | 124 |
| mrt 2025 | 114 |
| mrt 2026 | 106 |
| nov 2024 | 115 |
| nov 2025 | 103 |
| okt 2024 | 107 |
| okt 2025 | 108 |
| sep 2024 | 117 |
| sep 2025 | 104 |
These figures give an indicative picture of safety trends in the living environment of Landgraaf.
Short answers based on current local statistics, handy for a quick comparison of the living environment.
Landgraaf telt in 2026 ongeveer 36.844 inwoners.
De gemiddelde WOZ-waarde in Landgraaf is in 2025 circa € 265.000.
Het gemiddelde inkomen per inwoner in Landgraaf ligt rond € 31.800 per jaar.
Voor het huidige jaar gaat het om ongeveer 1.375 geregistreerde misdrijven. Gebruik deze cijfers als indicatie en vergelijk trends per periode.
In Landgraaf komt vooral "Tussenwoningen" veel voor, met ongeveer 5.704 woningen.