
Residents
3.000
Last year: 2025
4128CK Lexmond • Utrecht
For this property, no detailed description is available yet.
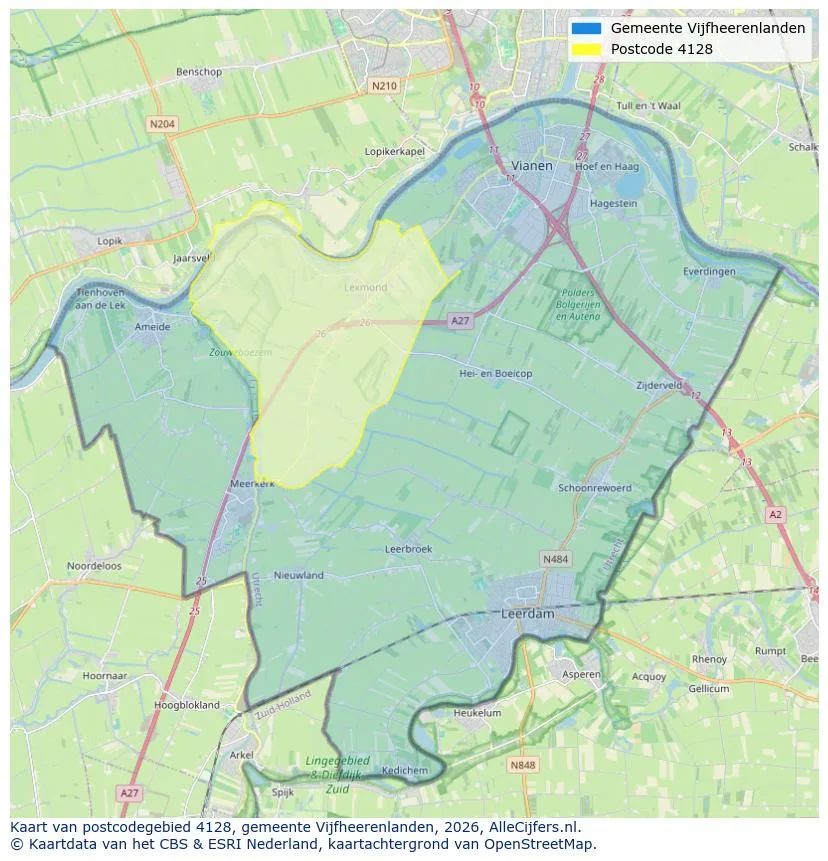
View the location and discover the brokers in this region
View current location data on residents, WOZ development, housing stock, energy consumption, business activity and safety in Lexmond. In 2025 were there 3.000 residents. The average WOZ value in 2025 is EUR 459.469.
Residents
3.000
Last year: 2025
Average WOZ
EUR 459.469
Last year: 2025
Average income per person.
EUR 33.428
Source: AllNumbers
Crimes (current year)
68
Total registered
| Year | Residents |
|---|---|
| 2021 | 2.960 |
| 2022 | 2.955 |
| 2023 | 2.970 |
| 2024 | 3.010 |
| 2025 | 3.000 |
| Year | Average WOZ |
|---|---|
| 2021 | EUR 312.929 |
| 2022 | EUR 378.381 |
| 2023 | EUR 434.143 |
| 2024 | EUR 439.333 |
| 2025 | EUR 459.469 |
Hoger
540
Praktisch
540
Middelbaar
1.110
Europa
115
Nederland
2.725
Buiten Europa
160
Label A
399
Label C
241
Label G
215
Label B
146
Label D
87
Label F
80
Label E
40
Label A+
36
Label A++
10
Label A+++
10
Label A++++
0
Label A+++++
0
| Year | Gas (m3) | Electricity (kWh) |
|---|---|---|
| 2020 | 1.366 | 3.110 |
| 2021 | 1.519 | 3.190 |
| 2022 | 1.205 | 3.014 |
| 2023 | 1.018 | 2.911 |
| 2024 | 989 | 3.012 |
Hoekwoning
Gas: 658 • Electricity: 1.765
Huurwoning
Gas: 876 • Electricity: 2.123
Koopwoning
Gas: 1.086 • Electricity: 3.245
Appartement
Gas: 806 • Electricity: 2.383
Tussenwoning
Gas: 561 • Electricity: 1.548
Vrijstaande woning
Gas: 1.360 • Electricity: 3.933
Twee-onder-één-kap woning
Gas: 1.086 • Electricity: 3.126
Total number of company establishments: 510
| Period | Crimes |
|---|---|
| jan 2026 | 7 |
| jul 2025 | 7 |
| jun 2025 | 10 |
| mei 2025 | 7 |
| mrt 2025 | 6 |
| mrt 2026 | 5 |
| nov 2024 | 5 |
| nov 2025 | 5 |
| okt 2024 | 6 |
| okt 2025 | 7 |
| sep 2024 | 2 |
| sep 2025 | 1 |
These figures give an indicative picture of safety trends in the living environment of Lexmond.
Short answers based on current local statistics, handy for a quick comparison of the living environment.
Lexmond telt in 2025 ongeveer 3.000 inwoners.
De gemiddelde WOZ-waarde in Lexmond is in 2025 circa € 459.469.
Het gemiddelde inkomen per inwoner in Lexmond ligt rond € 33.428 per jaar.
Voor het huidige jaar gaat het om ongeveer 68 geregistreerde misdrijven. Gebruik deze cijfers als indicatie en vergelijk trends per periode.
In Lexmond komt vooral "Vrijstaande woningen" veel voor, met ongeveer 357 woningen.
View more homes in this location.

4128LS Lexmond
€ 1.379.000 k.k.
€ 5.345/m²

4128SG Lexmond
€ 425.000 k.k.
€ 3.602/m²

4128EA Lexmond
€ 839.000 k.k.
€ 4.347/m²

4128AA Lexmond
€ 720.000 k.k.
€ 5.070/m²

4128LW Lexmond
€ 1.985.000 k.k.
€ 6.941/m²

4128CP Lexmond
€ 725.000 k.k.
€ 5.754/m²

4128LL Lexmond
€ 1.100.000 k.k.
€ 5.729/m²

4128BZ Lexmond
€ 595.000 k.k.
€ 3.419/m²
