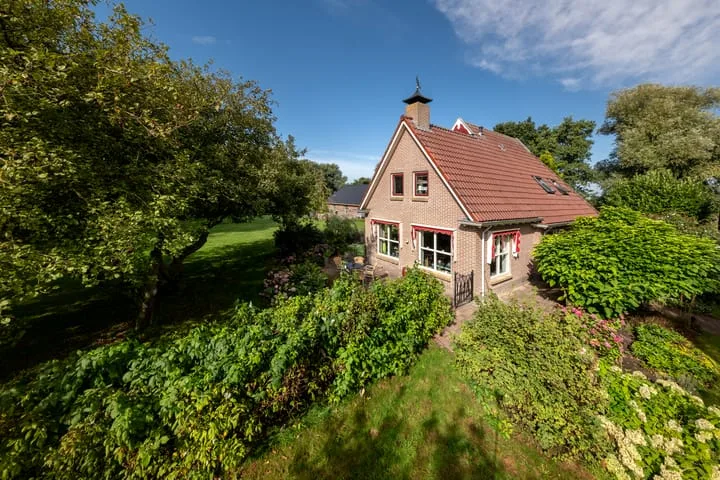
- Sold
Kersenlaan 18
9919KE Loppersum
€ 599.000 k.k.
€ 3.544/m²
- Living area
- 169 m²
- Land area
- 672 m²
- Bedrooms
- 4
View 20 sold houses in Loppersum
Type to search. Use arrow down and arrow up to navigate through results and press Enter to open.
Hidden search suggestions.
Compare sold homes in Loppersum or view the current offering in this location directly.
On this page you will find recently sold homes in Loppersum. Use this overview to better estimate selling prices, popular neighborhoods, and the local housing supply before you choose a real estate agent. Also view the current housing supply with 25 houses in Loppersum.
9919KE Loppersum
€ 599.000 k.k.
€ 3.544/m²
9919HH Loppersum
€ 345.000 k.k.
€ 3.026/m²
9919JP Loppersum
€ 299.000 k.k.
€ 2.990/m²
9919KH Loppersum
€ 635.000 k.k.
€ 3.527/m²
9919BE Loppersum
€ 299.000 k.k.
€ 2.847/m²
9919AR Loppersum
€ 435.000 k.k.
€ 3.270/m²
9919JS Loppersum
€ 695.000 k.k.
€ 3.492/m²
9919HB Loppersum
€ 449.000 k.k.
€ 3.207/m²
9919AG Loppersum
€ 389.000 k.k.
€ 2.924/m²
9919AZ Loppersum
€ 325.000 k.k.
€ 2.272/m²
9919TC Loppersum
€ 750.000 k.k.
€ 4.143/m²
9919AC Loppersum
€ 585.000 k.k.
€ 3.362/m²
9919KA Loppersum
€ 325.000 k.k.
€ 2.620/m²
9919KD Loppersum
€ 295.000 k.k.
€ 2.809/m²
9919HE Loppersum
€ 297.500 k.k.
€ 3.342/m²
9919BG Loppersum
€ 425.000 k.k.
€ 2.972/m²
9919BS Loppersum
€ 489.000 k.k.
€ 3.732/m²
9919KH Loppersum
€ 549.000 k.k.
€ 3.684/m²
9919HM Loppersum
€ 319.000 k.k.
€ 3.797/m²
9919TE Loppersum
€ 419.500 k.k.
€ 2.913/m²
Bekijk recente verkopen en ontvang gratis offertes van lokale makelaars. Vergelijk meer dan 19 makelaars in Loppersum.
Zelf je woning verkopen in Loppersum? Vergelijk verkoopmakelaars in Loppersum of bekijk de beste verkoopmakelaars in Loppersum als referentie bij jouw keuze.
Makelaars maken scherpere voorstellen als ze weten dat je vergelijkt — vraag offertes aan voor verkoop of aankoop.
Short answers about housing prices, sold homes and comparing real estate agents in Loppersum.
De kosten van een makelaar in Loppersum verschillen per kantoor, woningtype en verkoopaanpak. In Loppersum kun je 19 real estate agents vergelijken; bekijk daarom ook de makelaars in Loppersum om tarieven, presentatie en lokale ervaring beter naast elkaar te zetten.
On this page we currently show 20 sold houses in Loppersum from our selection. This helps you to better assess recent transactions and the local housing market.
Houses sold in Loppersum give insight into asking prices, house types and neighborhoods where recent transactions have taken place. Compare this also with the current housing stock in Loppersum to better understand the market.
You can use sold homes as a first market indication, but a local real estate agent can better take into account finishing, location, maintenance and current demand in Loppersum.
Vergelijk de 19 real estate agents in Loppersum op lokale verkoopervaring, reviews, verwachte opbrengst, courtage en marketingaanpak. Bekijk verkoopmakelaars in Loppersum of de top 10 makelaars in Loppersum om snel sterke kantoren te ontdekken.
View current location data on residents, WOZ development, housing stock, energy consumption, business activity and safety in Loppersum. In 2025 were there 2.243 residents. The average WOZ value in 2025 is EUR 272.383.
These figures help to better assess and compare the housing stock in Loppersum with recent sold homes. Orient yourself then on suitable top real estate agents in Loppersum for sales advice in this region.
Residents
2.243
Last year: 2025
Average WOZ
EUR 272.383
Last year: 2025
Average income per person.
EUR 29.300
Source: AllNumbers
Crimes (current year)
46
Total registered
| Year | Residents |
|---|---|
| 2021 | 2.282 |
| 2022 | 2.267 |
| 2023 | 2.290 |
| 2024 | 2.295 |
| 2025 | 2.243 |
| Year | Average WOZ |
|---|---|
| 2021 | EUR 171.377 |
| 2022 | EUR 196.058 |
| 2023 | EUR 224.518 |
| 2024 | EUR 237.222 |
| 2025 | EUR 272.383 |
Hoger
444
Praktisch
307
Middelbaar
851
Europa
28
Nederland
2.101
Buiten Europa
113
Label A
262
Label G
225
Label A+++
180
Label B
125
Label C
87
Label E
84
Label A++++
79
Label F
59
Label D
46
Label A+
16
Label A++
7
Label A+++++
0
| Year | Gas (m3) | Electricity (kWh) |
|---|---|---|
| 2020 | 1.416 | 2.637 |
| 2021 | 1.361 | 2.763 |
| 2022 | 1.085 | 2.560 |
| 2023 | 837 | 2.642 |
| 2024 | 744 | 2.889 |
Hoekwoning
Gas: 340 • Electricity: 2.941
Huurwoning
Gas: 570 • Electricity: 2.310
Koopwoning
Gas: 1.010 • Electricity: 2.877
Appartement
Gas: 652 • Electricity: 1.409
Tussenwoning
Gas: 293 • Electricity: 2.742
Vrijstaande woning
Gas: 1.229 • Electricity: 2.944
Twee-onder-één-kap woning
Gas: 782 • Electricity: 2.468
Total number of company establishments: 227
| Period | Crimes |
|---|---|
| jan 2025 | 5 |
| jan 2026 | 4 |
| jul 2025 | 6 |
| jun 2025 | 3 |
| mei 2025 | 2 |
| mrt 2025 | 8 |
| nov 2024 | 4 |
| nov 2025 | 0 |
| okt 2024 | 6 |
| okt 2025 | 2 |
| sep 2024 | 4 |
| sep 2025 | 6 |
These figures give an indicative picture of safety trends in the living environment of Loppersum.
Short answers based on current local statistics, handy for a quick comparison of the living environment.
Loppersum telt in 2025 ongeveer 2.243 inwoners.
De gemiddelde WOZ-waarde in Loppersum is in 2025 circa € 272.383.
Het gemiddelde inkomen per inwoner in Loppersum ligt rond € 29.300 per jaar.
Voor het huidige jaar gaat het om ongeveer 46 geregistreerde misdrijven. Gebruik deze cijfers als indicatie en vergelijk trends per periode.
In Loppersum komt vooral "Vrijstaande woningen" veel voor, met ongeveer 520 woningen.