Residents
39.695
Last year: 2025
3605EE Maarssen • Utrecht
€ 485.000 k.k.
Cost of copper (estimated): € 11.550
2% transfer tax (€ 9.700) + notary (€ 1.150) + valuation (€ 700)
Total incl. VAT: € 496.550
Purchase price /m²: € 5.843
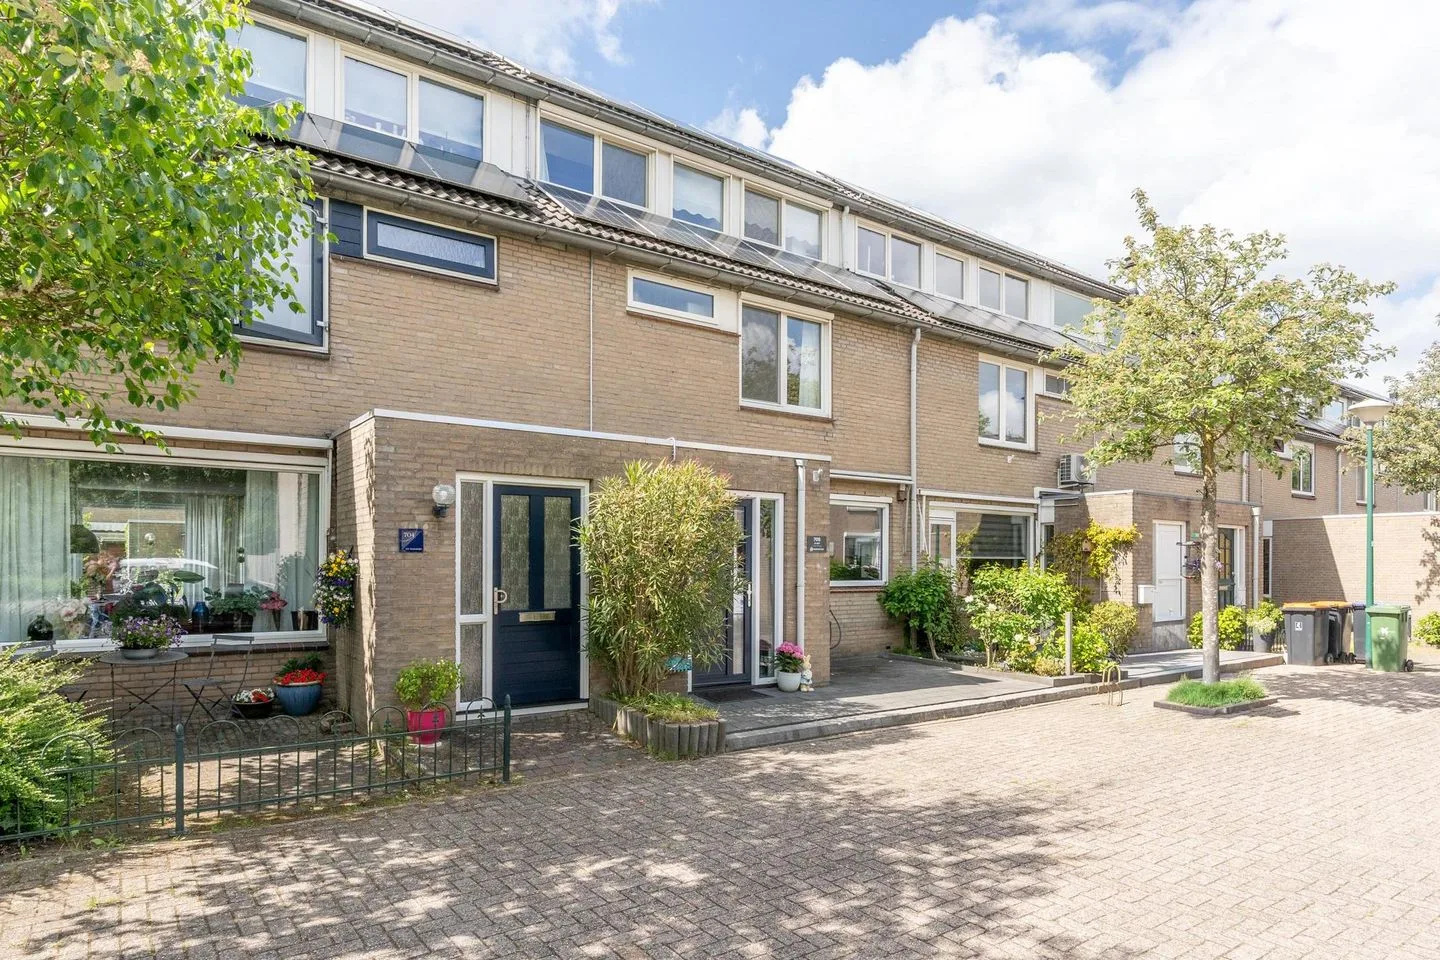
Bijzonder fraaie en uitstekend onderhouden EENGEZINSWONING (middenwoning) met inpandige berging, voortuin en een zonnige en fraai aangelegde, besloten achtertuin (op het noordoosten) met een overkapping, gelegen op een verhoogd terras. De woning is goed bereikbaar en ligt aan een rustig woonerf op loopafstand van onder meer speelgelegenheid voor kinderen, basisscholen, OV-aansluitingen en winkelcentrum Bisonspoor. Maarssenbroek is mede dankzij de centrale ligging uitstekend bereikbaar: het ligt aan de N230, heeft een afslag aan de A2 en een eigen NS-station. Maarssenbroek heeft ook een prima voorzieningenniveau: zo vind je er naast winkelcentrum Bisonspoor onder meer scholen voor basis- en voortgezet onderwijs, goede kinderdagopvang- en gezondheidszorgvoorzieningen, verschillende sportverenigingen (o.a. voetbal, tennis, atletiek en in Maarssen-dorp hockey en korfbal), een modern zwembad, goede openbaar vervoeraansluitingen (bus én trein), een park en in de directe omgeving veel natuurschoon. Maarssenbroek heeft ongeveer 23.000 inwoners. Indeling Begane grond - inpandige, maar alleen van buitenaf bereikbare fietsenberging; - entree met meterkast; - luxe toiletruimte met hangend closet en fonteintje; - grote voorraadkast met onder meer de opstelplaats voor de wasmachine en een 2e vriezer; - bijzonder luxe, L-vormige, open keuken (Schüller) met Siemens inbouwapparatuur, een zwart granieten aanrechtblad en veel kastruimte; - ingebouwd zijn een inductiekookplaat met kookveldafzuiging, oven, combimagnetron, Quooker kraan, koel-/vriescombinatie en een vaatwasmachine; - sfeervolle en bijna 5,50 meter brede woonkamer met convectorput, airco, open trap en een vide met een Velux dakraam; - in de gang, de keuken en de woonkamer ligt een Jatoba parketvloer. Eerste verdieping - overloop; - ouderslaapkamer met dakkapel, een houten vloer en een verlaagd plafond met inbouwverlichting; - slaapkamer 2 (in gebruik als kastenkamer); - slaapkamer 3; - luxe badkamer met ligbad/douche, hangend closet, een dubbel wastafelmeubel en een verlaagd plafond met inbouwverlichting; - op de vide, de overloop en op 2 van de 3 de slaapkamers ligt een Jatoba parketvloer. Tweede verdieping - zolder, bereikbaar middels een vlizotrap; - de opstelplaats(en) voor de verwarmingsketel, de boiler en de MV-unit; - bergruimte. Bijzonderheden - INSTAPKLARE WONING!; - de woning is tijdens de bouw voorzien van spouwmuur- en dakisolatie; - voorzien van houten kozijnen, ramen en deuren met dubbele beglazing; - keuken vernieuwd (2025); - verwarmingsketel vernieuwd (2024); - 9 zonnepanelen geplaatst (2024); - groepenkast uitgebreid tot 14 groepen (2024); - nieuwe binnendeurkozijnen en (stompe) binnendeuren; - vrijwel de gehele woning is voorzien van glad stuukwerk; - binnen- en buitenschilderwerk in uitstekende conditie; - zowel binnen als buiten een werkelijk uitstekend onderhouden woning; - glasvezelkabel aangesloten; - inclusief zonnescherm aan de voorzijde; - de bubbelbad-functie van het ligbad is defect; - aantrekkelijke ligging en prettige woonomgeving; - uitstekend voorzieningenniveau (winkels, scholen, openbaar vervoer, enz.). Kengetallen Bouwjaar: 1980 Kadastrale gegevens: Maarssen, B 8755 Perceeloppervlak: 145 m² Eigen grond of erfpacht: eigen grond Erfpachtcanon: n.v.t. Gebruiksoppervlakte wonen: 83 m² (exclusief de vliering) Overige inpandige ruimte: 10 m² Gebouw-gebonden buitenruimte: 0 m² Externe bergruimte: 16 m² (overkapping) Netto inhoud (inclusief overige inpandige ruimte): 226 m³ Bruto inhoud (inclusief overige inpandige ruimte): 322 m³ Aantal kamers: 4 Woonkamer: 26 m² Open keuken: 9,8 m² Slaapkamer 1 - 1e verdieping: 11 m² Slaapkamer 2 - 1e verdieping: 9 m² Slaapkamer 3 - 1e verdieping: 8,5 m² Badkamer 1e verdieping: 3,9 m² Vliering: 8 m² Merk en bouwjaar verwarmingsketel: Intergas Xtreme 30 CW4 (2024) Warm tapwater: middels een 115 liter Bosch Tronic 4000 T elektrische boiler Airco: Mitsubishi SRK35ZS-WF 3,5 kW + wifi-module (2023) Mechanische ventilatie: ja (2020) Vloerisolatie: Spouwmuurisolatie: aangebracht tijdens de bouw Dakisolatie: aangebracht tijdens de bouw Dubbele beglazing: ja Zonnepanelen: 9 stuks (2024) a 435 Wp met een micro-omvormer per paneel en fabrieksgarantie op de zonnepanelen tot april 2049 (opbrengst in 2025: circa 3.200 kWh) Energielabel: definitief energielabel B, geldig tot 05-02-2036 Garage, carport of eigen parkeerplaats: nee Berging: inpandige berging Voortuin: ja (zuidwest) Achtertuin: ja (noordoost; circa 10,00 x circa 5,64) Staat van onderhoud binnen: uitstekend Staat van onderhoud buiten: uitstekend Publiekrechtelijke beperkingen: er zijn geen WKPB-beperkingen bekend - De koopovereenkomst zal worden gesloten op basis van de NVM koopakte; - De woning is gemeten door een externe partij conform de branche-brede meetinstructie (BBMI). Een meetrapport is beschikbaar; - De verkoop geschiedt onder voorbehoud van gunning. Aanvaarding: september 2026 (in overleg). BEZICHTIGINGEN - interesse? GRAAG ONTVANGEN WIJ UW BEZICHTIGINGSAANVRAAG VIA FUNDA. - of schakel uw eigen NVM-aankoopmakelaar in. Een NVM-aankoopmakelaar behartigt uw belangen en kan u tijd, geld en zorgen besparen. U vindt een NVM-aankoopmakelaar op Funda. Deze aanmelding is met de grootste zorgvuldigheid samengesteld. Aan eventuele onjuistheden kunnen geen rechten worden ontleend. Prijswijzigingen en/of drukfouten voorbehouden.
€ 485.000
Cost of copper (estimated): € 11.550
2% transfer tax (€ 9.700) + notary (€ 1.150) + valuation (€ 700)
Total purchase (incl. p.p.): € 496.550
3,26%
Yearly
€ 24.250
Direct available
Estimated mortgage
Indicative gross monthly cost
Based on annuity and 30 year term
Indicative net monthly cost
iDisclaimer: this mortgage calculation is a simplified indication based on general assumptions. No rights can be derived from the results shown. Calculated with 10-annual interest (zonder NHG), automatically determined based on the price limit € 470.000. Source: 10-jaars rente uit mortgage_rates (10-06-2026 03:45). For non-NHG, an 80% mortgage of the market value has been used in this indication.
Ligbad, toilet, en wastafelmeubel
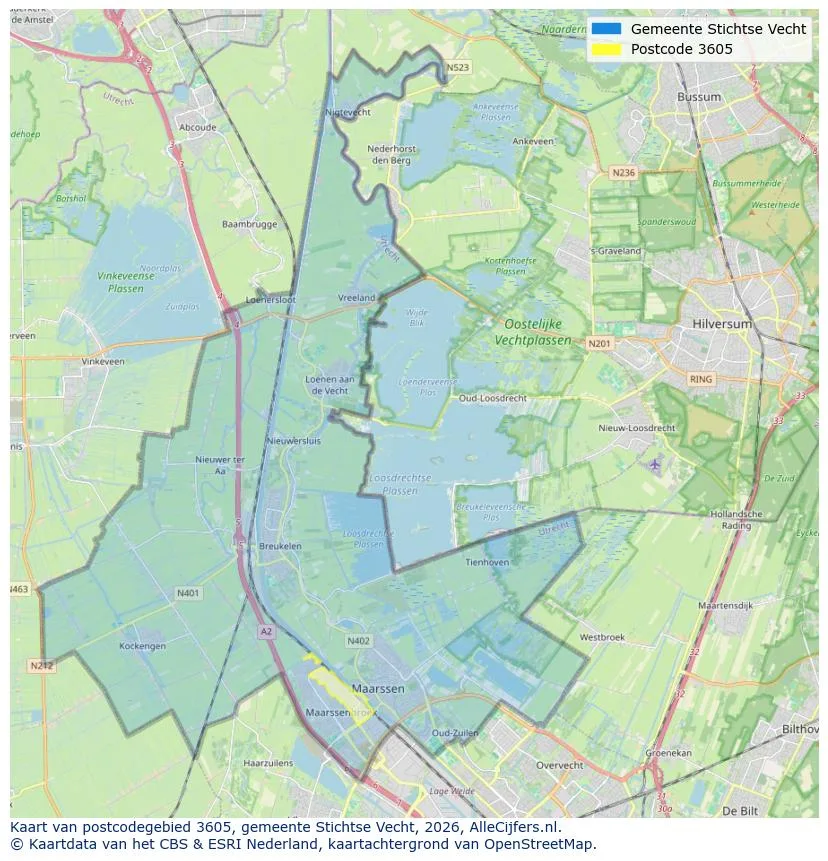
Spatial overview of the work area in Maarssen
View current location data on residents, WOZ development, housing stock, energy consumption, business activity and safety in Maarssen. In 2025 were there 39.695 residents. The average WOZ value in 2025 is EUR 462.891.
Residents
39.695
Last year: 2025
Average WOZ
EUR 462.891
Last year: 2025
Average income per person.
EUR 37.929
Source: AllNumbers
Crimes (current year)
1.294
Total registered
| Year | Residents |
|---|---|
| 2021 | 39.090 |
| 2022 | 39.055 |
| 2023 | 39.350 |
| 2024 | 39.565 |
| 2025 | 39.695 |
| Year | Average WOZ |
|---|---|
| 2021 | EUR 333.177 |
| 2022 | EUR 361.099 |
| 2023 | EUR 423.000 |
| 2024 | EUR 424.562 |
| 2025 | EUR 462.891 |
Hoger
10.660
Praktisch
7.190
Middelbaar
11.250
Europa
3.045
Nederland
29.245
Buiten Europa
7.410
Label C
7.472
Label A
4.020
Label B
2.763
Label D
1.534
Label E
487
Label G
480
Label F
474
Label A+
276
Label A+++
120
Label A++++
96
Label A++
91
Label A+++++
1
| Year | Gas (m3) | Electricity (kWh) |
|---|---|---|
| 2020 | 1.106 | 2.886 |
| 2021 | 1.249 | 2.938 |
| 2022 | 963 | 2.738 |
| 2023 | 844 | 2.562 |
| 2024 | 820 | 2.584 |
Hoekwoning
Gas: 1.031 • Electricity: 2.905
Huurwoning
Gas: 671 • Electricity: 1.922
Koopwoning
Gas: 923 • Electricity: 2.873
Appartement
Gas: 579 • Electricity: 1.738
Tussenwoning
Gas: 849 • Electricity: 2.698
Vrijstaande woning
Gas: 1.543 • Electricity: 4.190
Twee-onder-één-kap woning
Gas: 1.241 • Electricity: 3.017
Total number of company establishments: 4.975
| Period | Crimes |
|---|---|
| jan 2025 | 105 |
| jan 2026 | 87 |
| jul 2025 | 97 |
| jun 2025 | 123 |
| mei 2025 | 98 |
| mrt 2025 | 134 |
| nov 2024 | 119 |
| nov 2025 | 107 |
| okt 2024 | 81 |
| okt 2025 | 104 |
| sep 2024 | 117 |
| sep 2025 | 116 |
These figures give an indicative picture of safety trends in the living environment of Maarssen.
Short answers based on current local statistics, handy for a quick comparison of the living environment.
Maarssen telt in 2025 ongeveer 39.695 inwoners.
De gemiddelde WOZ-waarde in Maarssen is in 2025 circa € 462.891.
Het gemiddelde inkomen per inwoner in Maarssen ligt rond € 37.929 per jaar.
Voor het huidige jaar gaat het om ongeveer 1.294 geregistreerde misdrijven. Gebruik deze cijfers als indicatie en vergelijk trends per periode.
In Maarssen komt vooral "Tussenwoningen" veel voor, met ongeveer 8.266 woningen.
View more homes in this location.

3604DK Maarssen
€ 550.000 k.k.
€ 4.911/m²
3603AC Maarssen
€ 389.500 k.k.
€ 3.541/m²
3603AC Maarssen
€ 459.500 k.k.
€ 3.379/m²
3607BB Maarssen
€ 499.500 k.k.
€ 4.625/m²

3604DB Maarssen
€ 980.000 k.k.
€ 5.833/m²
3602PB Maarssen
€ 725.000 k.k.
€ 5.179/m²
3608BV Maarssen
€ 545.000 k.k.
€ 3.978/m²
3607HK Maarssen
€ 465.000 k.k.
€ 3.605/m²
