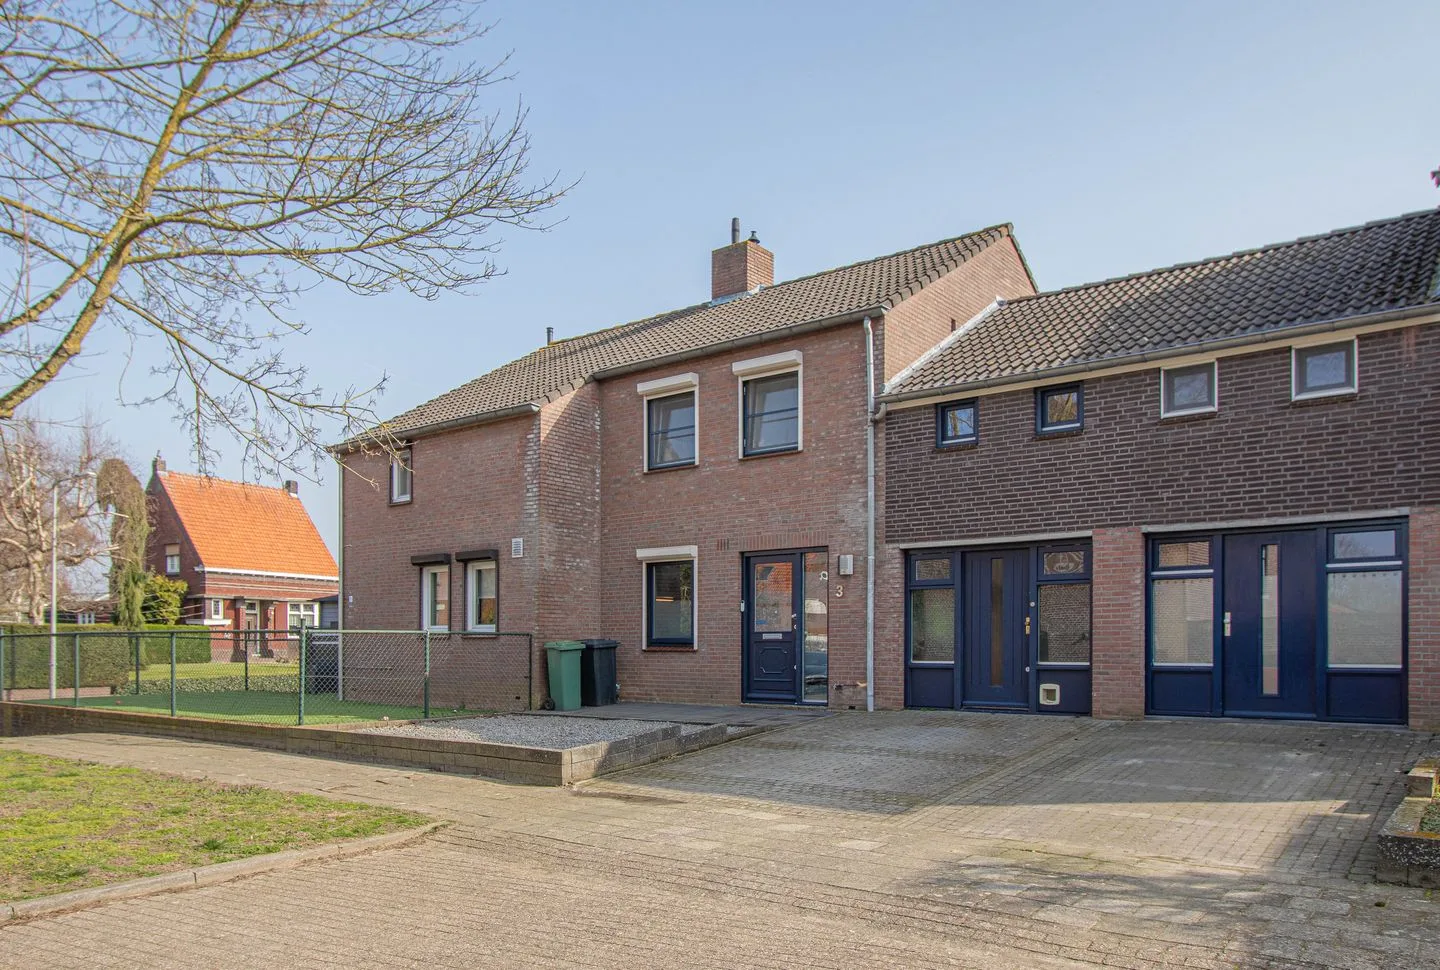
- Sold
Mussenkamp 3
6015BZ Neeritter
€ 319.500 k.k.
€ 2.640/m²
- Living area
- 121 m²
- Land area
- 200 m²
- Bedrooms
- 4
View 12 sold houses in Neeritter
Type to search. Use arrow down and arrow up to navigate through results and press Enter to open.
Hidden search suggestions.
Compare sold homes in Neeritter or view the current offering in this location directly.
On this page you will find recently sold homes in Neeritter. Use this overview to better estimate selling prices, popular neighborhoods, and the local housing supply before you choose a real estate agent. Also view the current housing supply with 15 houses in Neeritter.
6015BZ Neeritter
€ 319.500 k.k.
€ 2.640/m²
6015AP Neeritter
€ 369.000 k.k.
€ 2.617/m²
6015AL Neeritter
€ 379.500 k.k.
€ 2.513/m²
6015BA Neeritter
€ 310.000 k.k.
€ 3.604/m²
6015BD Neeritter
Price upon request
6015AV Neeritter
€ 350.000 k.k.
€ 3.211/m²
6015AK Neeritter
€ 425.000 k.k.
€ 3.373/m²
6015BA Neeritter
€ 329.000 k.k.
€ 2.836/m²
6015BR Neeritter
€ 375.000 k.k.
€ 0/m²
6015AA Neeritter
€ 295.000 k.k.
€ 3.041/m²
6015AK Neeritter
€ 480.000 k.k.
€ 2.388/m²
6015AH Neeritter
€ 435.000 k.k.
€ 3.346/m²
View recent sales and receive free quotes from local real estate agents. Compare more than 15 real estate agents in Neeritter.
Selling your own home in Neeritter? Compare real estate agents in Neeritter or view the best real estate agents in Neeritter as a reference for your choice.
Real estate agents make sharper offers when they know you're comparing — ask for quotes for sale or purchase.
Short answers about housing prices, sold homes and comparing real estate agents in Neeritter.
The costs of a real estate agent in Neeritter vary per office, property type and sales approach. In Neeritter you can compare 15 real estate agents; therefore also look at the real estate agents in Neeritter to better compare fees, presentation and local experience.
On this page we currently show 12 sold houses in Neeritter from our selection. This helps you to better assess recent transactions and the local housing market.
Houses sold in Neeritter give insight into asking prices, house types and neighborhoods where recent transactions have taken place. Compare this also with the current housing stock in Neeritter to better understand the market.
You can use sold homes as a first market indication, but a local real estate agent can better take into account finishing, location, maintenance and current demand in Neeritter.
Compare the 15 real estate agents in Neeritter on local sales experience, reviews, expected yield, commission and marketing approach. View real estate agents in Neeritter or the top 10 agents in Neeritter to quickly discover strong offices.
View current location data on residents, WOZ development, housing stock, energy consumption, business activity and safety in Neeritter. In 2026 were there 1.250 residents. The average WOZ value in 2025 is EUR 341.000.
These figures help to better assess and compare the housing stock in Neeritter with recent sold homes. Orient yourself then on suitable top real estate agents in Neeritter for sales advice in this region.
Residents
1.250
Last year: 2026
Average WOZ
EUR 341.000
Last year: 2025
Average income per person.
EUR 31.200
Source: AllNumbers
Crimes (current year)
14
Total registered
| Year | Residents |
|---|---|
| 2021 | 1.270 |
| 2022 | 1.260 |
| 2023 | 1.250 |
| 2024 | 1.250 |
| 2025 | 1.250 |
| 2026 | 1.250 |
| Year | Average WOZ |
|---|---|
| 2021 | EUR 249.000 |
| 2022 | EUR 264.000 |
| 2023 | EUR 314.000 |
| 2024 | EUR 316.000 |
| 2025 | EUR 341.000 |
Hoger
190
Praktisch
400
Middelbaar
400
Europa
190
Nederland
1.000
Buiten Europa
55
Label C
151
Label B
121
Label D
83
Label A
75
Label F
68
Label G
48
Label E
38
Label A++
2
Label A+
1
Label A+++
0
Label A++++
0
Label A+++++
0
| Year | Gas (m3) | Electricity (kWh) |
|---|---|---|
| 2020 | 1.450 | 3.300 |
| 2021 | 1.640 | 3.310 |
| 2022 | 1.300 | 3.130 |
| 2023 | 1.070 | 2.940 |
| 2024 | 1.040 | 3.080 |
Hoekwoning
Gas: 1.000 • Electricity: 2.800
Huurwoning
Gas: 900 • Electricity: 1.990
Koopwoning
Gas: 1.110 • Electricity: 3.200
Appartement
Gas: 830 • Electricity: 2.100
Tussenwoning
Gas: 910 • Electricity: 2.500
Vrijstaande woning
Gas: 1.340 • Electricity: 3.760
Twee-onder-één-kap woning
Gas: 950 • Electricity: 2.570
Total number of company establishments: 130
| Period | Crimes |
|---|---|
| jan 2026 | 0 |
| jul 2025 | 2 |
| jun 2025 | 2 |
| mei 2025 | 0 |
| mrt 2025 | 1 |
| mrt 2026 | 1 |
| nov 2024 | 1 |
| nov 2025 | 1 |
| okt 2024 | 2 |
| okt 2025 | 1 |
| sep 2024 | 3 |
| sep 2025 | 2 |
These figures give an indicative picture of safety trends in the living environment of Neeritter.
Short answers based on current local statistics, handy for a quick comparison of the living environment.
Neeritter telt in 2026 ongeveer 1.250 inwoners.
De gemiddelde WOZ-waarde in Neeritter is in 2025 circa € 341.000.
Het gemiddelde inkomen per inwoner in Neeritter ligt rond € 31.200 per jaar.
Voor het huidige jaar gaat het om ongeveer 14 geregistreerde misdrijven. Gebruik deze cijfers als indicatie en vergelijk trends per periode.
In Neeritter komt vooral "Vrijstaande woningen" veel voor, met ongeveer 203 woningen.