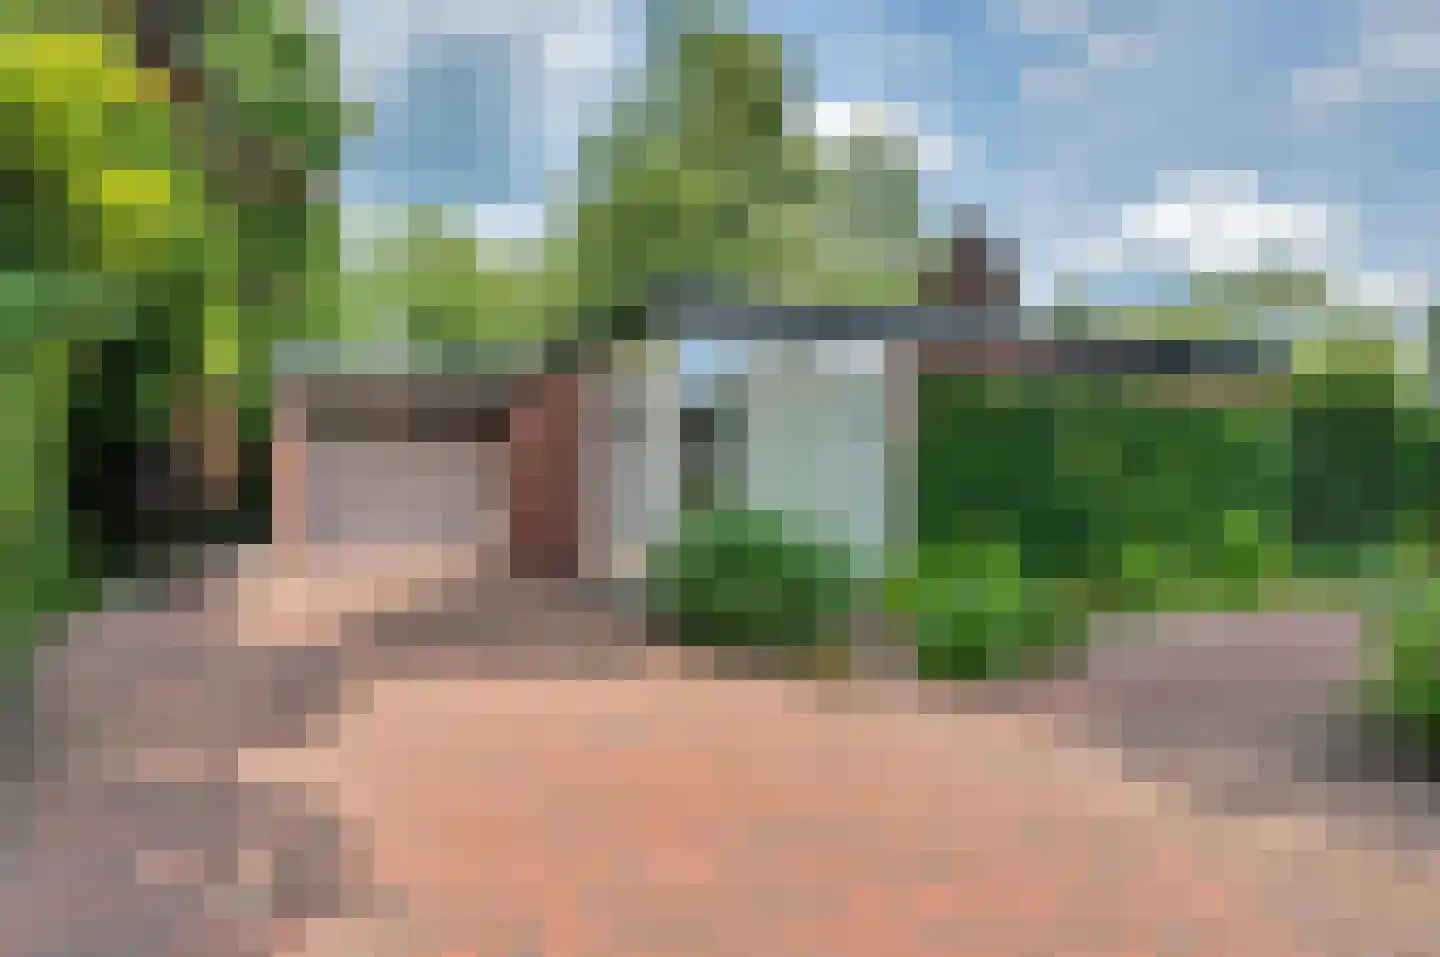
- Sold
Goudenregenlaan 21
9663EK Nieuwe Pekela
€ 217.500 k.k.
€ 2.589/m²
- Living area
- 84 m²
- Land area
- 260 m²
- Bedrooms
- 4
View 38 sold houses in Nieuwe Pekela
Type to search. Use arrow down and arrow up to navigate through results and press Enter to open.
Hidden search suggestions.
Compare sold homes in Nieuwe Pekela or view the current offering in this location directly.
On this page you will find recently sold homes in Nieuwe Pekela. Use this overview to better estimate selling prices, popular neighborhoods, and the local housing supply before you choose a real estate agent. Also view the current housing supply with 55 houses in Nieuwe Pekela.
9663EK Nieuwe Pekela
€ 217.500 k.k.
€ 2.589/m²
9663EC Nieuwe Pekela
€ 419.000 k.k.
€ 2.831/m²
9663RW Nieuwe Pekela
€ 245.000 k.k.
€ 2.130/m²
9663EE Nieuwe Pekela
€ 325.000 k.k.
€ 3.037/m²
9663ER Nieuwe Pekela
€ 219.000 k.k.
€ 2.638/m²
9663PE Nieuwe Pekela
€ 150.000 k.k.
€ 1.724/m²
9663CL Nieuwe Pekela
€ 210.000 k.k.
€ 1.826/m²
9663BE Nieuwe Pekela
€ 355.000 k.k.
€ 2.305/m²
9663RS Nieuwe Pekela
€ 499.500 k.k.
€ 2.744/m²
9663BT Nieuwe Pekela
€ 349.500 k.k.
€ 2.864/m²
9663TC Nieuwe Pekela
€ 309.000 k.k.
€ 3.029/m²
9663HD Nieuwe Pekela
€ 199.500 k.k.
€ 2.432/m²
9663TM Nieuwe Pekela
€ 329.500 k.k.
€ 2.745/m²
9663EK Nieuwe Pekela
€ 195.000 k.k.
€ 2.349/m²
9663PP Nieuwe Pekela
€ 275.000 k.k.
€ 1.646/m²
9663JN Nieuwe Pekela
€ 525.000 k.k.
€ 3.917/m²
9663PG Nieuwe Pekela
€ 250.000 k.k.
€ 3.246/m²
9663CP Nieuwe Pekela
€ 349.000 k.k.
€ 2.684/m²
9663CA Nieuwe Pekela
Price upon request
9663TL Nieuwe Pekela
€ 350.000 k.k.
€ 1.508/m²
9663SM Nieuwe Pekela
€ 400.000 k.k.
€ 1.265/m²
9663HC Nieuwe Pekela
€ 179.500 k.k.
€ 2.849/m²
9663BP Nieuwe Pekela
€ 450.000 k.k.
€ 3.147/m²
9663CN Nieuwe Pekela
€ 269.500 k.k.
€ 0/m²
9663TT Nieuwe Pekela
€ 850.000 k.k.
€ 0/m²
9663RT Nieuwe Pekela
€ 300.000 k.k.
€ 0/m²
9663GB Nieuwe Pekela
€ 259.000 k.k.
€ 3.278/m²
9663RL Nieuwe Pekela
€ 295.000 k.k.
€ 1.439/m²
Get free quotes from realtors with local market knowledge in Nieuwe Pekela.
Selling a home in Nieuwe Pekela? Compare real estate agents who know the local housing market. Also check out all real estate agents in Nieuwe Pekela or the top 10 real estate agents in Nieuwe Pekela for extra context for your choice.
By comparing brokers and requesting quotes
Short answers about housing prices, sold homes and comparing real estate agents in Nieuwe Pekela.
The costs of a real estate agent in Nieuwe Pekela vary per office, property type and sales approach. Therefore, compare multiple quotes and also look at the real estate agents in Nieuwe Pekela to better compare rates, presentation and local experience.
On this page we currently show 38 sold houses in Nieuwe Pekela from our selection. This helps you to better assess recent transactions and the local housing market.
Houses sold in Nieuwe Pekela give insight into asking prices, house types and neighborhoods where recent transactions have taken place. Compare this also with the current housing stock in Nieuwe Pekela to better understand the market.
You can use sold homes as a first market indication, but a local real estate agent can better take into account finishing, location, maintenance and current demand in Nieuwe Pekela.
Compare realtors in Nieuwe Pekela on local sales experience, reviews, expected yield, commission and marketing approach. The top 10 realtors in Nieuwe Pekela helps to quickly discover strong offices.
View current location data on residents, WOZ development, housing stock, energy consumption, business activity and safety in Nieuwe Pekela. In 2025 were there 4.690 residents. The average WOZ value in 2025 is EUR 229.000.
These figures help to better assess and compare the housing stock in Nieuwe Pekela with recent sold homes. Orient yourself then on suitable top real estate agents in Nieuwe Pekela for sales advice in this region.
Residents
4.690
Last year: 2025
Average WOZ
EUR 229.000
Last year: 2025
Average income per person.
EUR 27.900
Source: AllNumbers
Crimes (current year)
147
Total registered
| Year | Residents |
|---|---|
| 2021 | 4.560 |
| 2022 | 4.585 |
| 2023 | 4.565 |
| 2024 | 4.705 |
| 2025 | 4.690 |
| Year | Average WOZ |
|---|---|
| 2021 | EUR 161.000 |
| 2022 | EUR 182.000 |
| 2023 | EUR 210.000 |
| 2024 | EUR 214.000 |
| 2025 | EUR 229.000 |
Hoger
510
Praktisch
1.140
Middelbaar
1.820
Europa
320
Nederland
4.125
Buiten Europa
245
Label G
516
Label C
471
Label B
315
Label D
288
Label A
218
Label F
148
Label E
126
Label A++++
26
Label A+
22
Label A++
7
Label A+++
7
Label A+++++
0
| Year | Gas (m3) | Electricity (kWh) |
|---|---|---|
| 2020 | 1.640 | 3.000 |
| 2021 | 1.830 | 3.050 |
| 2022 | 1.410 | 2.910 |
| 2023 | 1.160 | 2.840 |
| 2024 | 1.100 | 2.960 |
Hoekwoning
Gas: 1.140 • Electricity: 2.280
Huurwoning
Gas: 1.010 • Electricity: 2.110
Koopwoning
Gas: 1.220 • Electricity: 3.140
Appartement
Gas: 740 • Electricity: 1.520
Tussenwoning
Gas: 1.020 • Electricity: 2.160
Vrijstaande woning
Gas: 1.330 • Electricity: 3.480
Twee-onder-één-kap woning
Gas: 1.060 • Electricity: 2.660
Total number of company establishments: 440
| Period | Crimes |
|---|---|
| jan 2025 | 8 |
| jan 2026 | 16 |
| jul 2025 | 22 |
| jun 2025 | 10 |
| mei 2025 | 11 |
| mrt 2025 | 7 |
| nov 2024 | 9 |
| nov 2025 | 9 |
| okt 2024 | 11 |
| okt 2025 | 17 |
| sep 2024 | 11 |
| sep 2025 | 13 |
These figures give an indicative picture of safety trends in the living environment of Nieuwe Pekela.
Short answers based on current local statistics, handy for a quick comparison of the living environment.
Nieuwe Pekela telt in 2025 ongeveer 4.690 inwoners.
De gemiddelde WOZ-waarde in Nieuwe Pekela is in 2025 circa € 229.000.
Het gemiddelde inkomen per inwoner in Nieuwe Pekela ligt rond € 27.900 per jaar.
Voor het huidige jaar gaat het om ongeveer 147 geregistreerde misdrijven. Gebruik deze cijfers als indicatie en vergelijk trends per periode.
In Nieuwe Pekela komt vooral "Vrijstaande woningen" veel voor, met ongeveer 1.071 woningen.