
Residents
490
Last year: 2025
€ 2.175.000 k.k.
Cost of copper (estimated): € 45.350
2% transfer tax (€ 43.500) + notary (€ 1.150) + valuation (€ 700)
Total incl. VAT: € 2.220.350
Purchase price /m²: € 13.854
Mijndensedijk 86 in Nieuwersluis is een volledig gerenoveerde, gelijkvloers bungalow met uitzicht op de Vecht. Gebouwd in 2023/2024 heeft het huis een energielabel A++ en luxe interieurstijl met hoogwaardige materialen zoals betonnen wastafels en Siemens keukenapparatuur. Met zijn 139 m² woonoppervlakte, inclusief twee aanlegsteigers aan de Vecht en een aangelegde tuin met gazon en borders, biedt het huis een rustig leven nabij historische locaties zoals Fort Nieuwersluis, Unesco Werelderfgoed. De directe omgeving heeft goede verbindingen met grote steden en is bekend om zijn natuurlijke schoonheid en recreatieactiviteiten langs de Vecht.
€ 2.175.000
Cost of copper (estimated): € 45.350
2% transfer tax (€ 43.500) + notary (€ 1.150) + valuation (€ 700)
Total purchase (incl. p.p.): € 2.220.350
3,04%
Yearly
€ 108.750
Direct available
Estimated mortgage
Indicative gross monthly cost
Based on annuity and 30 year term
Indicative net monthly cost
iDisclaimer: this mortgage calculation is a simplified indication based on general assumptions. No rights can be derived from the results shown. Calculated with 10-annual interest (zonder NHG), automatically determined based on the price limit € 470.000. Source: 10-jaars rente uit mortgage_rates (10-05-2026 03:45). For non-NHG, an 80% mortgage of the market value has been used in this indication.
Sauna, 2 inloopdouches, wastafelmeubel, en dubbele wastafel
View the location and discover the brokers in this region
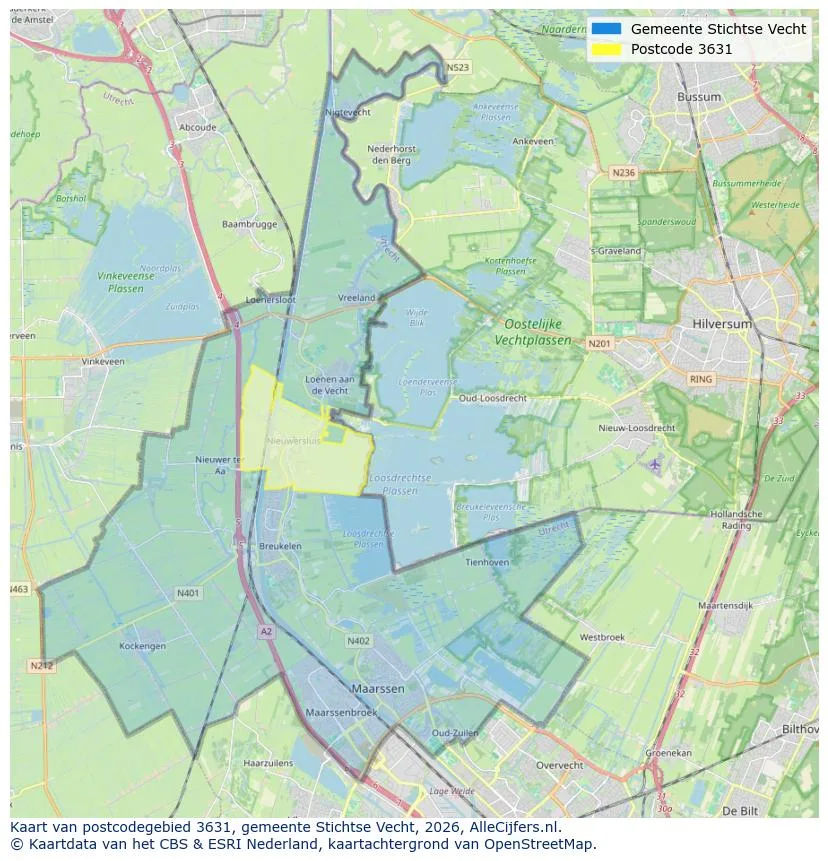
View current location data on residents, WOZ development, housing stock, energy consumption, business activity and safety in Nieuwersluis. In 2025 were there 490 residents. The average WOZ value in 2025 is EUR 979.000.
Residents
490
Last year: 2025
Average WOZ
EUR 979.000
Last year: 2025
Average income per person.
EUR 52.500
Source: AllNumbers
Crimes (current year)
35
Total registered
| Year | Residents |
|---|---|
| 2021 | 475 |
| 2022 | 475 |
| 2023 | 465 |
| 2024 | 500 |
| 2025 | 490 |
| Year | Average WOZ |
|---|---|
| 2021 | EUR 723.000 |
| 2022 | EUR 762.000 |
| 2023 | EUR 894.000 |
| 2024 | EUR 902.000 |
| 2025 | EUR 979.000 |
Hoger
160
Praktisch
90
Middelbaar
150
Europa
45
Nederland
380
Buiten Europa
65
Label G
83
Label A
27
Label F
20
Label C
15
Label B
10
Label D
10
Label E
8
Label A+
2
Label A++
2
Label A+++
1
Label A++++
0
Label A+++++
0
| Year | Gas (m3) | Electricity (kWh) |
|---|---|---|
| 2020 | 1.970 | 4.020 |
| 2021 | 2.290 | 4.260 |
| 2022 | 1.790 | 4.060 |
| 2023 | 1.570 | 4.070 |
| 2024 | 1.540 | 3.900 |
Hoekwoning
Gas: 1.210 • Electricity: 3.810
Huurwoning
Gas: 1.280 • Electricity: 2.850
Koopwoning
Gas: 1.660 • Electricity: 4.430
Appartement
Gas: 1.230 • Electricity: 3.210
Tussenwoning
Gas: 1.270 • Electricity: 3.310
Vrijstaande woning
Gas: 1.900 • Electricity: 4.560
Twee-onder-één-kap woning
Gas: 990 • Electricity: 3.430
Total number of company establishments: 170
| Period | Crimes |
|---|---|
| jan 2025 | 4 |
| jan 2026 | 2 |
| jul 2025 | 7 |
| jun 2025 | 2 |
| mei 2025 | 0 |
| mrt 2025 | 4 |
| nov 2024 | 2 |
| nov 2025 | 1 |
| okt 2024 | 0 |
| okt 2025 | 4 |
| sep 2024 | 1 |
| sep 2025 | 4 |
These figures give an indicative picture of safety trends in the living environment of Nieuwersluis.
Short answers based on current local statistics, handy for a quick comparison of the living environment.
Nieuwersluis telt in 2025 ongeveer 490 inwoners.
De gemiddelde WOZ-waarde in Nieuwersluis is in 2025 circa € 979.000.
Het gemiddelde inkomen per inwoner in Nieuwersluis ligt rond € 52.500 per jaar.
Voor het huidige jaar gaat het om ongeveer 35 geregistreerde misdrijven. Gebruik deze cijfers als indicatie en vergelijk trends per periode.
In Nieuwersluis komt vooral "Vrijstaande woningen" veel voor, met ongeveer 101 woningen.
View more homes in this location.

3631NK Nieuwersluis
€ 3.250.000 k.k.
€ 11.818/m²

3631NL Nieuwersluis
€ 3.445.000
€ 8.030/m²

3631AA Nieuwersluis
€ 585.000 k.k.
€ 4.756/m²

3631AC Nieuwersluis
€ 1.575.000 k.k.
€ 0/m²

3631AC Nieuwersluis
€ 1.550.000 k.k.
€ 9.748/m²
