- Available
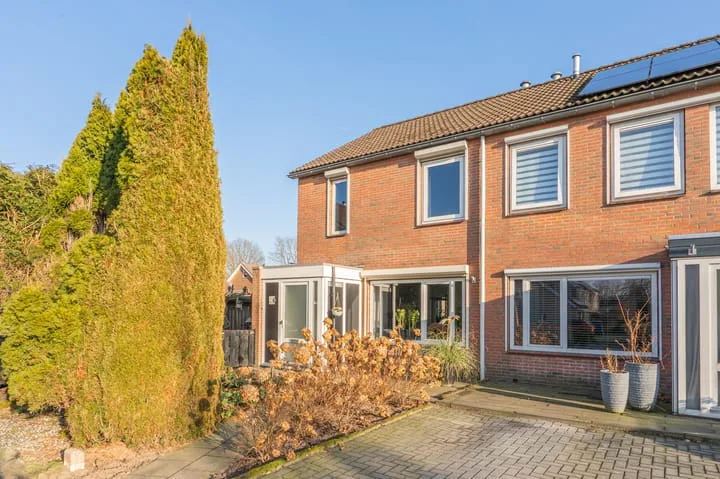
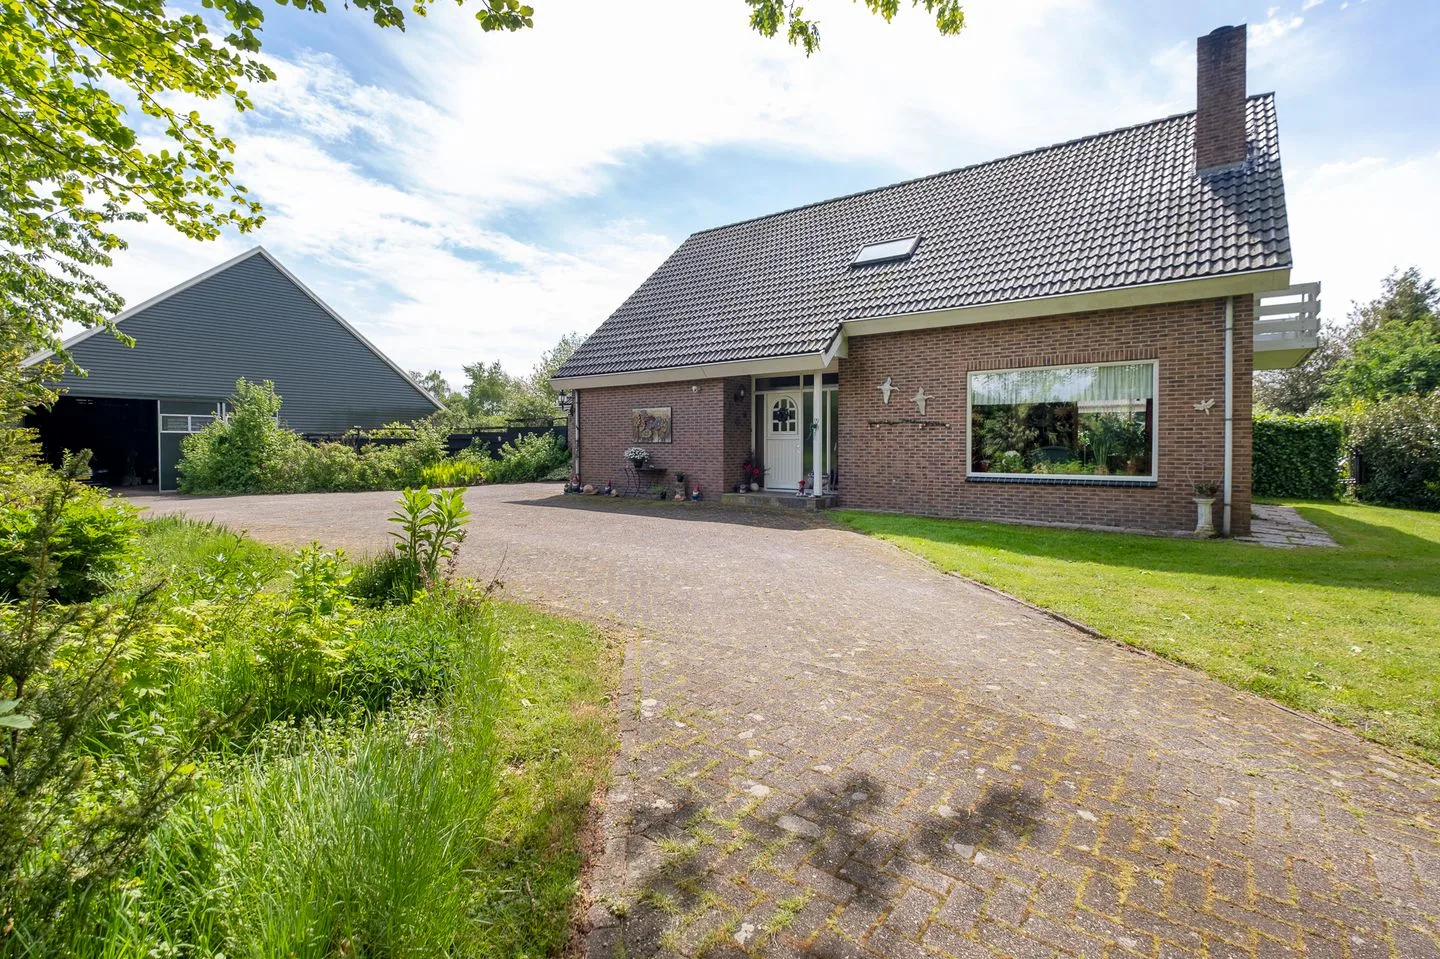
Joh Poststraat 19
7918AA Nieuwlande
€ 785.000 k.k.
€ 3.945/m²
B
Save as favorite
- Living area
- 199 m²
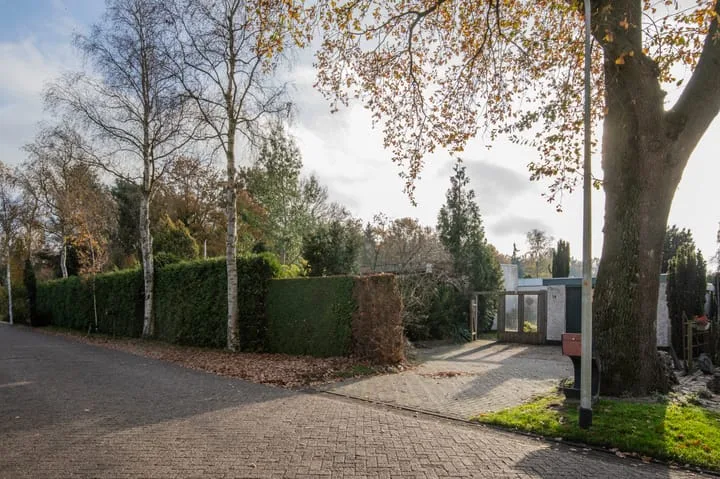
- Land area
- 6093 m²
- Bedrooms
- 4