Residents
1.428
Last year: 2026
7918TJ Nieuwlande • Drenthe
€ 645.000 k.k.
Cost of copper (estimated): € 14.750
2% transfer tax (€ 12.900) + notary (€ 1.150) + valuation (€ 700)
Total incl. VAT: € 659.750
Purchase price /m²: € 2.108
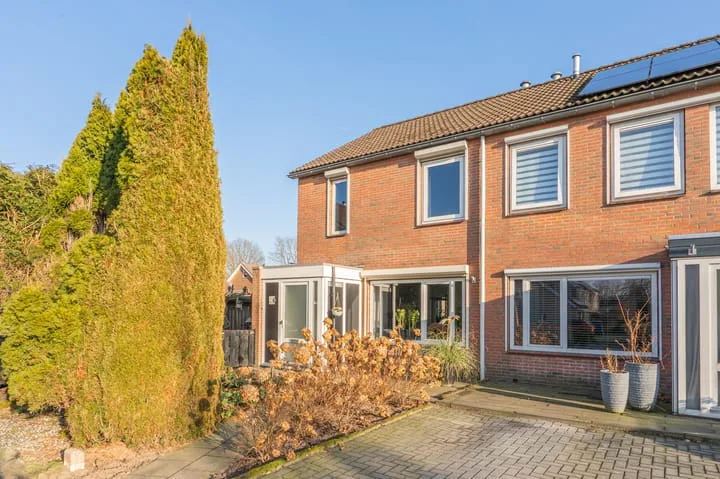
Meester van Goorweg 34 in Nieuwlande biedt een unieke combinatie van ruimte, comfort en multifunctionaliteit met 306 m² woonoppervlak. Het huis uit 2006 heeft kunststof kozijnen, warmtepompverwarming en vloerverwarming op begane grond en eerste verdieping, inclusief een inpandig te bereiken kantoor met ruimte voor een badkamer (57 m²). De indeling omvat hal/entree, royale woonkamer van 50 m², fraai uitgevoerde woonkeuken en op de eerste verdieping vier slaapkamers met badkamer. Bovendien is er ruimte voor extra kamers op de tweede verdieping. Het perceel van 537 m² heeft plaats voor 44 zonnepanelen, versterkend de energierevolutie en comfort in huis.
€ 645.000
Cost of copper (estimated): € 14.750
2% transfer tax (€ 12.900) + notary (€ 1.150) + valuation (€ 700)
Total purchase (incl. p.p.): € 659.750
3,04%
Yearly
€ 32.250
Direct available
Estimated mortgage
Indicative gross monthly cost
Based on annuity and 30 year term
Indicative net monthly cost
iDisclaimer: this mortgage calculation is a simplified indication based on general assumptions. No rights can be derived from the results shown. Calculated with 10-annual interest (zonder NHG), automatically determined based on the price limit € 470.000. Source: 10-jaars rente uit mortgage_rates (13-05-2026 03:45). For non-NHG, an 80% mortgage of the market value has been used in this indication.
Inloopdouche, ligbad, vloerverwarming, en wastafelmeubel
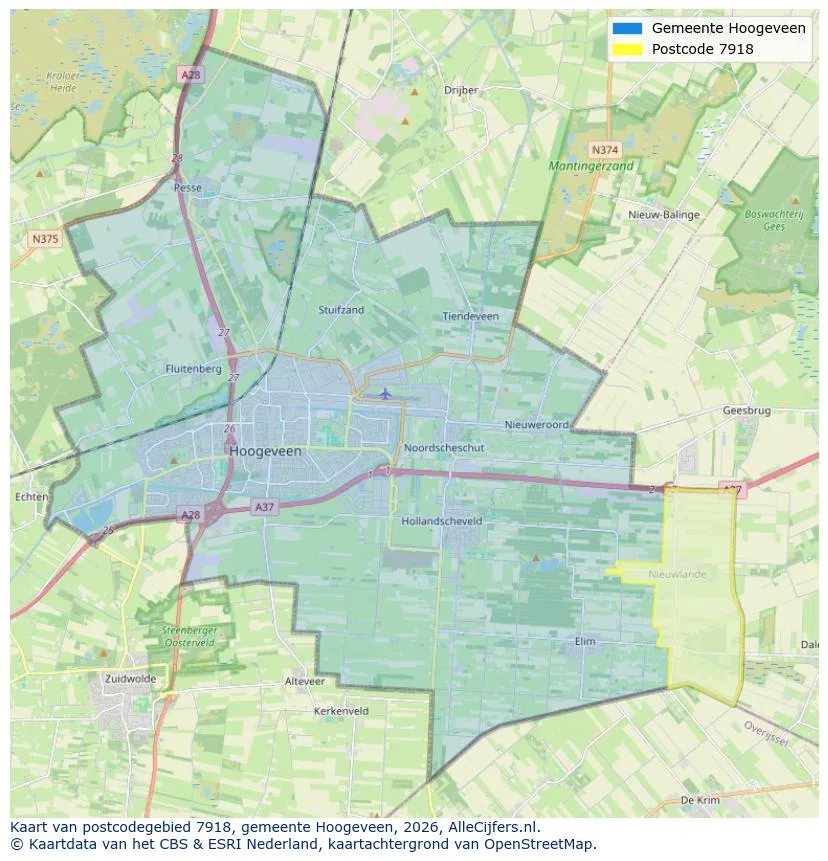
View the location and discover the brokers in this region
View current location data on residents, WOZ development, housing stock, energy consumption, business activity and safety in Nieuwlande. In 2026 were there 1.428 residents. The average WOZ value in 2025 is EUR 337.000.
Residents
1.428
Last year: 2026
Average WOZ
EUR 337.000
Last year: 2025
Average income per person.
EUR 27.800
Source: AllNumbers
Crimes (current year)
7
Total registered
| Year | Residents |
|---|---|
| 2021 | 1.370 |
| 2022 | 1.405 |
| 2023 | 1.420 |
| 2024 | 1.415 |
| 2025 | 1.425 |
| 2026 | 1.428 |
| Year | Average WOZ |
|---|---|
| 2021 | EUR 237.000 |
| 2022 | EUR 259.000 |
| 2023 | EUR 300.000 |
| 2024 | EUR 320.000 |
| 2025 | EUR 337.000 |
Hoger
230
Praktisch
290
Middelbaar
540
Europa
40
Nederland
1.345
Buiten Europa
40
Label C
128
Label A
125
Label G
73
Label B
65
Label F
64
Label D
48
Label A+++
18
Label E
12
Label A++++
4
Label A+
3
Label A++
1
Label A+++++
0
| Year | Gas (m3) | Electricity (kWh) |
|---|---|---|
| 2020 | 1.640 | 3.350 |
| 2021 | 1.830 | 3.480 |
| 2022 | 1.400 | 3.360 |
| 2023 | 1.120 | 3.210 |
| 2024 | 1.090 | 3.360 |
Hoekwoning
Gas: 920 • Electricity: 2.620
Huurwoning
Gas: 950 • Electricity: 2.100
Koopwoning
Gas: 1.150 • Electricity: 3.420
Appartement
Gas: 1.000 • Electricity: 2.070
Tussenwoning
Gas: 900 • Electricity: 2.300
Vrijstaande woning
Gas: 1.250 • Electricity: 3.870
Twee-onder-één-kap woning
Gas: 1.060 • Electricity: 2.730
Total number of company establishments: 150
| Period | Crimes |
|---|---|
| jan 2026 | 0 |
| jul 2025 | 0 |
| jun 2025 | 2 |
| mei 2025 | 0 |
| mrt 2025 | 1 |
| mrt 2026 | 2 |
| nov 2024 | 2 |
| nov 2025 | 0 |
| okt 2024 | 1 |
| okt 2025 | 1 |
| sep 2024 | 1 |
| sep 2025 | 1 |
These figures give an indicative picture of safety trends in the living environment of Nieuwlande.
Short answers based on current local statistics, handy for a quick comparison of the living environment.
Nieuwlande telt in 2026 ongeveer 1.428 inwoners.
De gemiddelde WOZ-waarde in Nieuwlande is in 2025 circa € 337.000.
Het gemiddelde inkomen per inwoner in Nieuwlande ligt rond € 27.800 per jaar.
Voor het huidige jaar gaat het om ongeveer 7 geregistreerde misdrijven. Gebruik deze cijfers als indicatie en vergelijk trends per periode.
In Nieuwlande komt vooral "Vrijstaande woningen" veel voor, met ongeveer 299 woningen.
View more homes in this location.

7918TN Nieuwlande
€ 465.000 k.k.

7918AJ Nieuwlande
€ 349.500 k.k.
€ 3.266/m²
7918AT Nieuwlande
€ 329.500 k.k.
€ 2.968/m²

7918AK Nieuwlande
€ 375.000 k.k.
€ 2.551/m²
7918TB Nieuwlande
€ 300.000 k.k.
€ 1.863/m²

7918TH Nieuwlande
€ 674.500 k.k.
€ 3.181/m²

7918TM Nieuwlande
€ 535.000 k.k.
€ 3.128/m²

7918TR Nieuwlande
€ 450.000 k.k.
€ 4.054/m²
