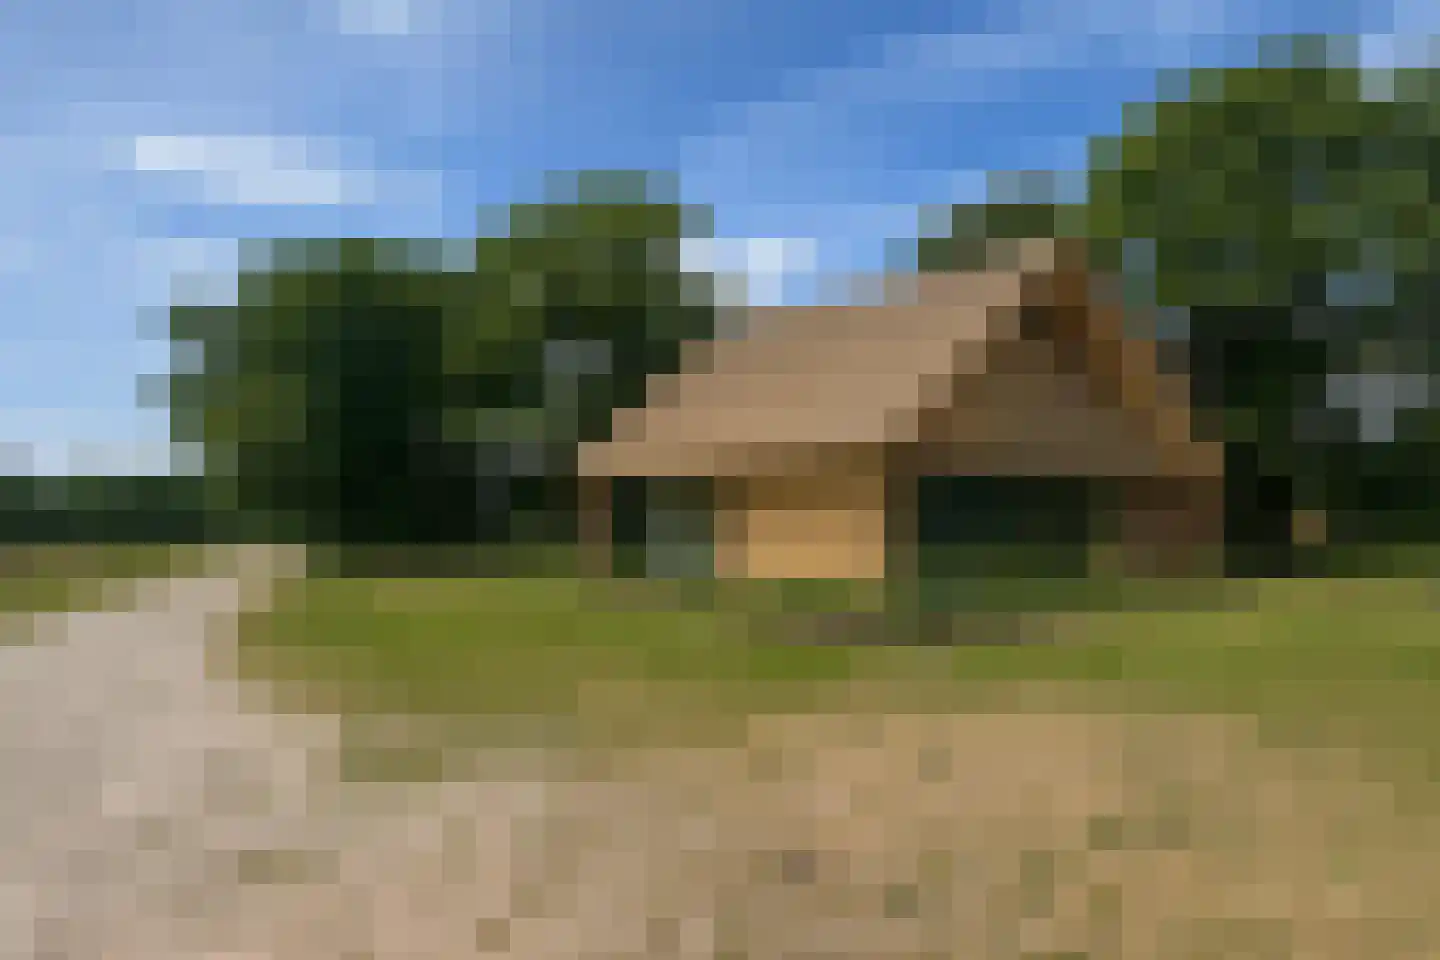
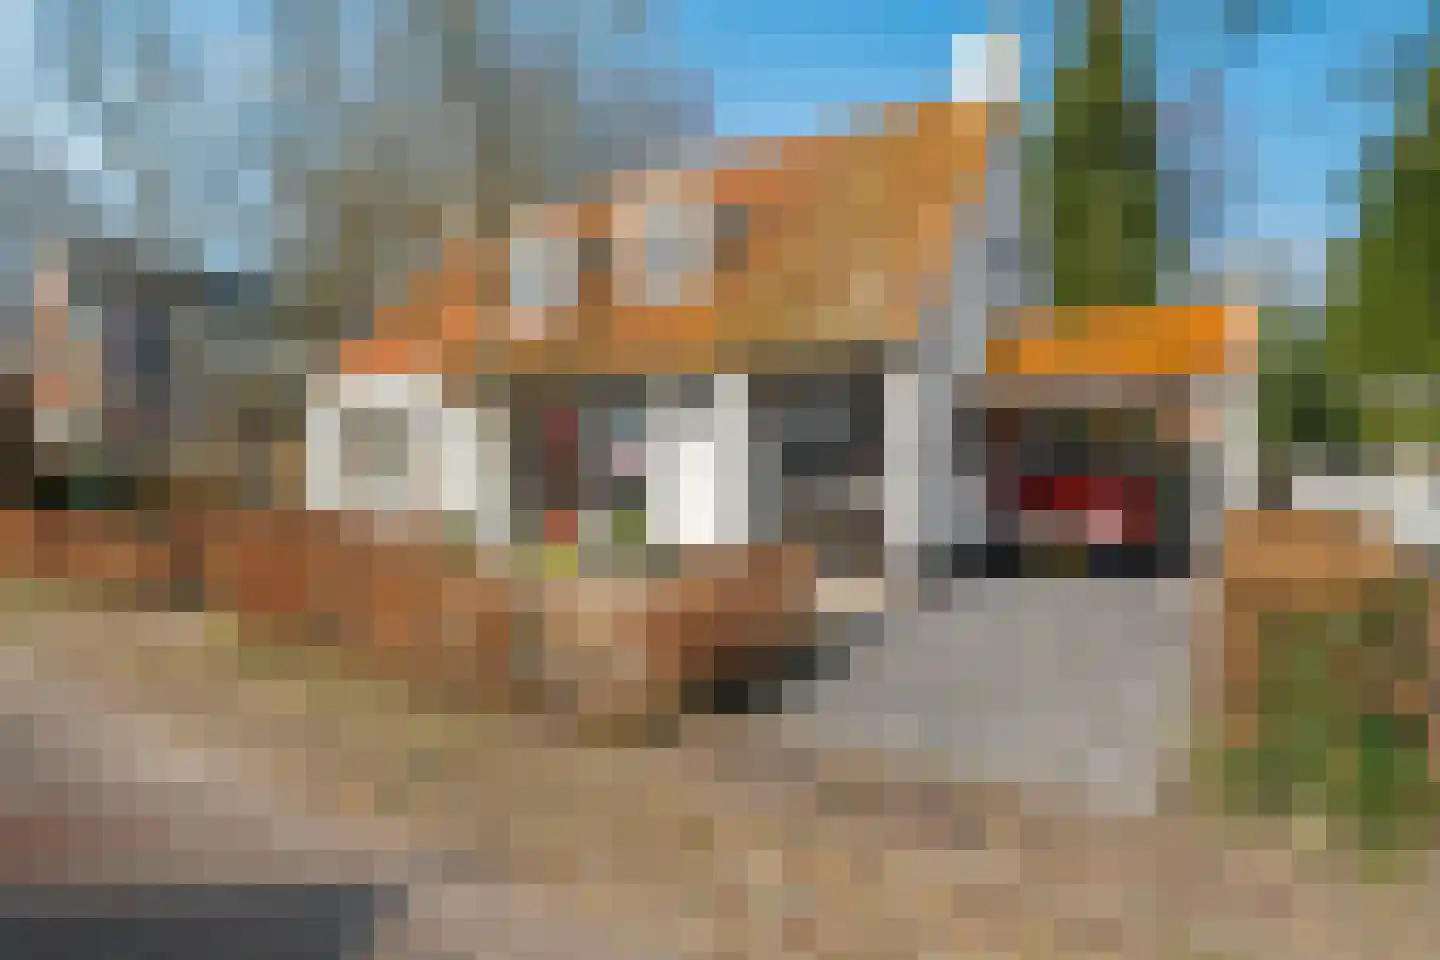
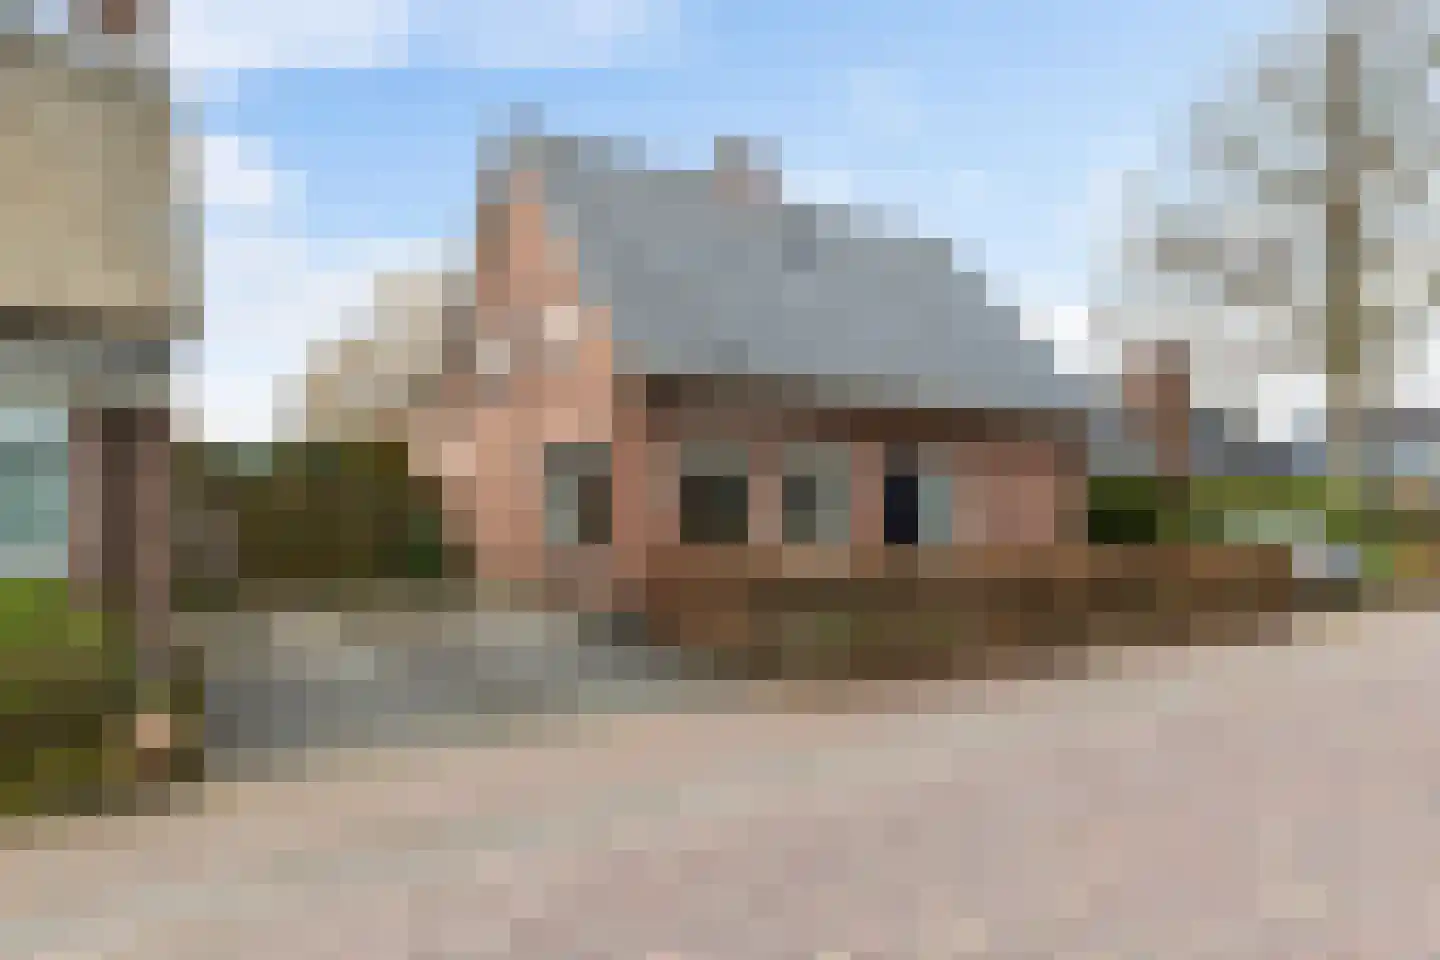
- Available
Lageweg 49
9479PB Noordlaren
€ 795.000 k.k.
€ 4.517/m²
- Living area
- 176 m²
- Land area
- 500 m²
- Bedrooms
- 5
Searching in 6 houses in Noordlaren
Type to search. Use arrow down and arrow up to navigate through results and press Enter to open.
Hidden search suggestions.
View current properties in Noordlaren or search targeted on street, postal code and property characteristics.
View the current housing stock in Noordlaren and quickly filter by price, living area, rooms and more. There are currently 6 houses in this place within our selection.
9479PB Noordlaren
€ 795.000 k.k.
€ 4.517/m²
9479TH Noordlaren
€ 989.000 k.k.
€ 2.900/m²
9479PK Noordlaren
€ 595.000 k.k.
€ 2.729/m²
9479PS Noordlaren
€ 489.000 k.k.
€ 4.144/m²
9479PH Noordlaren
€ 550.000 k.k.
€ 5.670/m²
9479PB Noordlaren
€ 495.000 k.k.
€ 4.419/m²
Get free quotes from real estate agents with local market knowledge. Compare more than 39 real estate agents in Noordlaren.
Selling a home in Noordlaren? Compare all real estate agents in Noordlaren or view the top 10 real estate agents in Noordlaren for extra context for your choice.
Real estate agents make sharper offers when they know you're comparing — ask for quotes for sale or purchase.
Practical answers about housing supply, sales and comparing real estate agents in Noordlaren.
The costs of a real estate agent in Noordlaren depend on commission, setup costs, property presentation and the chosen service. Compare the 39 real estate agents in Noordlaren via the real estate agent page and request multiple quotes to compare rates and approach well.
Within our selection, we are currently showing 6 houses in Noordlaren. View also the sold houses in Noordlaren to compare the current offering with recent transactions.
Take into account not only price and living area but also maintenance, energy label, location, outdoor space and sales status. This way you compare houses in Noordlaren on more than just the asking price.
A local real estate agent knows the neighborhoods, recent transactions and demand in Noordlaren. By comparing 39 real estate agents in the region you get a better insight into prices, sales strategy and expected yield; the top 10 in Noordlaren provides a useful starting point.
Yes, when making a sales plan, a valuation in Noordlaren is wise. You gain insight into a realistic asking price and can then compare offers from real estate agents specifically.
View current location data on residents, WOZ development, housing stock, energy consumption, business activity and safety in Noordlaren. In 2025 were there 525 residents. The average WOZ value in 2025 is EUR 612.426.
These figures help to better assess and compare the housing stock in Noordlaren with recent sold homes. Orient yourself then on suitable top real estate agents in Noordlaren for sales advice in this region.
Residents
525
Last year: 2025
Average WOZ
EUR 612.426
Last year: 2025
Average income per person.
EUR 39.490
Source: AllNumbers
Crimes (current year)
8
Total registered
| Year | Residents |
|---|---|
| 2021 | 555 |
| 2022 | 550 |
| 2023 | 545 |
| 2024 | 545 |
| 2025 | 525 |
| Year | Average WOZ |
|---|---|
| 2021 | EUR 432.458 |
| 2022 | EUR 476.211 |
| 2023 | EUR 539.135 |
| 2024 | EUR 591.528 |
| 2025 | EUR 612.426 |
Hoger
140
Praktisch
30
Middelbaar
100
Europa
25
Nederland
475
Buiten Europa
30
Label G
86
Label C
35
Label B
29
Label D
29
Label A
21
Label F
16
Label E
12
Label A+++
2
Label A+
1
Label A++
1
Label A++++
0
Label A+++++
0
| Year | Gas (m3) | Electricity (kWh) |
|---|---|---|
| 2020 | 1.967 | 3.330 |
| 2021 | 2.288 | 3.520 |
| 2022 | 1.748 | 3.330 |
| 2023 | 1.414 | 2.998 |
| 2024 | 1.330 | 3.096 |
Hoekwoning
Gas: 805 • Electricity: 1.510
Huurwoning
Gas: 1.130 • Electricity: 1.925
Koopwoning
Gas: 1.449 • Electricity: 3.119
Appartement
Gas: 1.266 • Electricity: 3.784
Tussenwoning
Gas: 559 • Electricity: 1.284
Vrijstaande woning
Gas: 1.576 • Electricity: 3.258
Twee-onder-één-kap woning
Gas: 719 • Electricity: 1.650
Total number of company establishments: 130
| Period | Crimes |
|---|---|
| jan 2025 | 0 |
| jan 2026 | 0 |
| jul 2025 | 0 |
| jun 2025 | 0 |
| mei 2025 | 1 |
| mrt 2025 | 1 |
| nov 2024 | 0 |
| nov 2025 | 0 |
| okt 2024 | 0 |
| okt 2025 | 1 |
| sep 2024 | 2 |
| sep 2025 | 2 |
These figures give an indicative picture of safety trends in the living environment of Noordlaren.
Short answers based on current local statistics, handy for a quick comparison of the living environment.
Noordlaren telt in 2025 ongeveer 525 inwoners.
De gemiddelde WOZ-waarde in Noordlaren is in 2025 circa € 612.426.
Het gemiddelde inkomen per inwoner in Noordlaren ligt rond € 39.490 per jaar.
Voor het huidige jaar gaat het om ongeveer 8 geregistreerde misdrijven. Gebruik deze cijfers als indicatie en vergelijk trends per periode.
In Noordlaren komt vooral "Vrijstaande woningen" veel voor, met ongeveer 159 woningen.