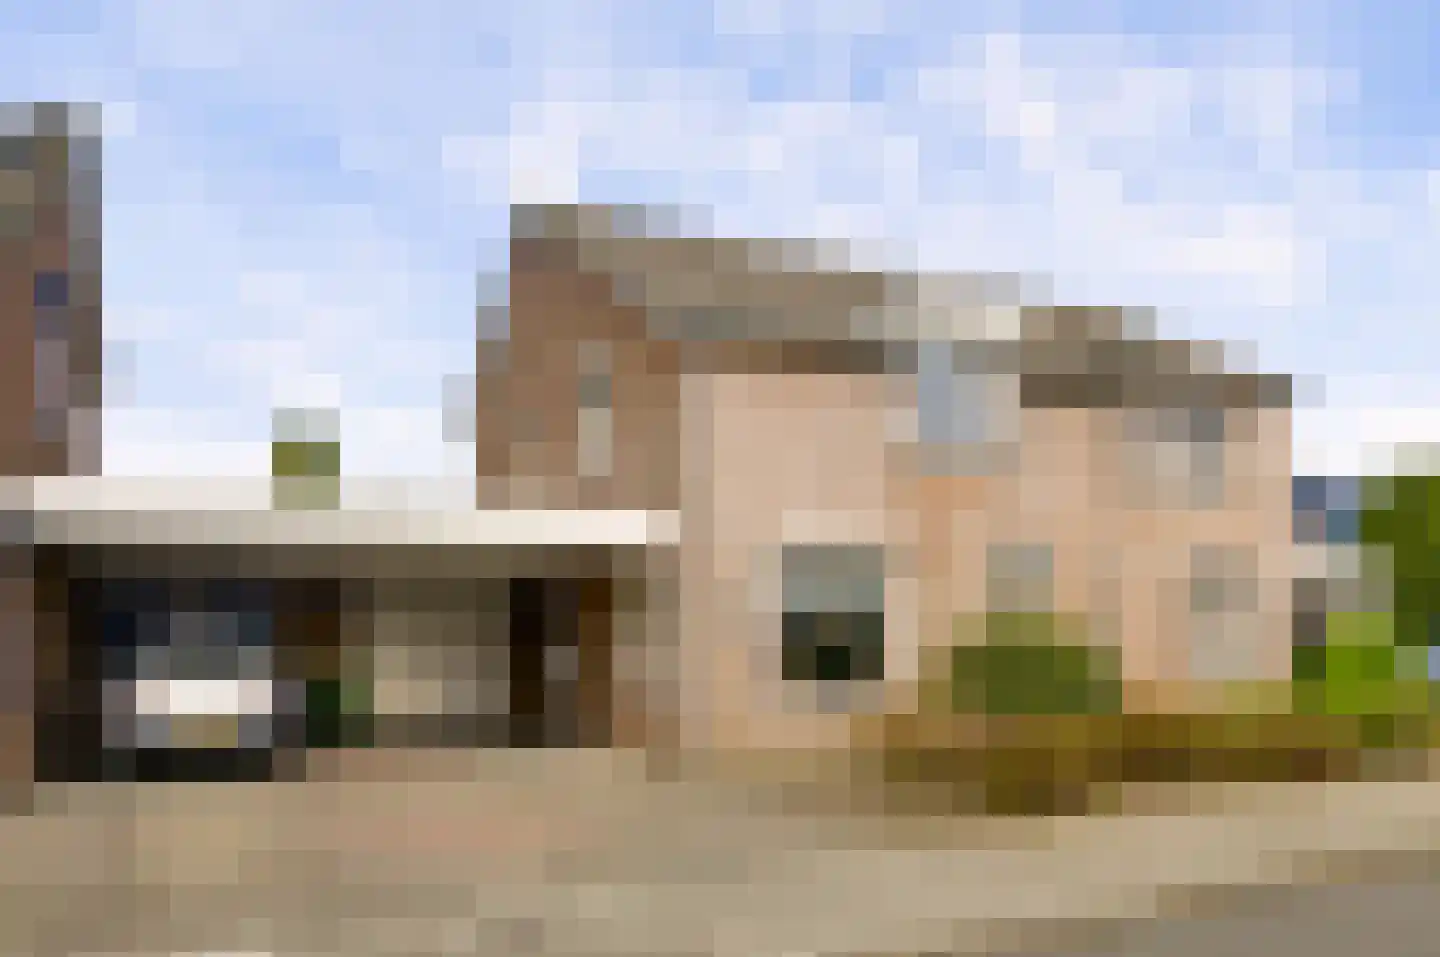
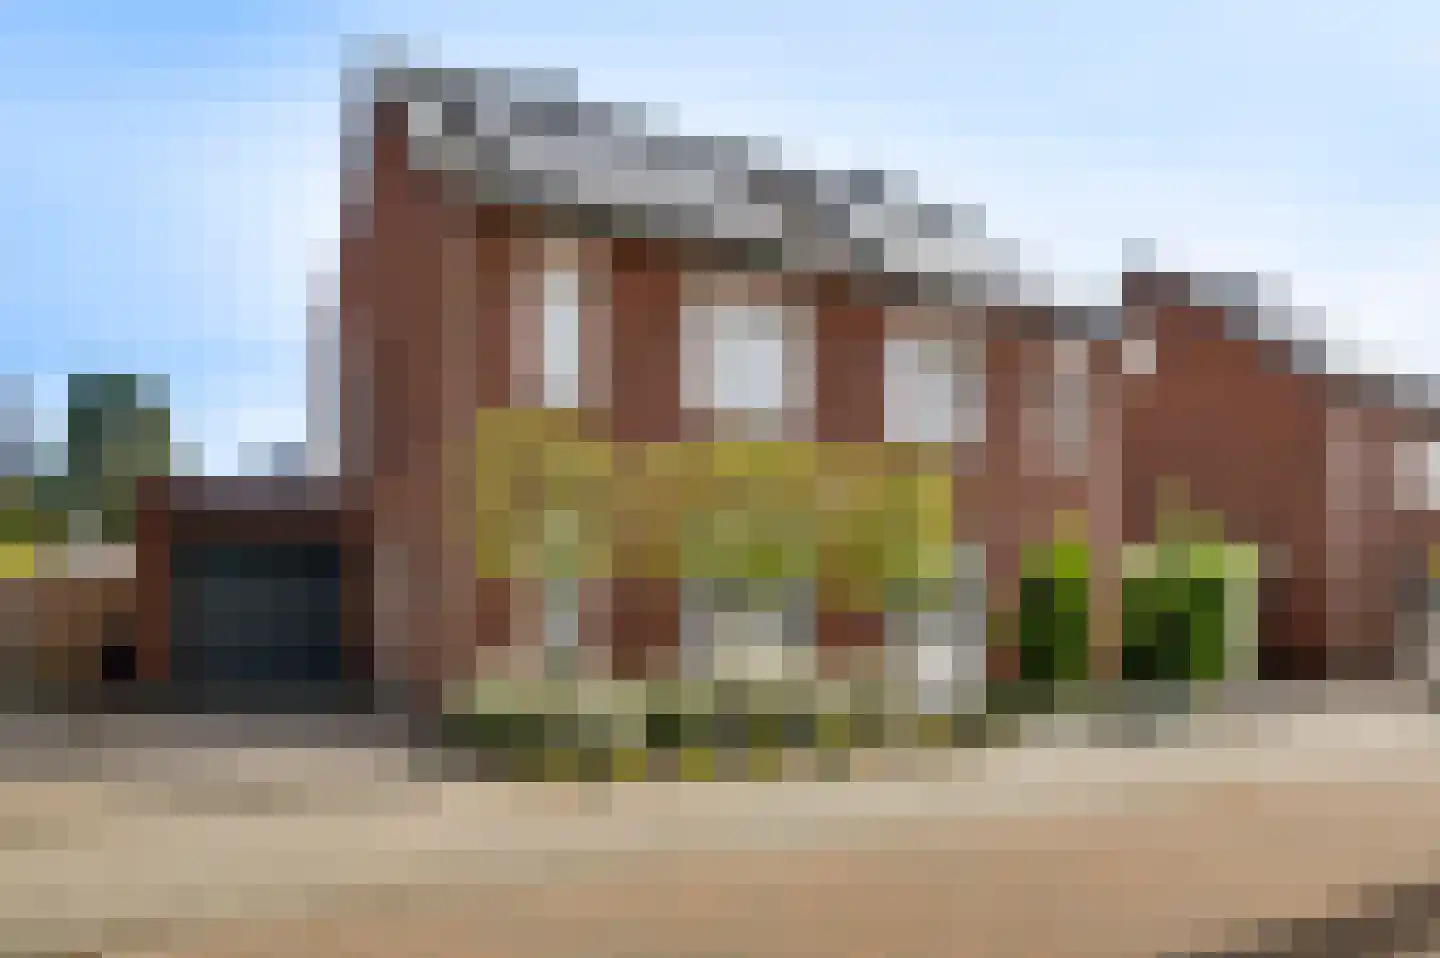
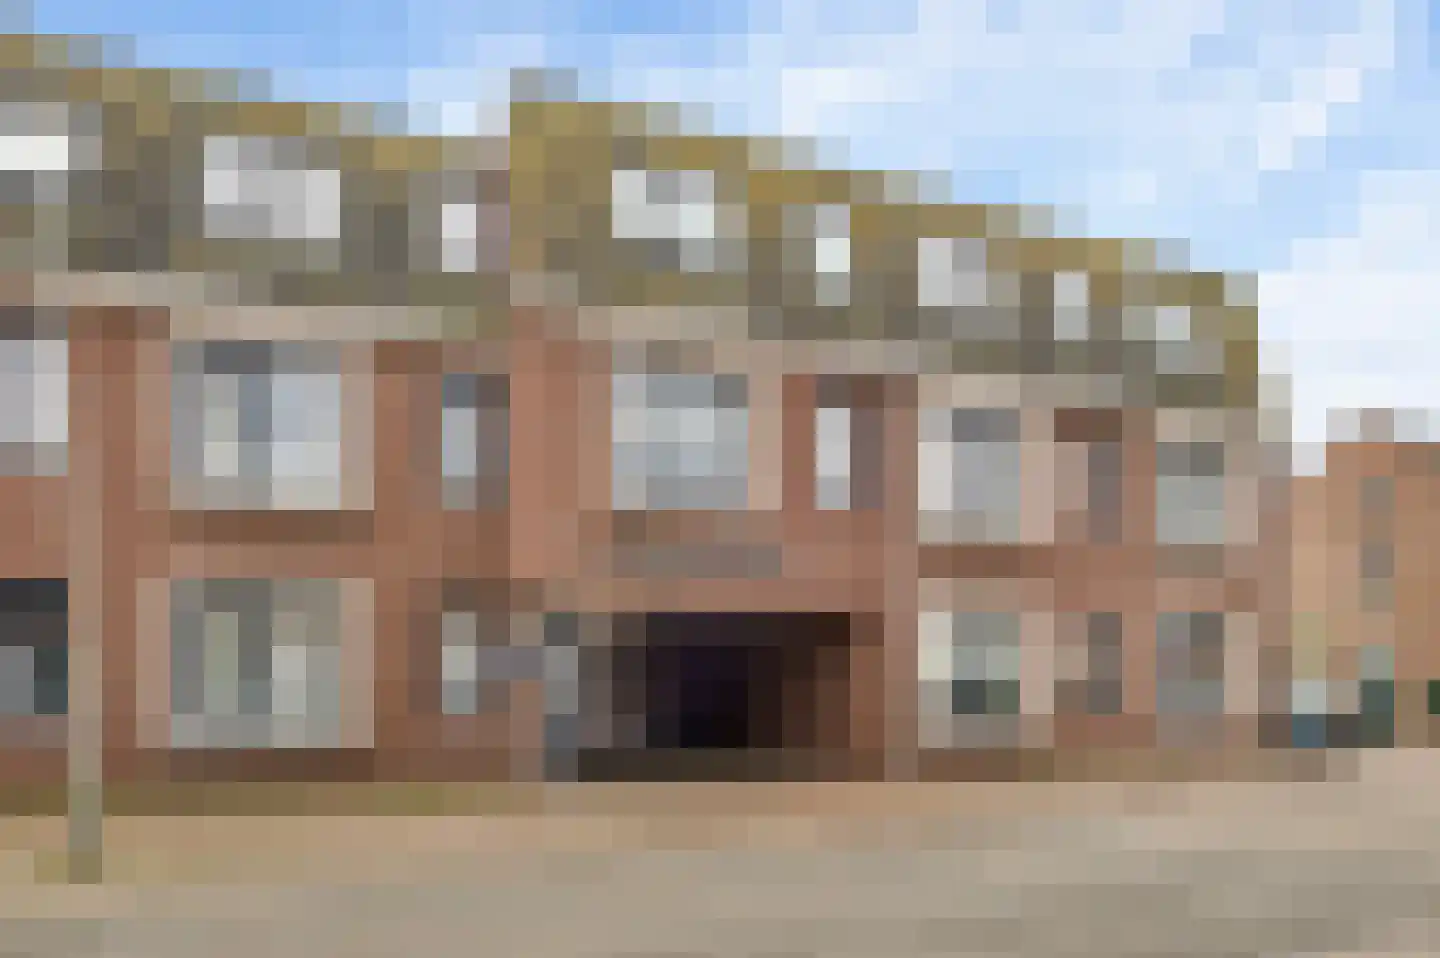
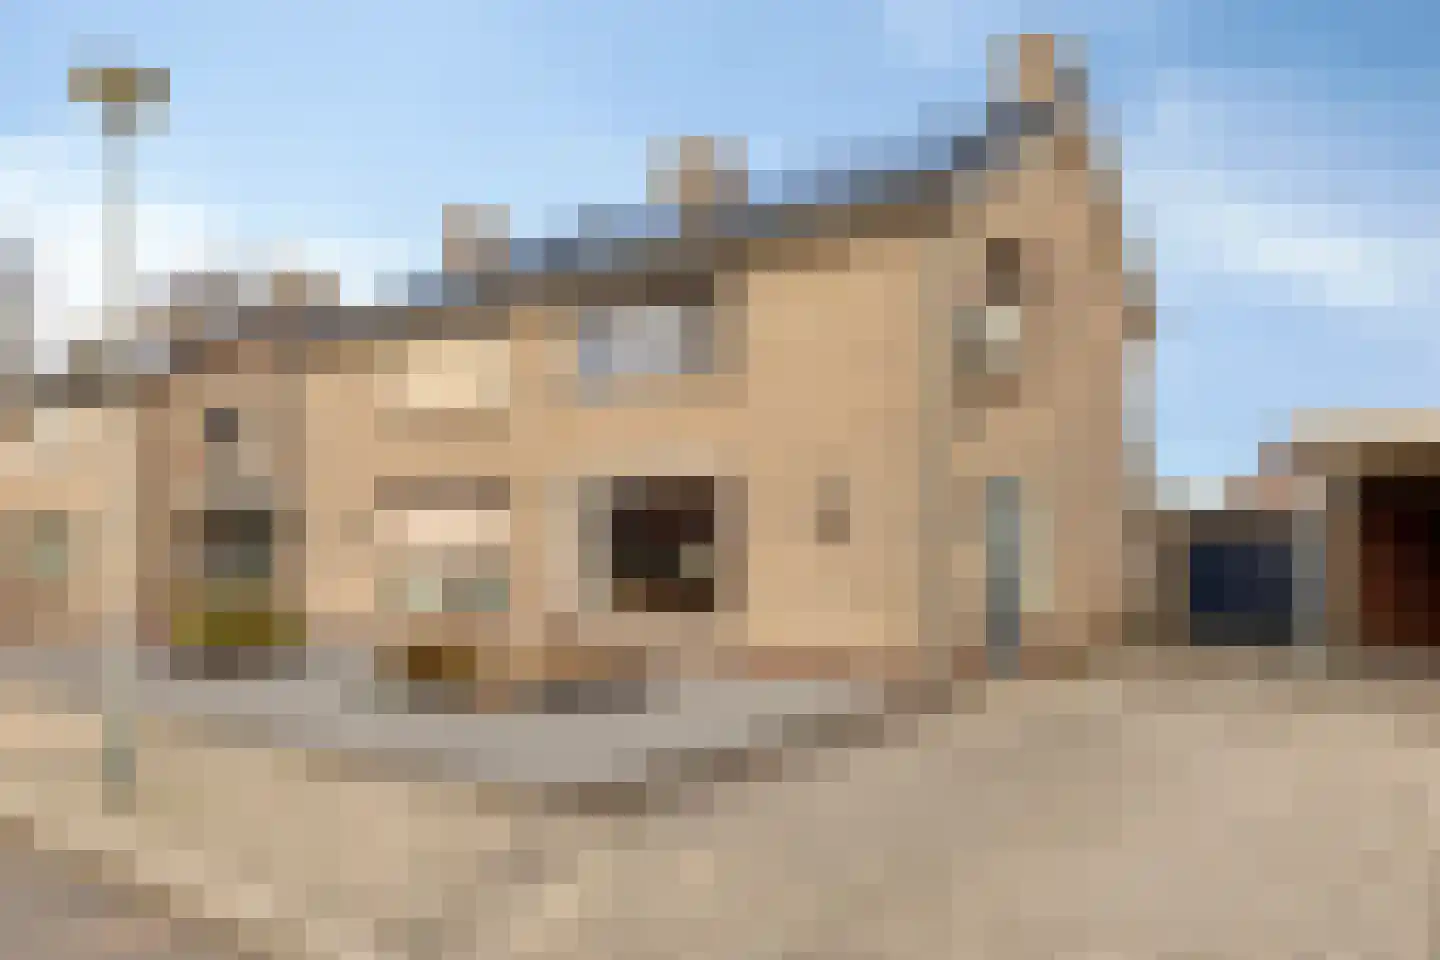
- Available
Lemmenhoek 27
6035AJ Ospel
€ 550.000 k.k.
€ 2.850/m²
- Living area
- 193 m²
- Land area
- 625 m²
- Bedrooms
- 5
Searching in 39 houses in Ospel
Type to search. Use arrow down and arrow up to navigate through results and press Enter to open.
Hidden search suggestions.
View current properties in Ospel or search targeted on street, postal code and property characteristics.
View the current housing stock in Ospel and quickly filter by price, living area, rooms and more. There are currently 39 houses in this place within our selection. View also 31 sold houses in Ospel for extra insight into the local housing market.
6035AJ Ospel
€ 550.000 k.k.
€ 2.850/m²
6035AN Ospel
€ 875.000 k.k.
6035AE Ospel
€ 335.000 k.k.
6035BR Ospel
€ 480.000 k.k.
€ 3.810/m²
6035AV Ospel
€ 695.000 k.k.
€ 2.983/m²
6035AN Ospel
€ 990.000 k.k.
€ 1.857/m²
6035CR Ospel
€ 450.000 k.k.
€ 3.947/m²
6035BM Ospel
€ 375.000 k.k.
€ 3.472/m²
6035AZ Ospel
€ 470.000 k.k.
€ 3.700/m²
6035AR Ospel
€ 198.000 k.k.
€ 4.950/m²
6035CZ Ospel
€ 875.000 k.k.
€ 4.248/m²
6035AL Ospel
€ 350.000 k.k.
€ 4.487/m²
6035AR Ospel
€ 495.000 k.k.
€ 4.194/m²
6035AS Ospel
€ 310.000 k.k.
€ 2.627/m²
6035SH Ospel
€ 770.000 k.k.
€ 3.276/m²
6035BE Ospel
€ 449.500 k.k.
€ 3.484/m²
6035RP Ospel
€ 529.000 k.k.
€ 3.648/m²
6035AJ Ospel
€ 439.000 k.k.
€ 2.726/m²
6035BP Ospel
€ 387.000 k.k.
€ 2.403/m²
6035PT Ospel
€ 785.000 k.k.
€ 4.511/m²
6035AR Ospel
€ 219.000 k.k.
€ 4.659/m²
6035RJ Ospel
€ 415.000 k.k.
€ 2.712/m²
6035CJ Ospel
€ 425.000 k.k.
€ 3.014/m²
6035AK Ospel
€ 365.000 k.k.
€ 3.230/m²
6035RJ Ospel
€ 865.000 k.k.
€ 3.530/m²
6035BN Ospel
€ 550.000 k.k.
€ 3.374/m²
6035RJ Ospel
€ 777.000 k.k.
€ 2.347/m²
6035PP Ospel
€ 895.000 k.k.
€ 5.000/m²
Get free quotes from real estate agents with local market knowledge. Compare more than 22 real estate agents in Ospel.
Selling a home in Ospel? Compare all real estate agents in Ospel or view the top 10 real estate agents in Ospel for extra context for your choice.
Real estate agents make sharper offers when they know you're comparing — ask for quotes for sale or purchase.
Practical answers about housing supply, sales and comparing real estate agents in Ospel.
The costs of a real estate agent in Ospel depend on commission, setup costs, property presentation and the chosen service. Compare the 22 real estate agents in Ospel via the real estate agent page and request multiple quotes to compare rates and approach well.
Within our selection, we are currently showing 39 houses in Ospel. View also the sold houses in Ospel to compare the current offering with recent transactions.
Take into account not only price and living area but also maintenance, energy label, location, outdoor space and sales status. This way you compare houses in Ospel on more than just the asking price.
A local real estate agent knows the neighborhoods, recent transactions and demand in Ospel. By comparing 22 real estate agents in the region you get a better insight into prices, sales strategy and expected yield; the top 10 in Ospel provides a useful starting point.
Yes, when making a sales plan, a valuation in Ospel is wise. You gain insight into a realistic asking price and can then compare offers from real estate agents specifically.
View current location data on residents, WOZ development, housing stock, energy consumption, business activity and safety in Ospel. In 2026 were there 4.278 residents. The average WOZ value in 2025 is EUR 422.000.
These figures help to better assess and compare the housing stock in Ospel with recent sold homes. Orient yourself then on suitable top real estate agents in Ospel for sales advice in this region.
Residents
4.278
Last year: 2026
Average WOZ
EUR 422.000
Last year: 2025
Average income per person.
EUR 34.300
Source: AllNumbers
Crimes (current year)
61
Total registered
| Year | Residents |
|---|---|
| 2021 | 4.135 |
| 2022 | 4.145 |
| 2023 | 4.165 |
| 2024 | 4.195 |
| 2025 | 4.220 |
| 2026 | 4.278 |
| Year | Average WOZ |
|---|---|
| 2021 | EUR 314.000 |
| 2022 | EUR 325.000 |
| 2023 | EUR 383.000 |
| 2024 | EUR 388.000 |
| 2025 | EUR 422.000 |
Hoger
720
Praktisch
970
Middelbaar
1.560
Europa
415
Nederland
3.650
Buiten Europa
150
Label C
426
Label A
337
Label B
289
Label D
232
Label F
200
Label G
136
Label E
73
Label A+++
34
Label A+
15
Label A++
10
Label A++++
3
Label A+++++
0
| Year | Gas (m3) | Electricity (kWh) |
|---|---|---|
| 2020 | 1.600 | 3.900 |
| 2021 | 1.770 | 3.960 |
| 2022 | 1.380 | 3.770 |
| 2023 | 1.110 | 3.560 |
| 2024 | 1.060 | 3.670 |
Hoekwoning
Gas: 970 • Electricity: 2.980
Huurwoning
Gas: 970 • Electricity: 2.620
Koopwoning
Gas: 1.150 • Electricity: 3.820
Appartement
Gas: 620 • Electricity: 2.160
Tussenwoning
Gas: 850 • Electricity: 2.760
Vrijstaande woning
Gas: 1.320 • Electricity: 4.250
Twee-onder-één-kap woning
Gas: 990 • Electricity: 3.050
Total number of company establishments: 705
| Period | Crimes |
|---|---|
| jan 2026 | 3 |
| jul 2025 | 8 |
| jun 2025 | 7 |
| mei 2025 | 4 |
| mrt 2025 | 8 |
| mrt 2026 | 8 |
| nov 2024 | 5 |
| nov 2025 | 5 |
| okt 2024 | 3 |
| okt 2025 | 5 |
| sep 2024 | 5 |
| sep 2025 | 5 |
These figures give an indicative picture of safety trends in the living environment of Ospel.
Short answers based on current local statistics, handy for a quick comparison of the living environment.
Ospel telt in 2026 ongeveer 4.278 inwoners.
De gemiddelde WOZ-waarde in Ospel is in 2025 circa € 422.000.
Het gemiddelde inkomen per inwoner in Ospel ligt rond € 34.300 per jaar.
Voor het huidige jaar gaat het om ongeveer 61 geregistreerde misdrijven. Gebruik deze cijfers als indicatie en vergelijk trends per periode.
In Ospel komt vooral "Vrijstaande woningen" veel voor, met ongeveer 918 woningen.