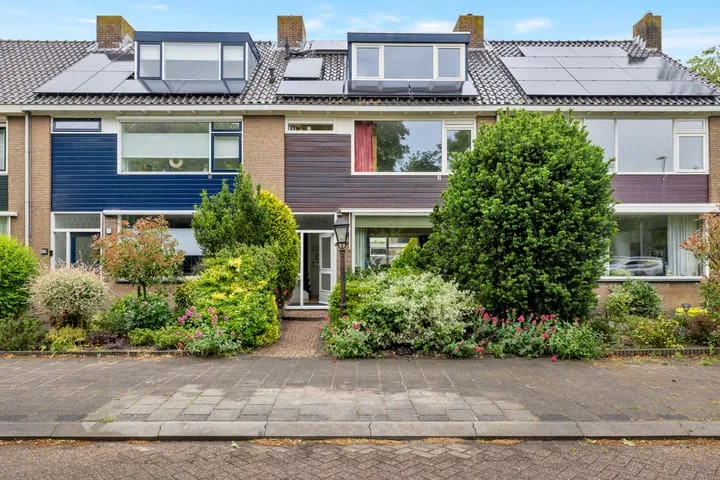
- Sold
Vestastraat 36
1829XN Oudorp
€ 235.000 k.k.
€ 4.607/m²
- Living area
- 51 m²
- Land area
- —
- Bedrooms
- 1
View 41 sold houses in Oudorp
Type to search. Use arrow down and arrow up to navigate through results and press Enter to open.
Hidden search suggestions.
Compare sold homes in Oudorp or view the current offering in this location directly.
On this page you will find recently sold homes in Oudorp. Use this overview to better estimate selling prices, popular neighborhoods, and the local housing supply before you choose a real estate agent. Also view the current housing supply with 49 houses in Oudorp.
1829XN Oudorp
€ 235.000 k.k.
€ 4.607/m²
1829CH Oudorp
€ 649.000 k.k.
€ 5.363/m²
1829AC Oudorp
€ 395.000 k.k.
€ 6.583/m²
1829BC Oudorp
€ 825.000 k.k.
€ 6.111/m²
1829CS Oudorp
€ 450.000 k.k.
€ 4.245/m²
1829XC Oudorp
€ 475.000 k.k.
€ 3.467/m²
1829XT Oudorp
€ 235.000 k.k.
€ 4.607/m²
1829BV Oudorp
€ 689.000 k.k.
€ 4.226/m²
1829XG Oudorp
€ 425.000 k.k.
€ 3.601/m²
1829HG Oudorp
€ 875.000 k.k.
€ 4.834/m²
1829CV Oudorp
€ 689.000 k.k.
€ 5.300/m²
1829ED Oudorp
€ 519.000 k.k.
€ 4.325/m²
1829CJ Oudorp
€ 950.000 k.k.
€ 4.298/m²
Bekijk recente verkopen en ontvang gratis offertes van lokale verkoopmakelaars in Oudorp.
Zelf je woning verkopen in Oudorp? Vergelijk verkoopmakelaars in Oudorp of bekijk de beste verkoopmakelaars in Oudorp als referentie bij jouw keuze.
Makelaars maken scherpere voorstellen als ze weten dat je vergelijkt — vraag offertes aan voor verkoop of aankoop.
Short answers about housing prices, sold homes and comparing real estate agents in Oudorp.
The costs of a real estate agent in Oudorp vary per office, property type and sales approach. Therefore, compare multiple quotes and also look at the real estate agents in Oudorp to better compare rates, presentation and local experience.
On this page we currently show 41 sold houses in Oudorp from our selection. This helps you to better assess recent transactions and the local housing market.
Houses sold in Oudorp give insight into asking prices, house types and neighborhoods where recent transactions have taken place. Compare this also with the current housing stock in Oudorp to better understand the market.
You can use sold homes as a first market indication, but a local real estate agent can better take into account finishing, location, maintenance and current demand in Oudorp.
Vergelijk makelaars in Oudorp op lokale verkoopervaring, reviews, verwachte opbrengst, courtage en marketingaanpak. Bekijk verkoopmakelaars in Oudorp of de top 10 makelaars in Oudorp om snel sterke kantoren te ontdekken.
View current location data on residents, WOZ development, housing stock, energy consumption, business activity and safety in Oudorp. In 2025 were there 4.108 residents. The average WOZ value in 2025 is EUR 439.993.
These figures help to better assess and compare the housing stock in Oudorp with recent sold homes. Orient yourself then on suitable top real estate agents in Oudorp for sales advice in this region.
Residents
4.108
Last year: 2025
Average WOZ
EUR 439.993
Last year: 2025
Average income per person.
EUR 34.459
Source: AllNumbers
Crimes (current year)
81
Total registered
| Year | Residents |
|---|---|
| 2021 | 4.144 |
| 2022 | 4.139 |
| 2023 | 4.129 |
| 2024 | 4.109 |
| 2025 | 4.108 |
| Year | Average WOZ |
|---|---|
| 2021 | EUR 313.980 |
| 2022 | EUR 345.002 |
| 2023 | EUR 409.641 |
| 2024 | EUR 412.464 |
| 2025 | EUR 439.993 |
Hoger
1.019
Praktisch
640
Middelbaar
1.158
Europa
262
Nederland
3.404
Buiten Europa
448
Label C
764
Label D
313
Label A
264
Label B
258
Label E
114
Label F
101
Label G
100
Label A+
40
Label A+++
14
Label A++
6
Label A++++
0
Label A+++++
0
| Year | Gas (m3) | Electricity (kWh) |
|---|---|---|
| 2020 | 1.334 | 2.678 |
| 2021 | 1.464 | 2.662 |
| 2022 | 1.116 | 2.493 |
| 2023 | 961 | 2.389 |
| 2024 | 937 | 2.400 |
Hoekwoning
Gas: 1.178 • Electricity: 2.535
Huurwoning
Gas: 656 • Electricity: 1.531
Koopwoning
Gas: 1.112 • Electricity: 2.865
Appartement
Gas: 556 • Electricity: 1.448
Tussenwoning
Gas: 1.038 • Electricity: 2.437
Vrijstaande woning
Gas: 1.159 • Electricity: 4.149
Twee-onder-één-kap woning
Gas: 1.113 • Electricity: 2.912
Total number of company establishments: 518
| Period | Crimes |
|---|---|
| jan 2025 | 12 |
| jan 2026 | 4 |
| jul 2025 | 6 |
| jun 2025 | 4 |
| mei 2025 | 6 |
| mrt 2025 | 4 |
| nov 2024 | 3 |
| nov 2025 | 3 |
| okt 2024 | 6 |
| okt 2025 | 12 |
| sep 2024 | 4 |
| sep 2025 | 7 |
These figures give an indicative picture of safety trends in the living environment of Oudorp.
Short answers based on current local statistics, handy for a quick comparison of the living environment.
Oudorp telt in 2025 ongeveer 4.108 inwoners.
De gemiddelde WOZ-waarde in Oudorp is in 2025 circa € 439.993.
Het gemiddelde inkomen per inwoner in Oudorp ligt rond € 34.459 per jaar.
Voor het huidige jaar gaat het om ongeveer 81 geregistreerde misdrijven. Gebruik deze cijfers als indicatie en vergelijk trends per periode.
In Oudorp komt vooral "Tussenwoningen" veel voor, met ongeveer 637 woningen.