Residents
3.795
Last year: 2025
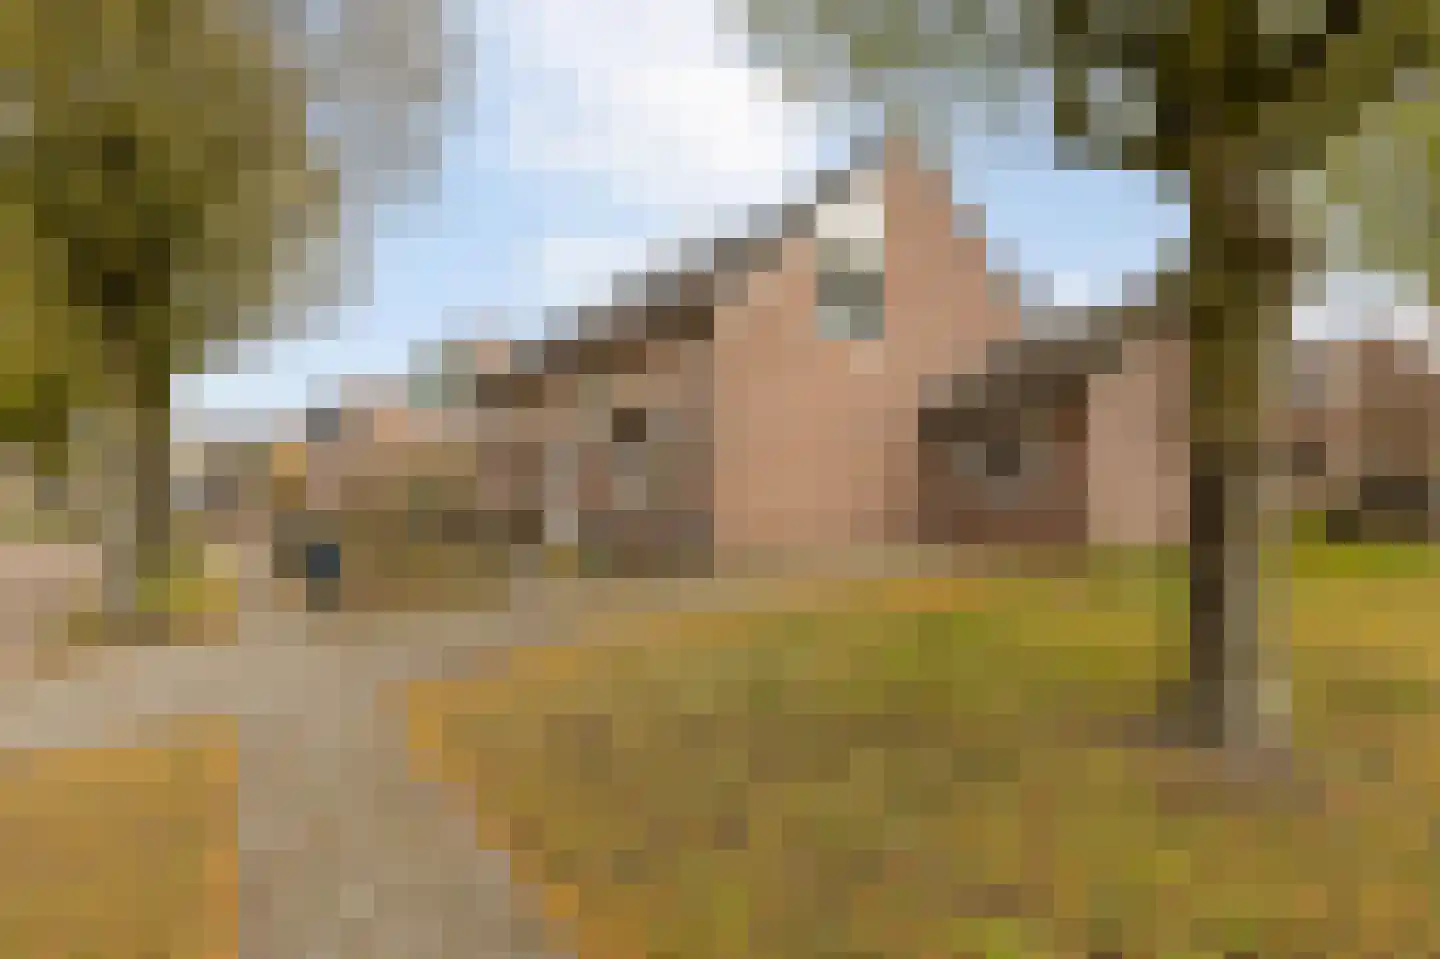
4645GA Putte • Noord-Brabant
€ 415.000 k.k.
Cost of copper (estimated): € 10.150
2% transfer tax (€ 8.300) + notary (€ 1.150) + valuation (€ 700)
Total incl. VAT: € 425.150
Purchase price /m²: € 3.294
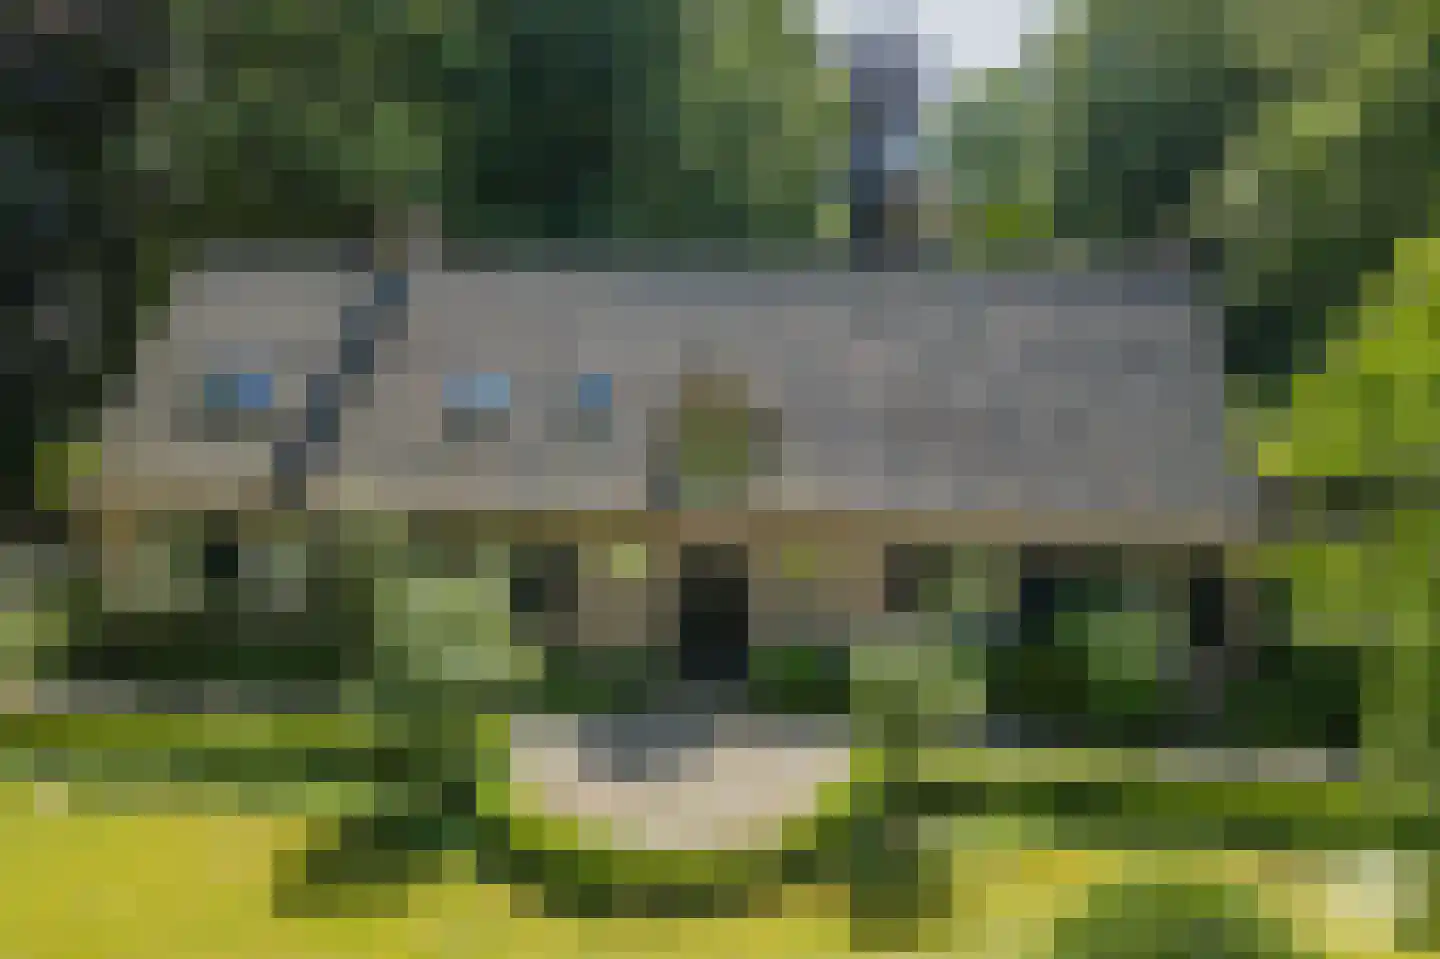
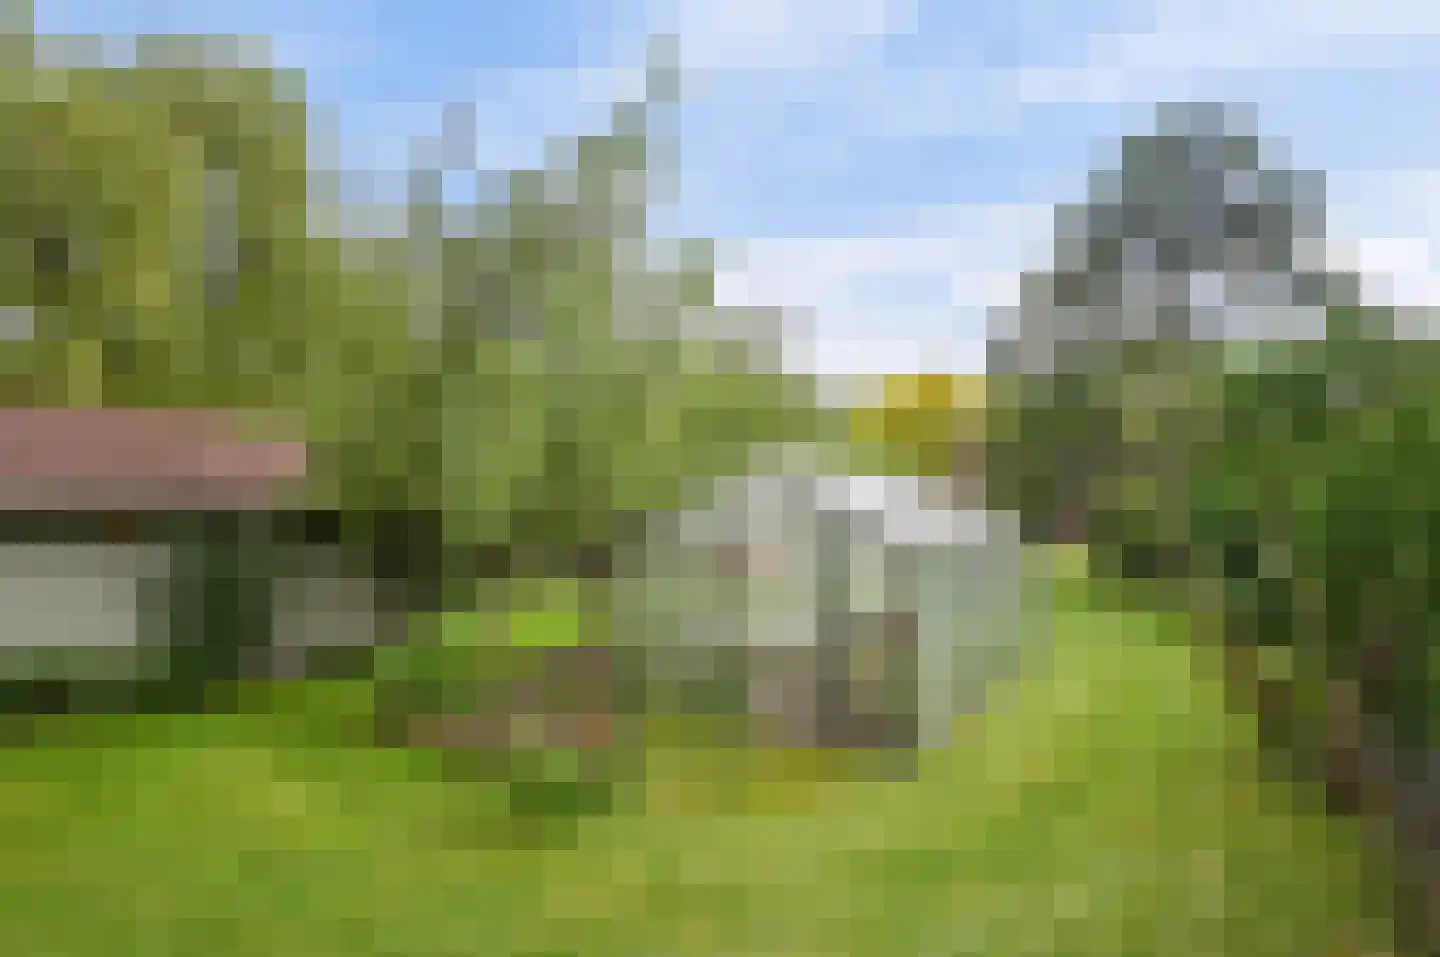
De instapklare twee-onder-één kapwoning met berging en 234 m² grond is centraal gelegen aan een rustige woonstraat in het dorp Putte. Het gevarieerde grenspark De Zoom – Kalmthoutse Heide met schitterende wandel- en fietsroutes is op loopafstand. Putte is een gezellig grensdorp met een ruim winkelaanbod (waarvan de meerderheid ook op zondag open is) en diverse voorzieningen, waaronder een huisarts, tandarts, apotheek, basisschool, peuterspeelzaal en verschillende sportverenigingen. Daarnaast zijn de uitgebreide voorzieningen van Bergen op Zoom en Antwerpen binnen circa 20 autominuten bereikbaar. Putte ligt vlakbij de A58 en A4 en heeft op die manier een prima verbinding met onder andere de steden Bergen op Zoom, Roosendaal, Breda, Rotterdam en Antwerpen. Het bouwjaar van de twee-onder-één kapwoning is omstreeks 1979. De woning heeft een gedegen traditionele bouwconstructie, gedeeltelijk betonnen (begane grond en eerste verdieping), gedeeltelijk houten vloeren (tweede verdieping), stenen buitengevels en zadeldak gedekt met pannen. De woning is voorzien van vloer-, muur- en dakisolatie, recente kunststof kozijnen met draai-/ kiepsysteem en HR++ beglazing en 12 stuks zonnepanelen. De woning heeft een inhoud van circa 420 m³ en een woonoppervlakte van circa 126 m². De twee-onder-één kapwoning wordt gekenmerkt door de volledige modernisatie, de sfeervolle, ruime en tuingerichte woonkamer met dubbele openslaande tuindeuren naar de achtertuin, de dichte keuken met ruime, complete en luxe keukeninrichting in hoekopstelling, de praktische bijkeuken, de recente badkamer met wastafelmeubel, inloopdouche, ligbad en tweede toilet, de aanwezigheid van drie ruime slaapkamers, de fraaie achtertuin met overkapping en stenen berging, de ruime oprit en de ligging in een rustige woonwijk en bosrijke omgeving. Indeling Begane grond: De ruime hal/ entree aan de voorzijde van de woning biedt toegang tot de moderne meterkast (12 groepen en groep zonnepanelen, 4 aardlekschakelaars), de toiletruimte, de sfeervolle, ruime en tuingerichte woonkamer en de trapopgang naar de eerste verdieping. De hal/ entree heeft een tegelvloer, spachtelputz wanden en spuitwerk plafond. De toiletruimte heeft een tegelvloer, betegelde wanden en stucwerk plafond en is ingericht met een hangtoilet en fonteintje. De sfeervolle, ruime en tuingerichte woonkamer (circa 38,5 m²) heeft een tegelvloer, spachtelputz wanden, stucwerk plafond en dubbele openslaande tuindeuren naar het terras en de achtertuin. De woonkamer staat in halfopen verbinding met een extra ruimte/ kamer en biedt toegang tot de inbouwkast en de keuken. Vanuit de woonkamer is er een schitterend uitzicht op de ruime achtertuin. De extra kamer/ ruimte (circa 5 m²) heeft een tegelvloer, spachtelputz wanden, decoratieve houtlookwand en stucwerk plafond. Deze ruimte is ideaal als thuiswerkplek, dan wel voor het uitoefenen van een hobby. De keuken (circa 9,5 m²) heeft een tegelvloer, stucwerk wanden en lichte balken plafond. De ruime, complete en luxe keukeninrichting in hoekopstelling heeft een composiet aanrechtblad en achterwand, spoelbak, close-in boiler, 5-pits inductieplaat (Neff), wandafzuigkap (Neff), heteluchtoven (Neff), magnetron (Neff), koelkast, vrieskast met 3 lades en vaatwasser. Vanuit de keuken is er een mooi uitzicht op de ruim opgezette straat. De keuken biedt toegang tot de praktische bijkeuken. De praktische bijkeuken (circa 5,5 m²) aan de achterzijde van de woning heeft een tegelvloer, spachtelputz wanden en lichte balken plafond. In de bijkeuken zijn de aansluitingen voor de wasmachine en droger aanwezig en is een opstelplaats voor een koel- en/ of vrieskast. De bijkeuken biedt middels een luik toegang tot de kleine bergzolder en biedt toegang tot de achtertuin. Eerste verdieping: de overloop heeft een laminaat vloer, spachtelputz wanden en stucwerk plafond en biedt toegang tot de badkamer, de drie slaapkamers en middels een vlizotrap de zolderruimte. De recente en complete badkamer (circa 6 m²) aan de voorzijde van de woning heeft een tegelvloer, betegelde wanden, stucwerk plafond met spotlights en dakraam en is ingericht met een badkamermeubel met wastafel, inloopdouche, ligbad, hangtoilet en designradiator. De eerste slaapkamer (ruim 9 m²) aan de voorzijde van de woning heeft een laminaat vloer, spachtelputz wanden en stucwerk plafond. De tweede slaapkamer (circa 14 m²) aan de achterzijde van de woning heeft een laminaat vloer, gedeeltelijk spachtelputz, gedeeltelijk stucwerk wanden, stucwerk plafond, kastenwand met schuifdeuren en dakkapel. De derde slaapkamer (ruim 14 m²) aan de achterzijde van de woning heeft een laminaat vloer, spachtelputz wanden, stucwerk plafond en dakkapel. Tweede verdieping: middels vlizotrap bereikbare zolderruimte (circa 7 m², nokhoogte circa 1,97 meter) met houten vloer en de dakconstructie in het zicht (geïsoleerd). Op de zolderruimte zijn de CV-installatie (Vaillant EcoTec plus, bouwjaar 2013) en omvormer ten behoeve van de zonnepanelen opgesteld. Tuin en verdere inrichting Voor de keuken is een ruime oprit aanwezig. De fraaie achtertuin is voorzien van een terras, sierbestrating, gazon, plantenborders, stenen berging, houten overkapping, buitenkraan en achterom. De stenen berging (circa 8 m²) aan de achterzijde van de tuin heeft een betonnen vloer, stenen gevels en plat dak met EPDM dakbedekking (in 2019 vernieuwd) en is voorzien van elektriciteit. Tussen de woning en de stenen berging is de overkapping (circa 10 m²) gerealiseerd. De overkapping is voorzien van sierbestrating, gedeeltelijk stenen, gedeeltelijk houten gevels en plat dak met EPDM dakbedekking. De overkapping is ideaal voor de opslag van tuingereedschap, fietsen en dergelijke. Bijzonderheden - De woning is volledig gemoderniseerd en aldus instapklaar; - Sfeervolle, tuingerichte en ruime woonkamer met dubbele openslaande tuindeuren naar het terras en de achtertuin; - De dichte keuken is voorzien van een ruime, complete en luxe keukeninrichting in hoekopstelling; - Praktische bijkeuken met de aansluitingen voor de wasmachine en droger en opstelplaats voor een koel- en/ of vrieskast; - Halfopen extra kamer/ ruimte, welke te bereiken is vanuit de woonkamer en ideaal is als thuiswerkplek en/ of hobbyruimte; - Recente en complete badkamer met wastafelmeubel, inloopdouche, ligbad, hangtoilet en designradiator; - Er zijn drie ruime slaapkamers aanwezig; - De raampartijen van de slaapkamers zijn voorzien van elektrisch bedienbare rolluiken; - De woning is voorzien van een waterontharder; - De woning is voorzien van een glasvezelaansluiting; - De woning is voorzien van vloer-, muur- en dakisolatie en recente kunststof kozijnen met draai-/ kiepsysteem en HR++ beglazing; - In 2019 zijn er 12 stuks zonnepanelen op het dak aan de voorzijde van de woning geïnstalleerd. - De woning heeft een definitief energielabel C (afgegeven voor het plaatsen van de kunststof kozijnen en zonnepanelen en extra isolerende maatregelen); - Fraaie achtertuin met terras, sierbestrating, gazon, plantenborders, stenen berging, overkapping, buitenkraan en achterom; - Centrale en rustige ligging en in de directe nabijheid van het grenspark De Zoom – Kalmthoutse Heide met schitterende wandel- en fietspaden; - Om een goede indruk te krijgen van de woning is een bezichtiging aan te bevelen!
€ 415.000
Cost of copper (estimated): € 10.150
2% transfer tax (€ 8.300) + notary (€ 1.150) + valuation (€ 700)
Total purchase (incl. p.p.): € 425.150
3,02%
Yearly
€ 20.750
Direct available
Estimated mortgage
Indicative gross monthly cost
Based on annuity and 30 year term
Indicative net monthly cost
iDisclaimer: this mortgage calculation is a simplified indication based on general assumptions. No rights can be derived from the results shown. Calculated with 10-annual interest (met NHG), automatically determined based on the price limit € 470.000. Source: 10-jaars rente uit mortgage_rates (08-06-2026 03:45).
Inloopdouche, ligbad, toilet, en wastafelmeubel
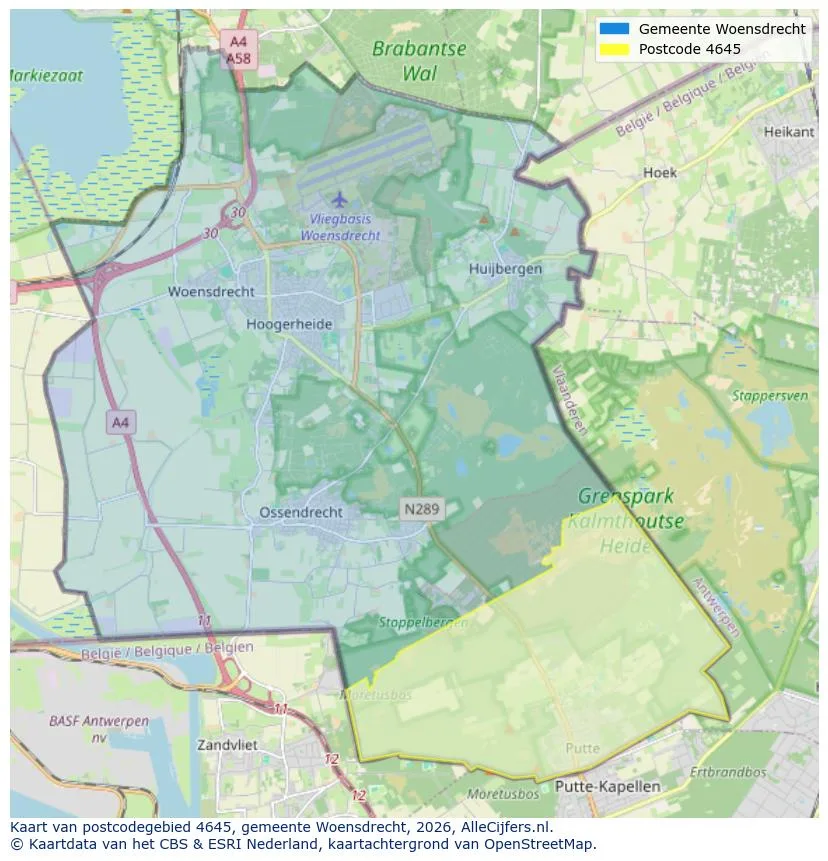
Spatial overview of the work area in Putte
View current location data on residents, WOZ development, housing stock, energy consumption, business activity and safety in Putte. In 2025 were there 3.795 residents. The average WOZ value in 2025 is EUR 326.000.
Residents
3.795
Last year: 2025
Average WOZ
EUR 326.000
Last year: 2025
Average income per person.
EUR 31.500
Source: AllNumbers
Crimes (current year)
144
Total registered
| Year | Residents |
|---|---|
| 2021 | 3.785 |
| 2022 | 3.860 |
| 2023 | 3.845 |
| 2024 | 3.870 |
| 2025 | 3.795 |
| Year | Average WOZ |
|---|---|
| 2021 | EUR 250.000 |
| 2022 | EUR 264.000 |
| 2023 | EUR 296.000 |
| 2024 | EUR 305.000 |
| 2025 | EUR 326.000 |
Hoger
360
Praktisch
1.320
Middelbaar
1.160
Europa
1.785
Nederland
1.820
Buiten Europa
195
Label C
690
Label D
322
Label B
290
Label A
230
Label G
157
Label F
145
Label E
92
Label A+
50
Label A++
13
Label A+++
6
Label A++++
1
Label A+++++
0
| Year | Gas (m3) | Electricity (kWh) |
|---|---|---|
| 2020 | 1.420 | 3.150 |
| 2021 | 1.610 | 3.210 |
| 2022 | 1.260 | 3.030 |
| 2023 | 1.050 | 2.920 |
| 2024 | 1.040 | 3.010 |
Hoekwoning
Gas: 1.080 • Electricity: 2.850
Huurwoning
Gas: 830 • Electricity: 2.030
Koopwoning
Gas: 1.120 • Electricity: 3.200
Appartement
Gas: 570 • Electricity: 1.700
Tussenwoning
Gas: 890 • Electricity: 2.610
Vrijstaande woning
Gas: 1.320 • Electricity: 3.650
Twee-onder-één-kap woning
Gas: 1.110 • Electricity: 2.950
Total number of company establishments: 345
| Period | Crimes |
|---|---|
| jan 2026 | 14 |
| jul 2025 | 15 |
| jun 2025 | 12 |
| mei 2025 | 7 |
| mrt 2025 | 15 |
| mrt 2026 | 10 |
| nov 2024 | 13 |
| nov 2025 | 11 |
| okt 2024 | 10 |
| okt 2025 | 11 |
| sep 2024 | 11 |
| sep 2025 | 11 |
These figures give an indicative picture of safety trends in the living environment of Putte.
Short answers based on current local statistics, handy for a quick comparison of the living environment.
Putte telt in 2025 ongeveer 3.795 inwoners.
De gemiddelde WOZ-waarde in Putte is in 2025 circa € 326.000.
Het gemiddelde inkomen per inwoner in Putte ligt rond € 31.500 per jaar.
Voor het huidige jaar gaat het om ongeveer 144 geregistreerde misdrijven. Gebruik deze cijfers als indicatie en vergelijk trends per periode.
In Putte komt vooral "Vrijstaande woningen" veel voor, met ongeveer 620 woningen.
View more homes in this location.
4645RA Putte
€ 1.198.000 k.k.
€ 3.365/m²
4645RA Putte
€ 715.000 k.k.
€ 3.295/m²
4645BJ Putte
€ 525.000 k.k.
€ 2.734/m²
4645GA Putte
€ 419.000 k.k.
€ 3.174/m²
4645RW Putte
€ 209.000 k.k.
4645RN Putte
€ 679.000 k.k.
€ 4.353/m²
4645GL Putte
€ 385.000 k.k.
€ 3.031/m²

4645RA Putte
€ 436.500 k.k.
€ 4.197/m²
