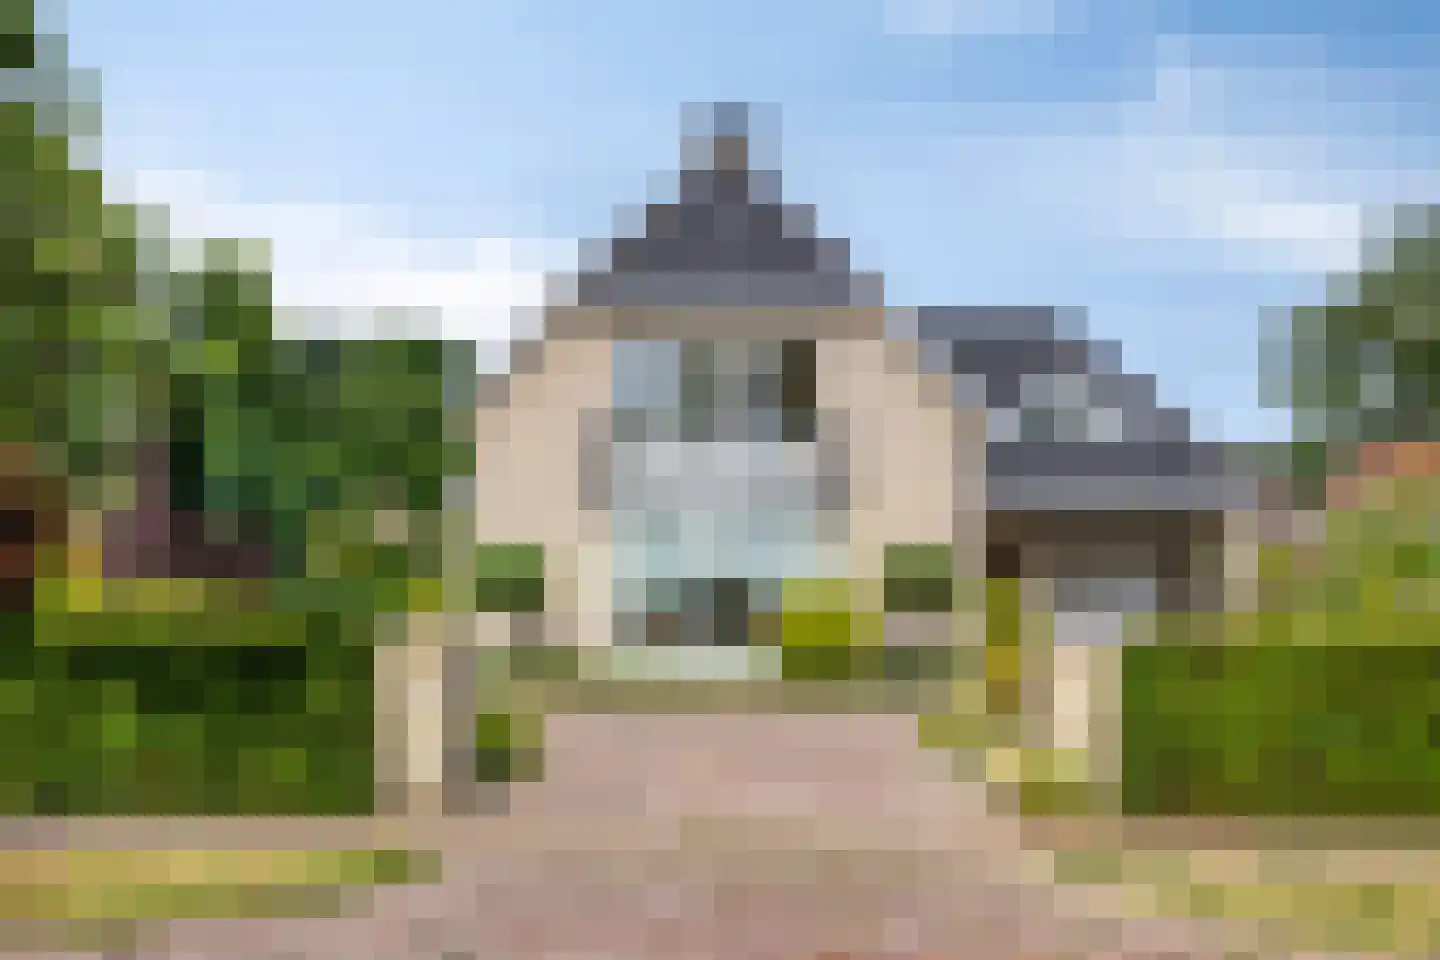
Houses sold in Riethoven

View 18 sold houses in Riethoven

Connected to: Vastgoed Nederland NVM Makelaars

On this page you will find recently sold homes in Riethoven. Use this overview to better estimate selling prices, popular neighborhoods, and the local housing supply before you choose a real estate agent. Also view the current housing supply with 24 houses in Riethoven.

Selection

Search and filter homes

Set your preferences and discover homes that suit you.

Total supply 241.450
Filters

Set price, area and other characteristics. Adjust a filter or click on Show homes. Location changes directly above.

Reset filters

You search for

  • Place Riethoven
  • Status Sold

Huis verkopen in Riethoven? Vergelijk verkoopmakelaars

Bekijk recente verkopen en ontvang gratis offertes van lokale verkoopmakelaars in Riethoven.

Free request a quote

  • Quotes in Riethoven
  • Non-binding
  • Personal
  • Gratis tarieven vergelijken

Zelf je woning verkopen in Riethoven? Vergelijk verkoopmakelaars in Riethoven of bekijk de beste verkoopmakelaars in Riethoven als referentie bij jouw keuze.

Vergelijk meerdere offertes

Makelaars maken scherpere voorstellen als ze weten dat je vergelijkt — vraag offertes aan voor verkoop of aankoop.

Frequently asked questions about sold homes in Riethoven

Short answers about housing prices, sold homes and comparing real estate agents in Riethoven.

Residential and neighborhood statistics in Riethoven

View current location data on residents, WOZ development, housing stock, energy consumption, business activity and safety in Riethoven. In 2025 were there 2.421 residents. The average WOZ value in 2025 is EUR 589.294.

These figures help to better assess and compare the housing stock in Riethoven with recent sold homes. Orient yourself then on suitable top real estate agents in Riethoven for sales advice in this region.

Residents

2.421

Last year: 2025

Average WOZ

EUR 589.294

Last year: 2025

Average income per person.

EUR 37.463

Source: AllNumbers

Crimes (current year)

52

Total registered

Demographics and WOZ development

Inhabitants per year

Inhabitants per year in Riethoven
Year Residents
2021 2.450
2022 2.472
2023 2.447
2024 2.414
2025 2.421

Annual WOZ value

WOZ value per year in Riethoven
Year Average WOZ
2021 EUR 428.971
2022 EUR 470.464
2023 EUR 523.217
2024 EUR 586.141
2025 EUR 589.294

Composition of residents

Age build-up

65+: 640 0-15: 325 15-25: 251 25-45: 451 45-65: 791

Education level

Hoger

420

Praktisch

216

Middelbaar

657

Origin of residents (2025)

Europa

158

Nederland

2.151

Buiten Europa

128

Housing stock and construction periods

Types of homes

Hoekwoningen 99
Appartementen 94
Tussenwoningen 138
Vrijstaande woningen 567
Twee-onder-één-kap woningen 204

Construction period of buildings

Voor 1700 1
1700 tot 1900 22
1900 tot 1925 26
1925 tot 1950 58
1950 tot 1970 302
1970 tot 1980 176
1980 tot 1990 192
1990 tot 2000 96
2000 tot 2010 91
2010 tot 2020 65
2020 en later 78

Energy and sustainability

Energy label distribution

Label C

246

Label A

190

Label B

148

Label D

123

Label F

119

Label G

67

Label A+++

44

Label E

35

Label A+

14

Label A++

7

Label A++++

7

Label A+++++

0

Average energy consumption per year

Average energy consumption per year in Riethoven
Year Gas (m3) Electricity (kWh)
2020 1.765 3.910
2021 1.998 3.991
2022 1.568 3.727
2023 1.252 3.592
2024 1.195 3.671

Consumption per house type

Hoekwoning

Gas: 526 • Electricity: 1.435

Huurwoning

Gas: 1.000 • Electricity: 2.298

Koopwoning

Gas: 1.282 • Electricity: 3.806

Appartement

Gas: 667 • Electricity: 1.828

Tussenwoning

Gas: 484 • Electricity: 1.459

Vrijstaande woning

Gas: 1.349 • Electricity: 4.047

Twee-onder-één-kap woning

Gas: 603 • Electricity: 1.687

Business activity in Riethoven (2025)

Handel en HORECA 49
Nijverheid en energie 63
Zakelijke dienstverlening 107
Overheid, onderwijs en zorg 53
Landbouw, bosbouw en visserij 42
Vervoer, informatie en communicatie 30
Financiele diensten en onroerendgoed 39
Cultuur, recreatie en overige diensten 34

Total number of company establishments: 439

Recent crime statistics

Recent crime statistics in Riethoven
Period Crimes
jan 2025 1
jan 2026 4
jul 2025 3
jun 2025 3
mei 2025 4
mrt 2025 5
nov 2024 2
nov 2025 7
okt 2024 4
okt 2025 8
sep 2024 4
sep 2025 3

These figures give an indicative picture of safety trends in the living environment of Riethoven.

Frequently asked questions about living in Riethoven

Short answers based on current local statistics, handy for a quick comparison of the living environment.

Hoeveel inwoners heeft Riethoven?

Riethoven telt in 2025 ongeveer 2.421 inwoners.

Wat is de gemiddelde WOZ-waarde in Riethoven?

De gemiddelde WOZ-waarde in Riethoven is in 2025 circa € 589.294.

Wat is het gemiddelde inkomen per inwoner in Riethoven?

Het gemiddelde inkomen per inwoner in Riethoven ligt rond € 37.463 per jaar.

Hoe veilig is wonen in Riethoven?

Voor het huidige jaar gaat het om ongeveer 52 geregistreerde misdrijven. Gebruik deze cijfers als indicatie en vergelijk trends per periode.

Welke woningtypen komen het meest voor in Riethoven?

In Riethoven komt vooral "Vrijstaande woningen" veel voor, met ongeveer 567 woningen.

Gratis vrijblijvende offertes ontvangen

Vergelijk meerdere makelaars en kies de beste match.