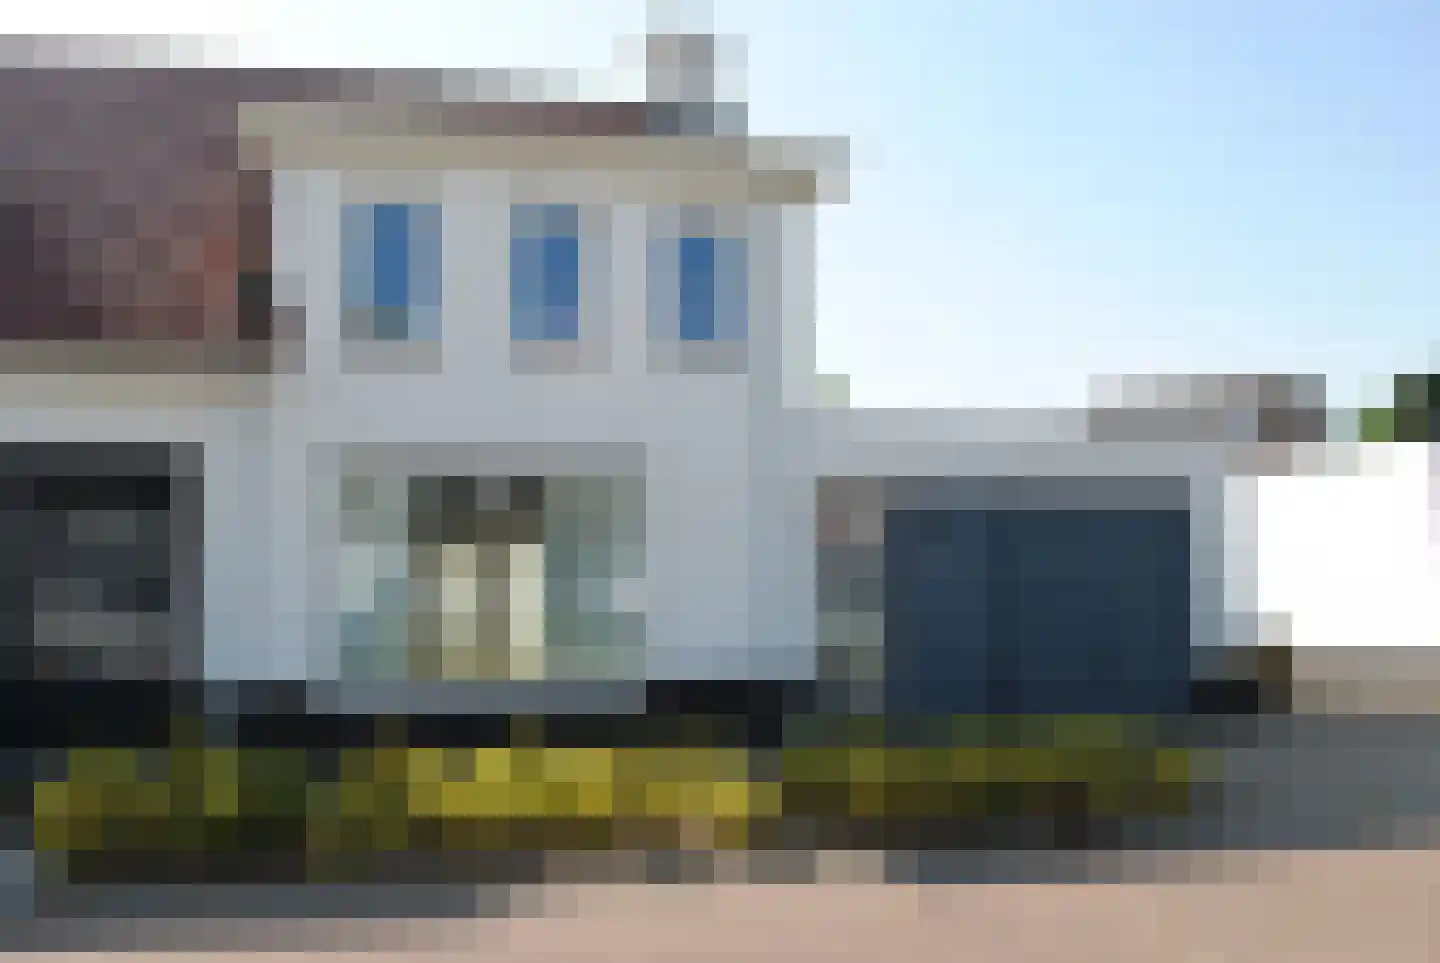
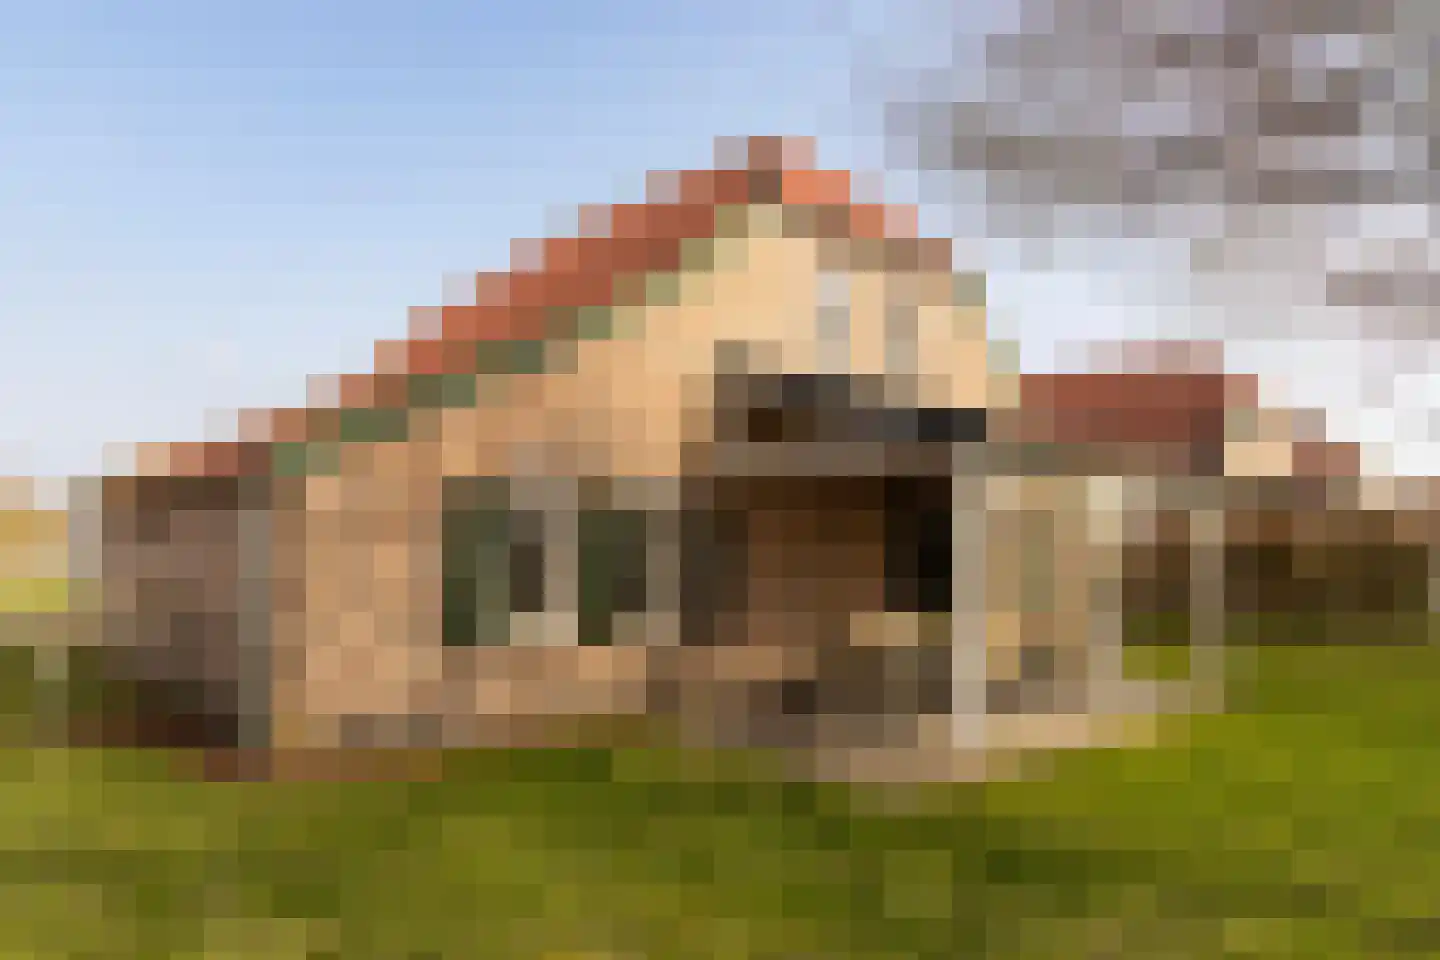
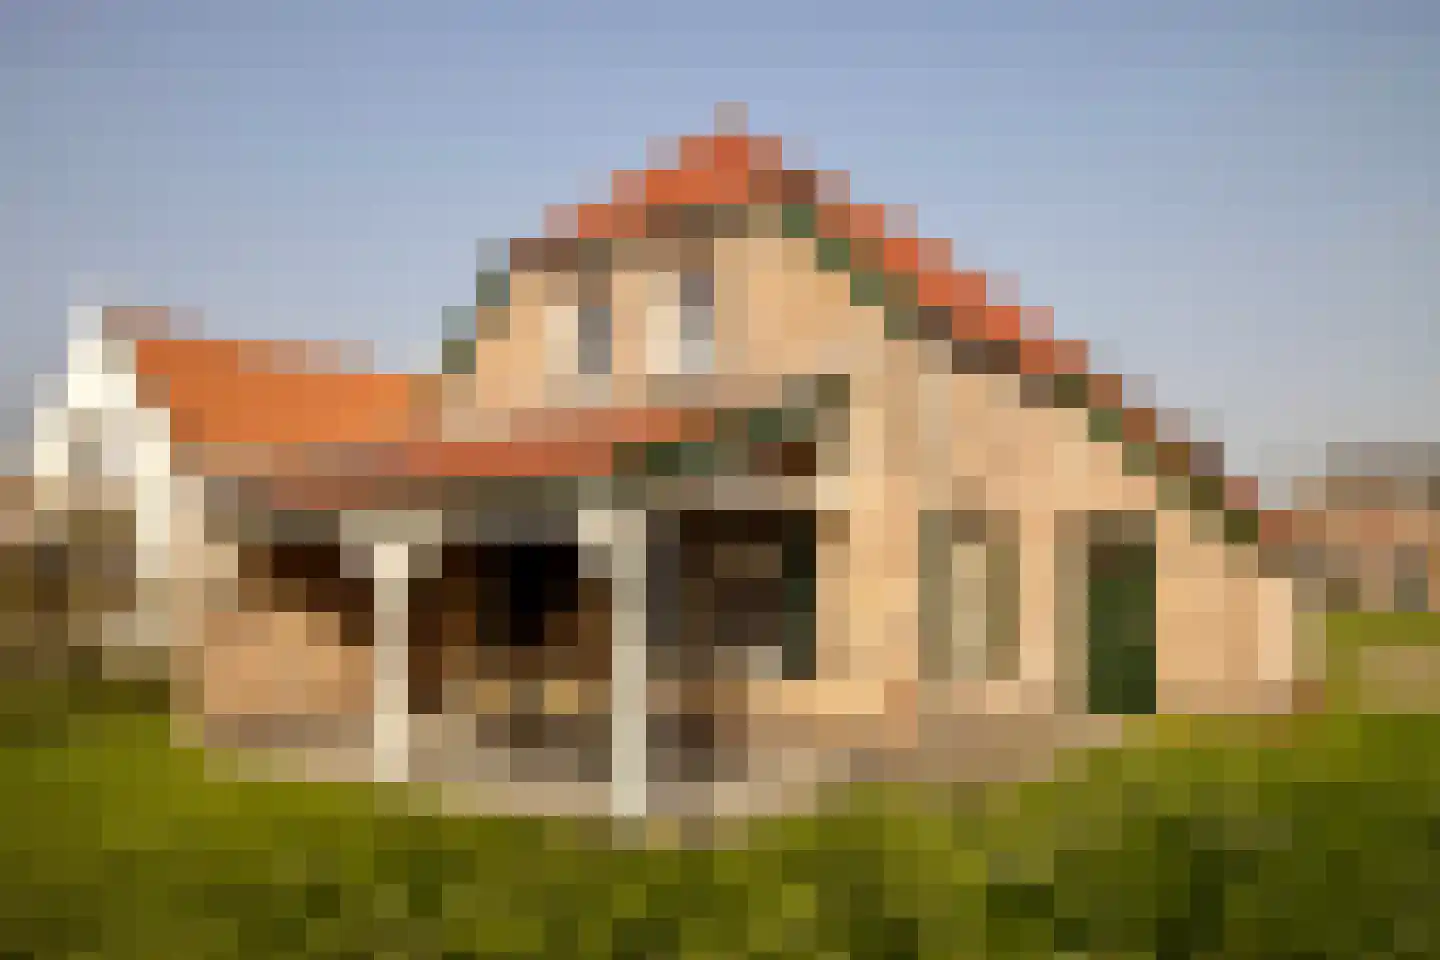
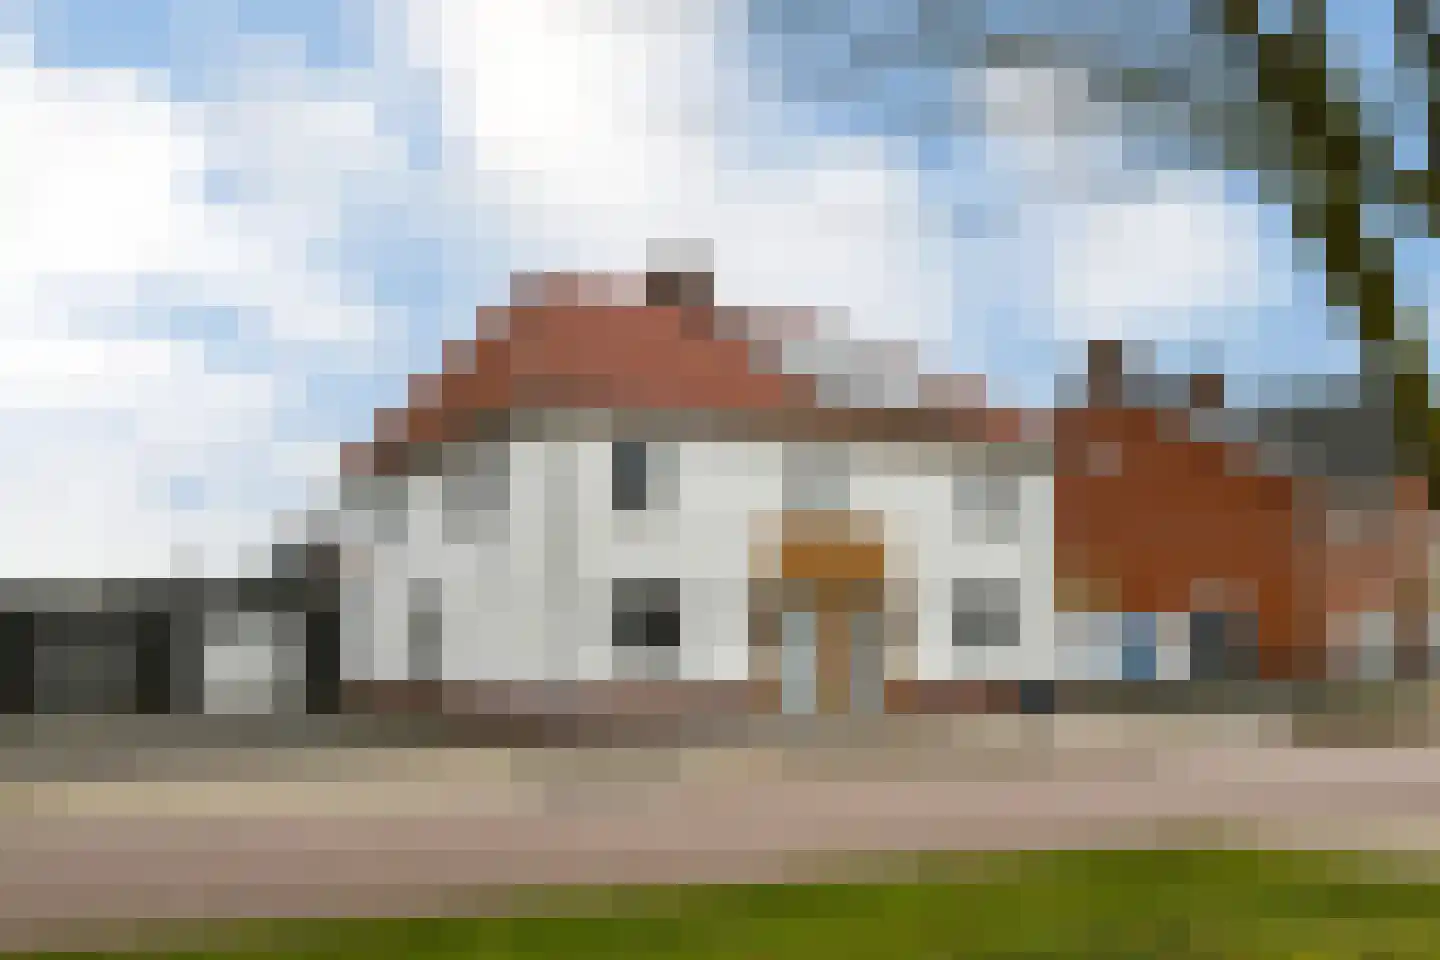
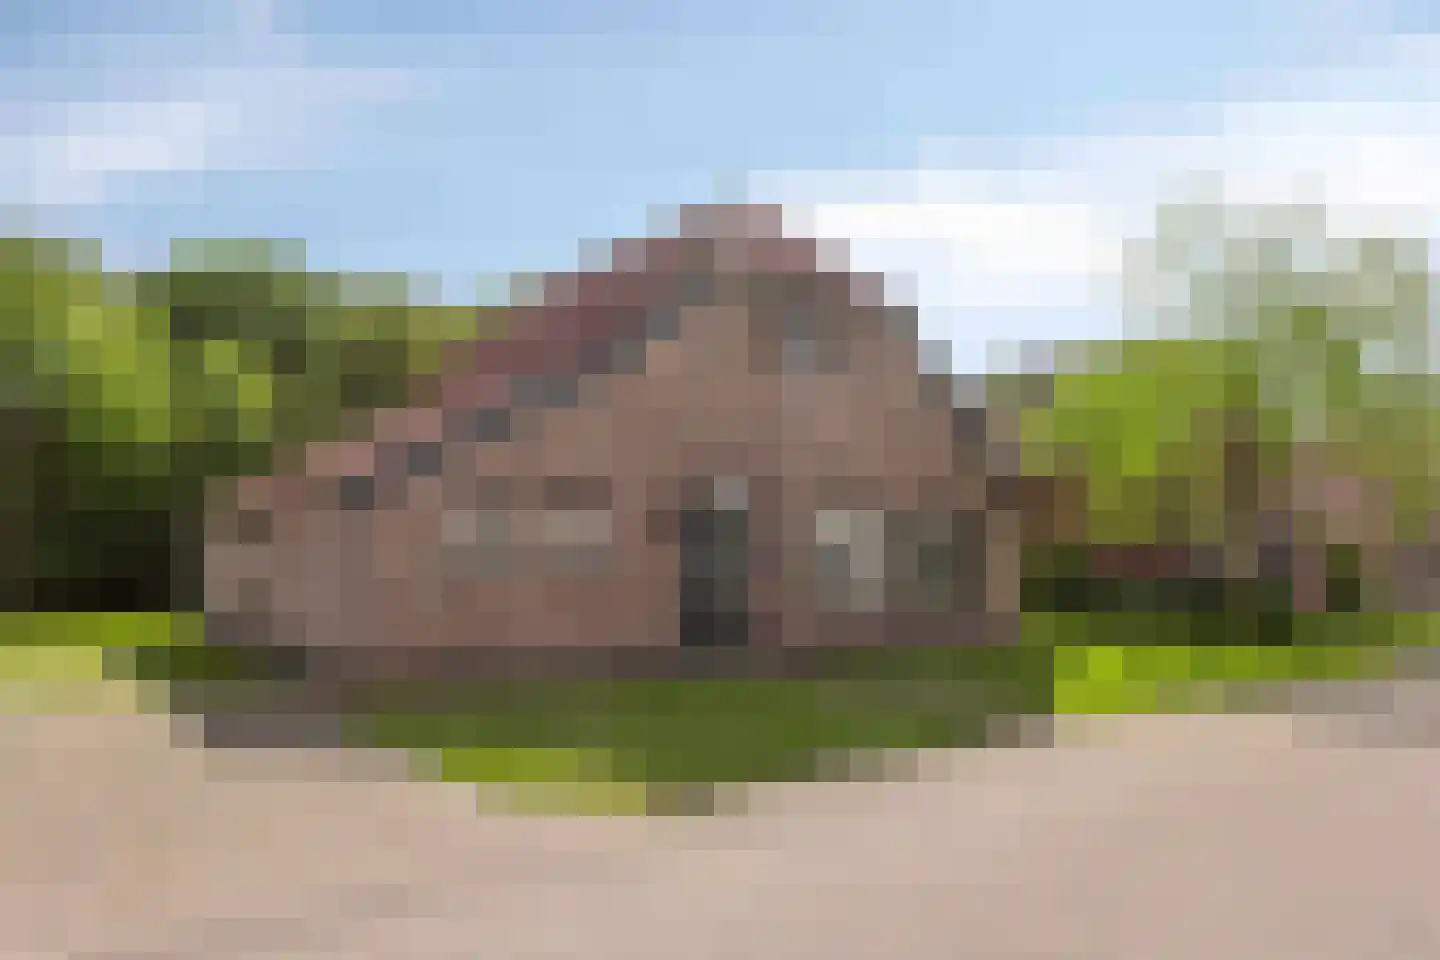
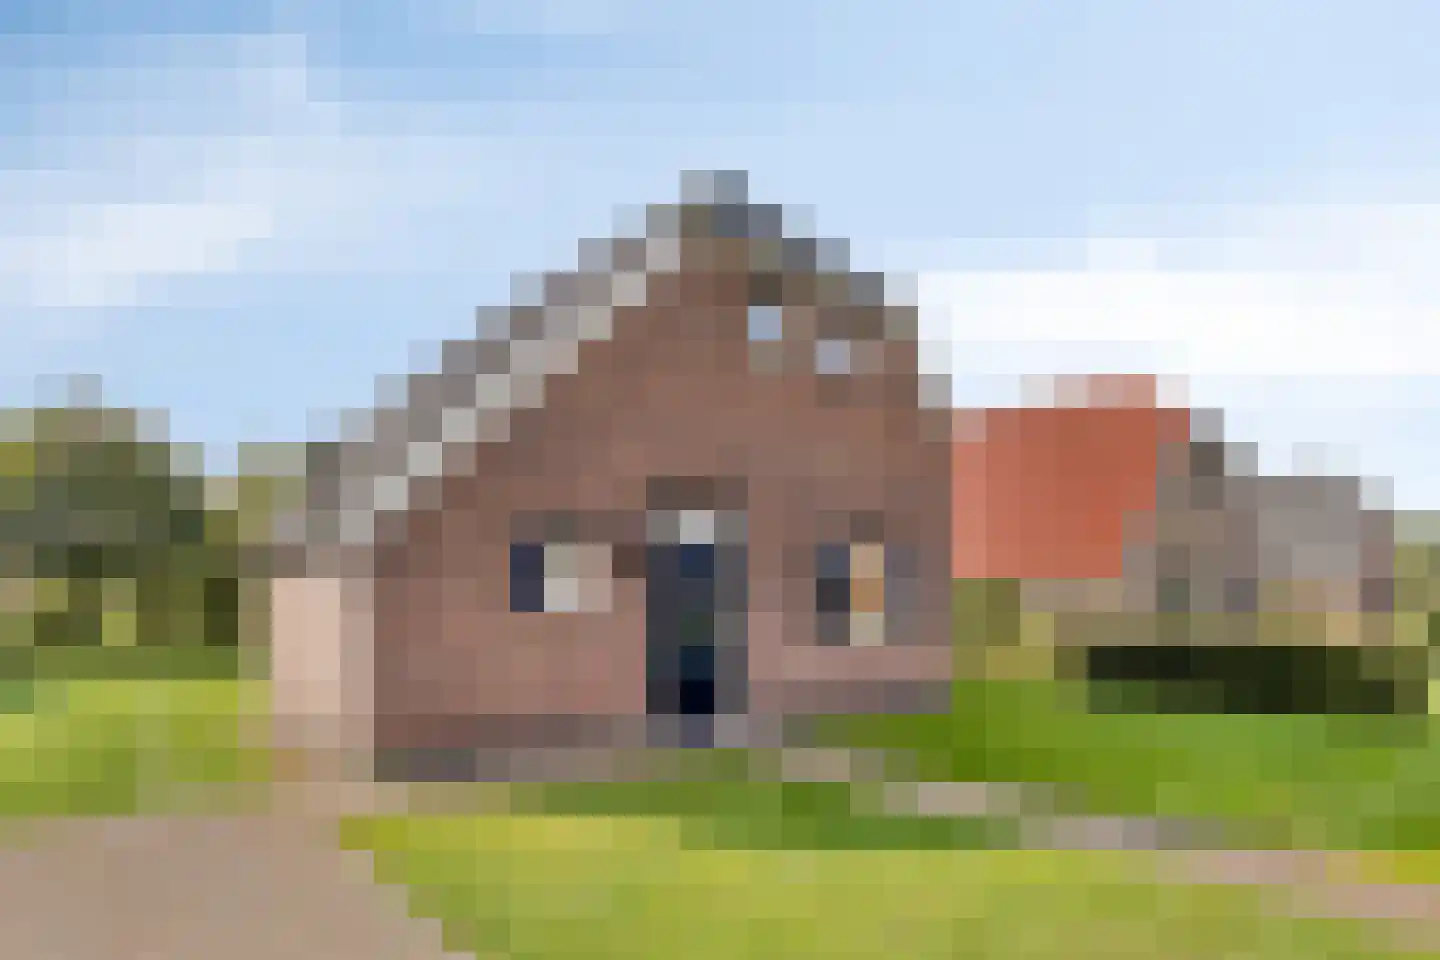
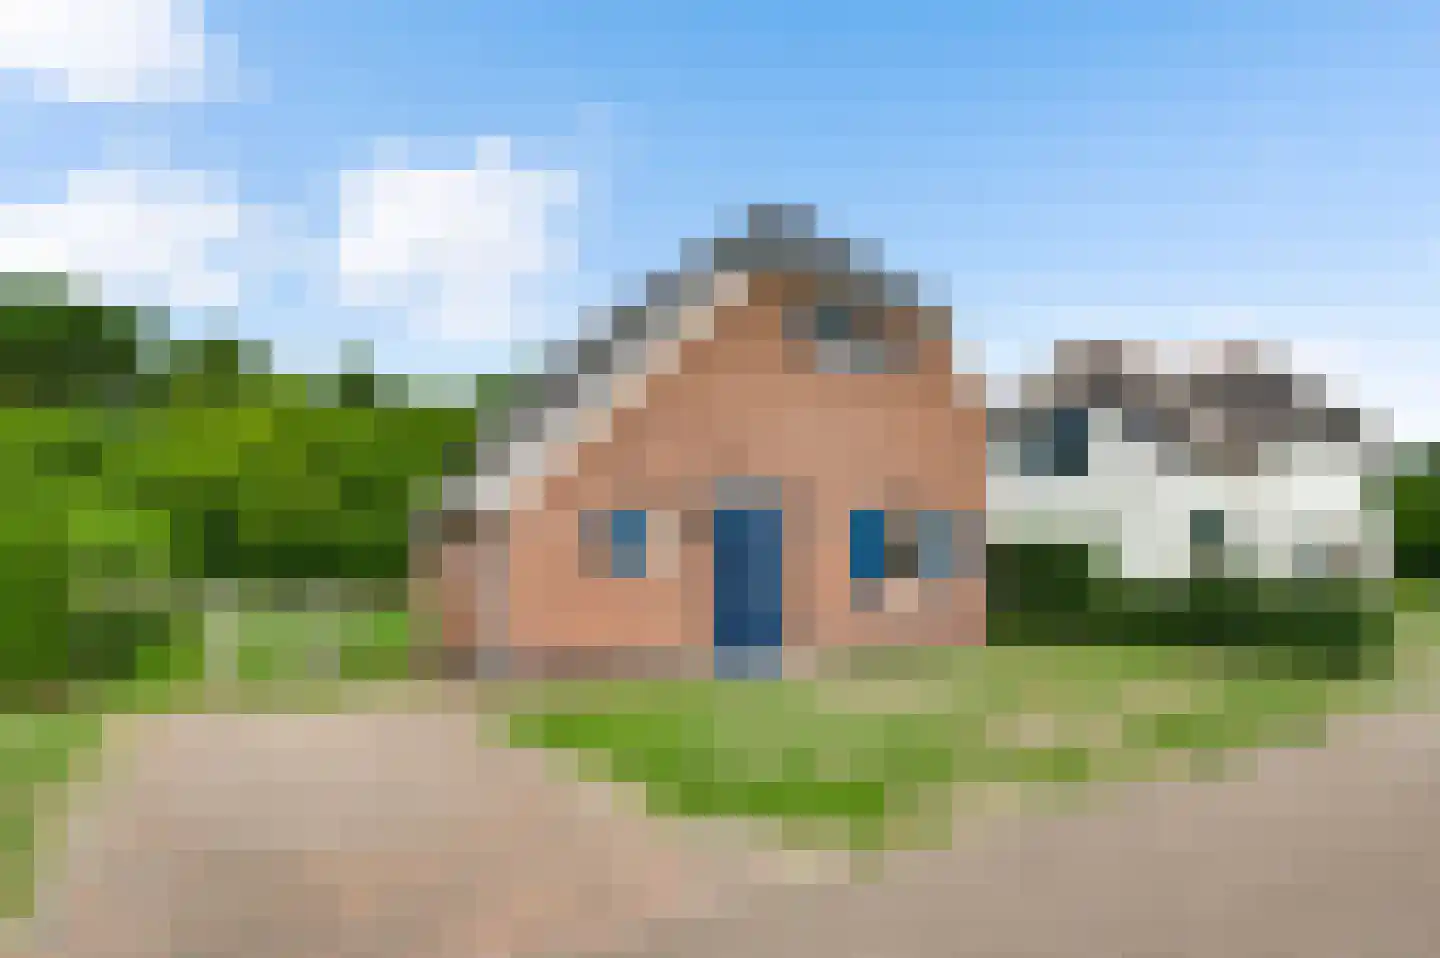
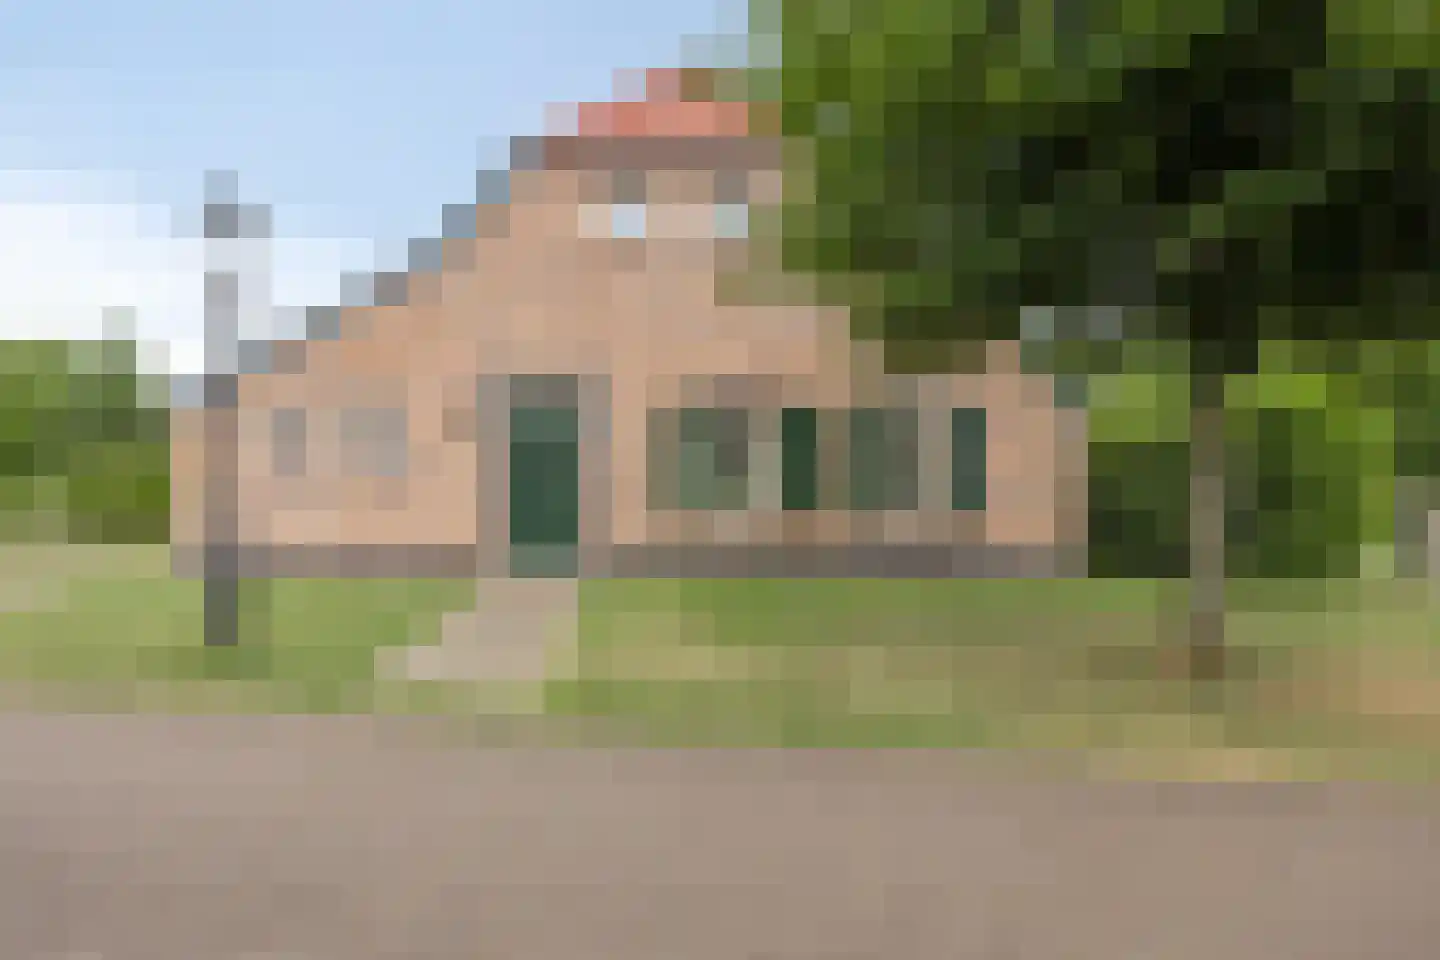
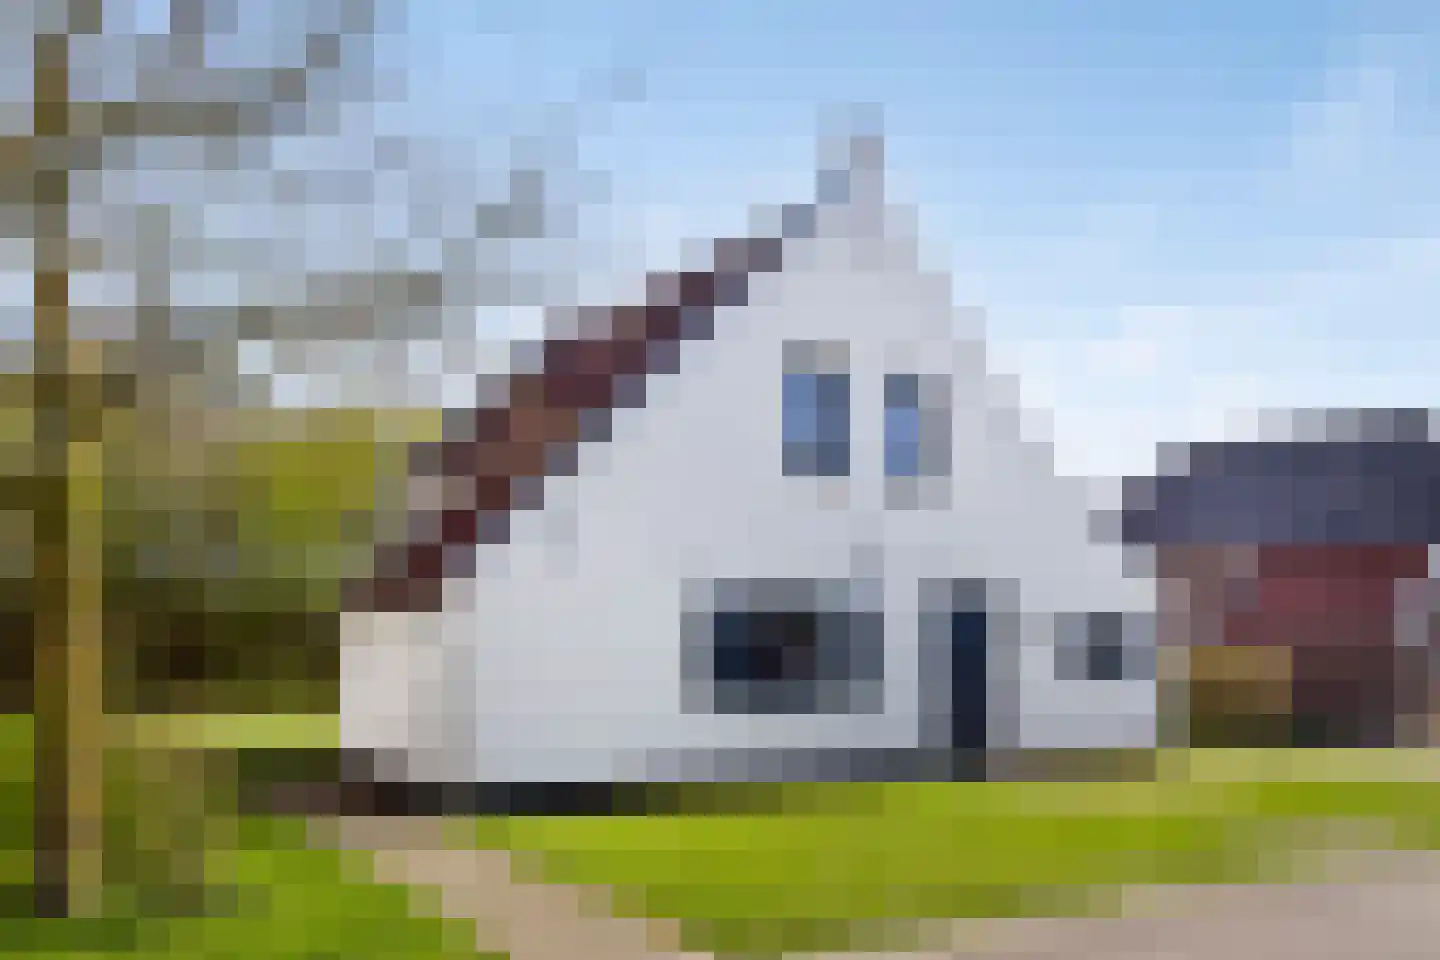
- Available
Beltmolenstraat 23
6088CA Roggel
€ 495.000 k.k.
€ 3.235/m²
- Living area
- 153 m²
- Land area
- 298 m²
- Bedrooms
- 4
Searching in 63 houses in Roggel
Type to search. Use arrow down and arrow up to navigate through results and press Enter to open.
Hidden search suggestions.
View current properties in Roggel or search targeted on street, postal code and property characteristics.
View the current housing stock in Roggel and quickly filter by price, living area, rooms and more. There are currently 63 houses in this place within our selection. View also 33 sold houses in Roggel for extra insight into the local housing market.
6088CA Roggel
€ 495.000 k.k.
€ 3.235/m²
6088CA Roggel
€ 450.000 k.k.
€ 2.812/m²
6088NM Roggel
€ 225.000 k.k.
6088NM Roggel
€ 245.000 k.k.
6088NM Roggel
€ 269.000 k.k.
6088BK Roggel
€ 289.000 k.k.
€ 3.360/m²
6088NM Roggel
€ 329.000 k.k.
6088NM Roggel
€ 259.000 k.k.
6088HT Roggel
€ 387.500 k.k.
6088NM Roggel
€ 395.000 k.k.
6088CA Roggel
€ 585.000 k.k.
€ 3.524/m²
6088NM Roggel
€ 425.000 k.k.
€ 2.833/m²
6088BL Roggel
€ 415.000
€ 3.517/m²
6088EG Roggel
€ 269.000 k.k.
€ 4.138/m²
6088NM Roggel
€ 249.500 k.k.
€ 2.446/m²
6088NM Roggel
€ 369.000 k.k.
€ 3.416/m²
6088EL Roggel
€ 400.000
€ 4.211/m²
6088NM Roggel
€ 309.000 k.k.
€ 2.653/m²
6088NM Roggel
€ 249.500 k.k.
€ 2.867/m²
6088NM Roggel
€ 249.500 k.k.
€ 2.977/m²
6088NM Roggel
€ 325.000 k.k.
€ 0/m²
6088EL Roggel
€ 405.000
€ 4.263/m²
6088NH Roggel
€ 2.295.000 k.k.
€ 5.325/m²
6088NM Roggel
€ 289.000 k.k.
€ 2.603/m²
6088NM Roggel
€ 399.000 k.k.
€ 2.973/m²
6088NM Roggel
€ 315.000 k.k.
€ 2.603/m²
6088NM Roggel
€ 248.000 k.k.
€ 2.686/m²
6088NM Roggel
€ 249.000 k.k.
€ 2.592/m²
Get free quotes from real estate agents with local market knowledge. Compare more than 40 real estate agents in Roggel.
Selling a home in Roggel? Compare all real estate agents in Roggel or view the top 10 real estate agents in Roggel for extra context for your choice.
Real estate agents make sharper offers when they know you're comparing — ask for quotes for sale or purchase.
Practical answers about housing supply, sales and comparing real estate agents in Roggel.
The costs of a real estate agent in Roggel depend on commission, setup costs, property presentation and the chosen service. Compare the 40 real estate agents in Roggel via the real estate agent page and request multiple quotes to compare rates and approach well.
Within our selection, we are currently showing 63 houses in Roggel. View also the sold houses in Roggel to compare the current offering with recent transactions.
Take into account not only price and living area but also maintenance, energy label, location, outdoor space and sales status. This way you compare houses in Roggel on more than just the asking price.
A local real estate agent knows the neighborhoods, recent transactions and demand in Roggel. By comparing 40 real estate agents in the region you get a better insight into prices, sales strategy and expected yield; the top 10 in Roggel provides a useful starting point.
Yes, when making a sales plan, a valuation in Roggel is wise. You gain insight into a realistic asking price and can then compare offers from real estate agents specifically.
View current location data on residents, WOZ development, housing stock, energy consumption, business activity and safety in Roggel. In 2026 were there 4.194 residents. The average WOZ value in 2025 is EUR 382.000.
These figures help to better assess and compare the housing stock in Roggel with recent sold homes. Orient yourself then on suitable top real estate agents in Roggel for sales advice in this region.
Residents
4.194
Last year: 2026
Average WOZ
EUR 382.000
Last year: 2025
Average income per person.
EUR 35.000
Source: AllNumbers
Crimes (current year)
130
Total registered
| Year | Residents |
|---|---|
| 2021 | 4.290 |
| 2022 | 4.290 |
| 2023 | 4.285 |
| 2024 | 4.275 |
| 2025 | 4.215 |
| 2026 | 4.194 |
| Year | Average WOZ |
|---|---|
| 2021 | EUR 282.000 |
| 2022 | EUR 297.000 |
| 2023 | EUR 350.000 |
| 2024 | EUR 354.000 |
| 2025 | EUR 382.000 |
Hoger
1.100
Praktisch
620
Middelbaar
1.470
Europa
265
Nederland
3.815
Buiten Europa
130
Label A
523
Label C
491
Label B
459
Label D
271
Label G
140
Label F
132
Label E
54
Label A+
21
Label A++++
15
Label A++
9
Label A+++
9
Label A+++++
0
| Year | Gas (m3) | Electricity (kWh) |
|---|---|---|
| 2020 | 1.420 | 3.440 |
| 2021 | 1.580 | 3.490 |
| 2022 | 1.250 | 3.340 |
| 2023 | 1.010 | 3.150 |
| 2024 | 990 | 3.250 |
Hoekwoning
Gas: 920 • Electricity: 2.780
Huurwoning
Gas: 830 • Electricity: 2.230
Koopwoning
Gas: 1.060 • Electricity: 3.390
Appartement
Gas: 600 • Electricity: 1.860
Tussenwoning
Gas: 850 • Electricity: 2.640
Vrijstaande woning
Gas: 1.200 • Electricity: 3.920
Twee-onder-één-kap woning
Gas: 1.050 • Electricity: 2.920
Total number of company establishments: 530
| Period | Crimes |
|---|---|
| jan 2026 | 1 |
| jul 2025 | 14 |
| jun 2025 | 5 |
| mei 2025 | 18 |
| mrt 2025 | 15 |
| mrt 2026 | 3 |
| nov 2024 | 13 |
| nov 2025 | 10 |
| okt 2024 | 7 |
| okt 2025 | 3 |
| sep 2024 | 8 |
| sep 2025 | 12 |
These figures give an indicative picture of safety trends in the living environment of Roggel.
Short answers based on current local statistics, handy for a quick comparison of the living environment.
Roggel telt in 2026 ongeveer 4.194 inwoners.
De gemiddelde WOZ-waarde in Roggel is in 2025 circa € 382.000.
Het gemiddelde inkomen per inwoner in Roggel ligt rond € 35.000 per jaar.
Voor het huidige jaar gaat het om ongeveer 130 geregistreerde misdrijven. Gebruik deze cijfers als indicatie en vergelijk trends per periode.
In Roggel komt vooral "Vrijstaande woningen" veel voor, met ongeveer 816 woningen.