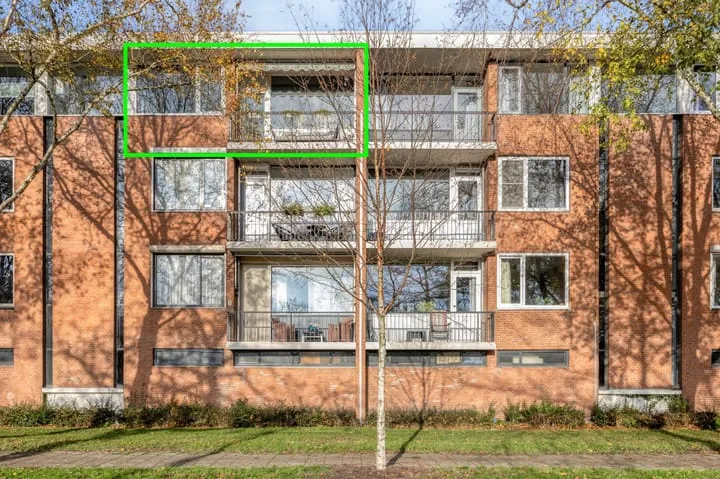
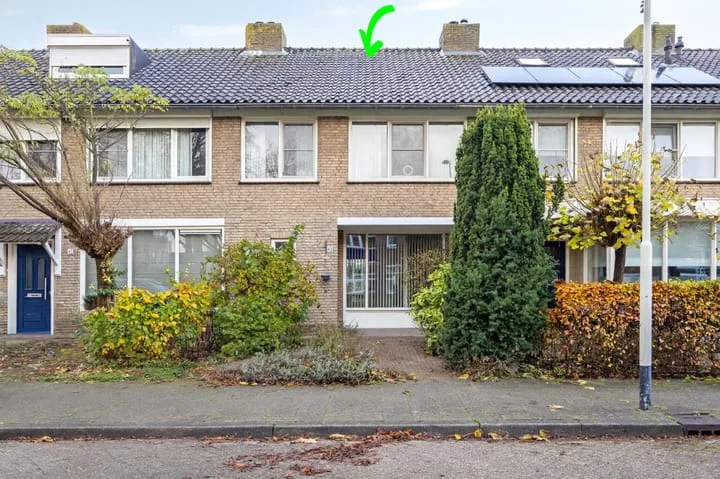
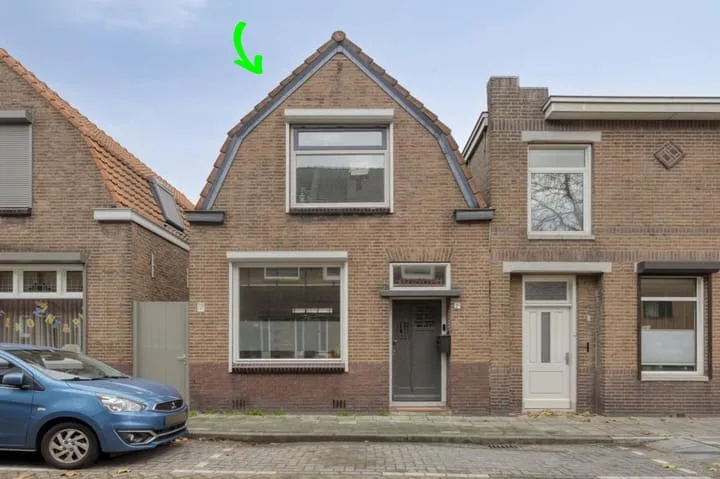
- Sold
Boomgaardstraat 3 b
4701HE Roosendaal
€ 300.000 k.k.
€ 3.614/m²
- Living area
- 83 m²
- Land area
- 96 m²
- Bedrooms
- 2
View 558 sold houses in Roosendaal
Type to search. Use arrow down and arrow up to navigate through results and press Enter to open.
Hidden search suggestions.
Compare sold homes in Roosendaal or view the current offering in this location directly.
On this page you will find recently sold homes in Roosendaal. Use this overview to better estimate selling prices, popular neighborhoods, and the local housing supply before you choose a real estate agent. Also view the current housing supply with 781 houses in Roosendaal.
4701HE Roosendaal
€ 300.000 k.k.
€ 3.614/m²
4702KB Roosendaal
€ 270.000 k.k.
€ 3.750/m²
4701HB Roosendaal
€ 250.000 k.k.
€ 5.434/m²
4701GP Roosendaal
€ 259.000 k.k.
€ 5.078/m²
4707EX Roosendaal
Price upon request
4707NH Roosendaal
€ 320.000 k.k.
€ 3.764/m²
4708ND Roosendaal
€ 350.000 k.k.
€ 4.117/m²
4703JL Roosendaal
€ 319.000 k.k.
€ 2.572/m²
4708ES Roosendaal
€ 339.500 k.k.
€ 3.429/m²
4701LJ Roosendaal
€ 159.000 k.k.
€ 4.542/m²
4707CR Roosendaal
€ 299.500 k.k.
€ 3.565/m²
4708MJ Roosendaal
€ 649.500 k.k.
€ 3.889/m²
4703LB Roosendaal
€ 329.000 k.k.
€ 3.916/m²
4707RZ Roosendaal
€ 339.500 k.k.
€ 3.296/m²
4708NM Roosendaal
Price upon request
4708KT Roosendaal
Price upon request
4701CZ Roosendaal
€ 275.000 k.k.
€ 3.160/m²
4701EW Roosendaal
€ 340.000 k.k.
€ 3.063/m²
4701KG Roosendaal
€ 325.000 k.k.
€ 4.062/m²
4701EE Roosendaal
€ 212.000 k.k.
€ 4.930/m²
4708MN Roosendaal
€ 390.000 k.k.
€ 3.979/m²
4707RE Roosendaal
€ 495.000 k.k.
€ 4.194/m²
4706TN Roosendaal
€ 276.250 k.k.
€ 2.630/m²
4707GA Roosendaal
Price upon request
4707BB Roosendaal
€ 289.000 k.k.
€ 2.726/m²
4703ES Roosendaal
€ 219.000 k.k.
€ 2.959/m²
4701BX Roosendaal
€ 350.000 k.k.
€ 3.431/m²
4708BD Roosendaal
€ 389.500 k.k.
€ 4.015/m²
Get free quotes from realtors with local market knowledge in Roosendaal.
Selling a home in Roosendaal? Compare real estate agents who know the local housing market. Also check out all real estate agents in Roosendaal or the top 10 real estate agents in Roosendaal for extra context for your choice.
By comparing brokers and requesting quotes
Short answers about housing prices, sold homes and comparing real estate agents in Roosendaal.
The costs of a real estate agent in Roosendaal vary per office, property type and sales approach. Therefore, compare multiple quotes and also look at the real estate agents in Roosendaal to better compare rates, presentation and local experience.
On this page we currently show 558 sold houses in Roosendaal from our selection. This helps you to better assess recent transactions and the local housing market.
Houses sold in Roosendaal give insight into asking prices, house types and neighborhoods where recent transactions have taken place. Compare this also with the current housing stock in Roosendaal to better understand the market.
You can use sold homes as a first market indication, but a local real estate agent can better take into account finishing, location, maintenance and current demand in Roosendaal.
Compare realtors in Roosendaal on local sales experience, reviews, expected yield, commission and marketing approach. The top 10 realtors in Roosendaal helps to quickly discover strong offices.
View current location data on residents, WOZ development, housing stock, energy consumption, business activity and safety in Roosendaal. In 2025 were there 67.370 residents. The average WOZ value in 2025 is EUR 308.856.
These figures help to better assess and compare the housing stock in Roosendaal with recent sold homes. Orient yourself then on suitable top real estate agents in Roosendaal for sales advice in this region.
Residents
67.370
Last year: 2025
Average WOZ
EUR 308.856
Last year: 2025
Average income per person.
EUR 32.319
Source: AllNumbers
Crimes (current year)
3.924
Total registered
| Year | Residents |
|---|---|
| 2021 | 67.025 |
| 2022 | 67.000 |
| 2023 | 67.320 |
| 2024 | 67.235 |
| 2025 | 67.370 |
| Year | Average WOZ |
|---|---|
| 2021 | EUR 229.405 |
| 2022 | EUR 247.844 |
| 2023 | EUR 278.679 |
| 2024 | EUR 285.790 |
| 2025 | EUR 308.856 |
Hoger
13.720
Praktisch
15.300
Middelbaar
21.230
Europa
8.305
Nederland
45.380
Buiten Europa
13.685
Label C
9.297
Label A
6.760
Label B
5.831
Label D
3.028
Label G
2.019
Label E
2.016
Label F
1.491
Label A+
1.007
Label A++
484
Label A+++
378
Label A++++
183
Label A+++++
10
| Year | Gas (m3) | Electricity (kWh) |
|---|---|---|
| 2020 | 1.149 | 2.756 |
| 2021 | 1.287 | 2.777 |
| 2022 | 1.007 | 2.619 |
| 2023 | 870 | 2.482 |
| 2024 | 854 | 2.532 |
Hoekwoning
Gas: 999 • Electricity: 2.661
Huurwoning
Gas: 724 • Electricity: 1.964
Koopwoning
Gas: 973 • Electricity: 2.814
Appartement
Gas: 496 • Electricity: 1.732
Tussenwoning
Gas: 868 • Electricity: 2.461
Vrijstaande woning
Gas: 1.412 • Electricity: 3.648
Twee-onder-één-kap woning
Gas: 1.146 • Electricity: 2.964
Total number of company establishments: 8.175
| Period | Crimes |
|---|---|
| jan 2026 | 300 |
| jul 2025 | 315 |
| jun 2025 | 312 |
| mei 2025 | 297 |
| mrt 2025 | 342 |
| mrt 2026 | 339 |
| nov 2024 | 335 |
| nov 2025 | 394 |
| okt 2024 | 336 |
| okt 2025 | 364 |
| sep 2024 | 306 |
| sep 2025 | 279 |
These figures give an indicative picture of safety trends in the living environment of Roosendaal.
Short answers based on current local statistics, handy for a quick comparison of the living environment.
Roosendaal telt in 2025 ongeveer 67.370 inwoners.
De gemiddelde WOZ-waarde in Roosendaal is in 2025 circa € 308.856.
Het gemiddelde inkomen per inwoner in Roosendaal ligt rond € 32.319 per jaar.
Voor het huidige jaar gaat het om ongeveer 3.924 geregistreerde misdrijven. Gebruik deze cijfers als indicatie en vergelijk trends per periode.
In Roosendaal komt vooral "Tussenwoningen" veel voor, met ongeveer 12.036 woningen.