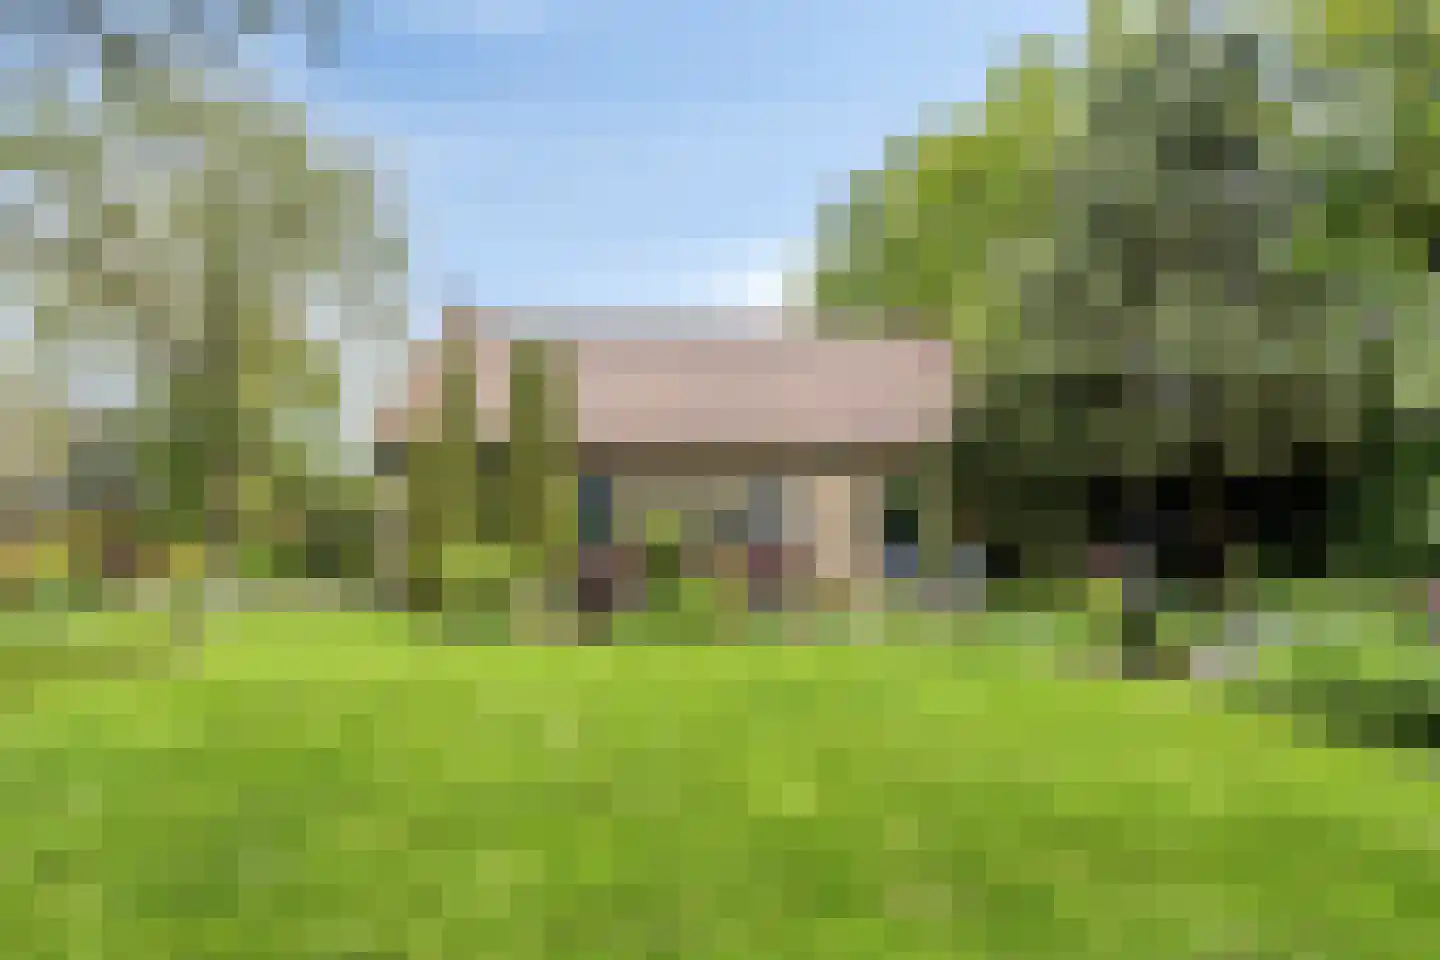
- Available
Rijksweg 63
1751EE Schagerbrug
€ 315.000 k.k.
€ 3.424/m²
- Living area
- 92 m²
- Land area
- 250 m²
- Bedrooms
- 3
Searching in 22 houses in Schagerbrug
Type to search. Use arrow down and arrow up to navigate through results and press Enter to open.
Hidden search suggestions.
View current properties in Schagerbrug or search targeted on street, postal code and property characteristics.
View the current housing stock in Schagerbrug and quickly filter by price, living area, rooms and more. There are currently 22 houses in this place within our selection. View also 14 sold houses in Schagerbrug for extra insight into the local housing market.
1751EE Schagerbrug
€ 315.000 k.k.
€ 3.424/m²
1751DD Schagerbrug
€ 950.000 k.k.
€ 6.463/m²
1751GJ Schagerbrug
€ 650.000 k.k.
1751KA Schagerbrug
€ 869.000 k.k.
€ 4.994/m²
1751CA Schagerbrug
€ 499.000 k.k.
€ 3.283/m²
1751PG Schagerbrug
€ 575.000 k.k.
1751HG Schagerbrug
€ 725.000 k.k.
€ 4.119/m²
1751CJ Schagerbrug
€ 375.000 k.k.
€ 5.137/m²
1751PK Schagerbrug
€ 689.500 k.k.
€ 3.591/m²
1751CM Schagerbrug
€ 445.000 k.k.
€ 4.045/m²
1751KE Schagerbrug
€ 925.000 k.k.
€ 4.946/m²
1751PK Schagerbrug
€ 795.000 k.k.
€ 3.732/m²
1751CH Schagerbrug
€ 295.000 k.k.
€ 3.881/m²
1751PL Schagerbrug
€ 649.000 k.k.
€ 3.933/m²
1751CL Schagerbrug
€ 650.000 k.k.
€ 4.113/m²
1751CE Schagerbrug
€ 375.000 k.k.
€ 3.099/m²
1751KC Schagerbrug
€ 295.000 k.k.
€ 4.682/m²
1751PH Schagerbrug
€ 399.000 k.k.
€ 4.433/m²
1751CM Schagerbrug
€ 449.000 k.k.
€ 0/m²
1751DG Schagerbrug
€ 595.000 k.k.
€ 2.819/m²
1751DH Schagerbrug
€ 725.000 k.k.
€ 3.737/m²
1751LD Schagerbrug
€ 745.000 k.k.
€ 7.525/m²
Get free quotes from real estate agents with local market knowledge. Compare more than 15 real estate agents in Schagerbrug.
Selling a home in Schagerbrug? Compare all real estate agents in Schagerbrug or view the top 10 real estate agents in Schagerbrug for extra context for your choice.
Real estate agents make sharper offers when they know you're comparing — ask for quotes for sale or purchase.
Practical answers about housing supply, sales and comparing real estate agents in Schagerbrug.
The costs of a real estate agent in Schagerbrug depend on commission, setup costs, property presentation and the chosen service. Compare the 15 real estate agents in Schagerbrug via the real estate agent page and request multiple quotes to compare rates and approach well.
Within our selection, we are currently showing 22 houses in Schagerbrug. View also the sold houses in Schagerbrug to compare the current offering with recent transactions.
Take into account not only price and living area but also maintenance, energy label, location, outdoor space and sales status. This way you compare houses in Schagerbrug on more than just the asking price.
A local real estate agent knows the neighborhoods, recent transactions and demand in Schagerbrug. By comparing 15 real estate agents in the region you get a better insight into prices, sales strategy and expected yield; the top 10 in Schagerbrug provides a useful starting point.
Yes, when making a sales plan, a valuation in Schagerbrug is wise. You gain insight into a realistic asking price and can then compare offers from real estate agents specifically.
View current location data on residents, WOZ development, housing stock, energy consumption, business activity and safety in Schagerbrug. In 2025 were there 2.220 residents. The average WOZ value in 2025 is EUR 362.000.
These figures help to better assess and compare the housing stock in Schagerbrug with recent sold homes. Orient yourself then on suitable top real estate agents in Schagerbrug for sales advice in this region.
Residents
2.220
Last year: 2025
Average WOZ
EUR 362.000
Last year: 2025
Average income per person.
EUR 32.900
Source: AllNumbers
Crimes (current year)
69
Total registered
| Year | Residents |
|---|---|
| 2021 | 2.100 |
| 2022 | 2.090 |
| 2023 | 2.105 |
| 2024 | 2.120 |
| 2025 | 2.220 |
| Year | Average WOZ |
|---|---|
| 2021 | EUR 292.000 |
| 2022 | EUR 317.000 |
| 2023 | EUR 347.000 |
| 2024 | EUR 352.000 |
| 2025 | EUR 362.000 |
Hoger
500
Praktisch
360
Middelbaar
780
Europa
145
Nederland
1.925
Buiten Europa
150
Label A
233
Label C
164
Label G
159
Label B
154
Label A+++
76
Label D
72
Label F
52
Label E
28
Label A++
21
Label A++++
20
Label A+
4
Label A+++++
0
| Year | Gas (m3) | Electricity (kWh) |
|---|---|---|
| 2020 | 1.480 | 3.320 |
| 2021 | 1.650 | 3.360 |
| 2022 | 1.250 | 3.080 |
| 2023 | 1.070 | 2.950 |
| 2024 | 1.010 | 3.060 |
Hoekwoning
Gas: 920 • Electricity: 2.240
Huurwoning
Gas: 780 • Electricity: 2.020
Koopwoning
Gas: 1.180 • Electricity: 3.300
Appartement
Gas: 720 • Electricity: 1.770
Tussenwoning
Gas: 830 • Electricity: 2.330
Vrijstaande woning
Gas: 1.310 • Electricity: 3.680
Twee-onder-één-kap woning
Gas: 1.000 • Electricity: 2.830
Total number of company establishments: 340
| Period | Crimes |
|---|---|
| jan 2025 | 9 |
| jan 2026 | 3 |
| jul 2025 | 8 |
| jun 2025 | 10 |
| mei 2025 | 2 |
| mrt 2025 | 8 |
| nov 2024 | 1 |
| nov 2025 | 5 |
| okt 2024 | 5 |
| okt 2025 | 2 |
| sep 2024 | 5 |
| sep 2025 | 3 |
These figures give an indicative picture of safety trends in the living environment of Schagerbrug.
Short answers based on current local statistics, handy for a quick comparison of the living environment.
Schagerbrug telt in 2025 ongeveer 2.220 inwoners.
De gemiddelde WOZ-waarde in Schagerbrug is in 2025 circa € 362.000.
Het gemiddelde inkomen per inwoner in Schagerbrug ligt rond € 32.900 per jaar.
Voor het huidige jaar gaat het om ongeveer 69 geregistreerde misdrijven. Gebruik deze cijfers als indicatie en vergelijk trends per periode.
In Schagerbrug komt vooral "Vrijstaande woningen" veel voor, met ongeveer 416 woningen.