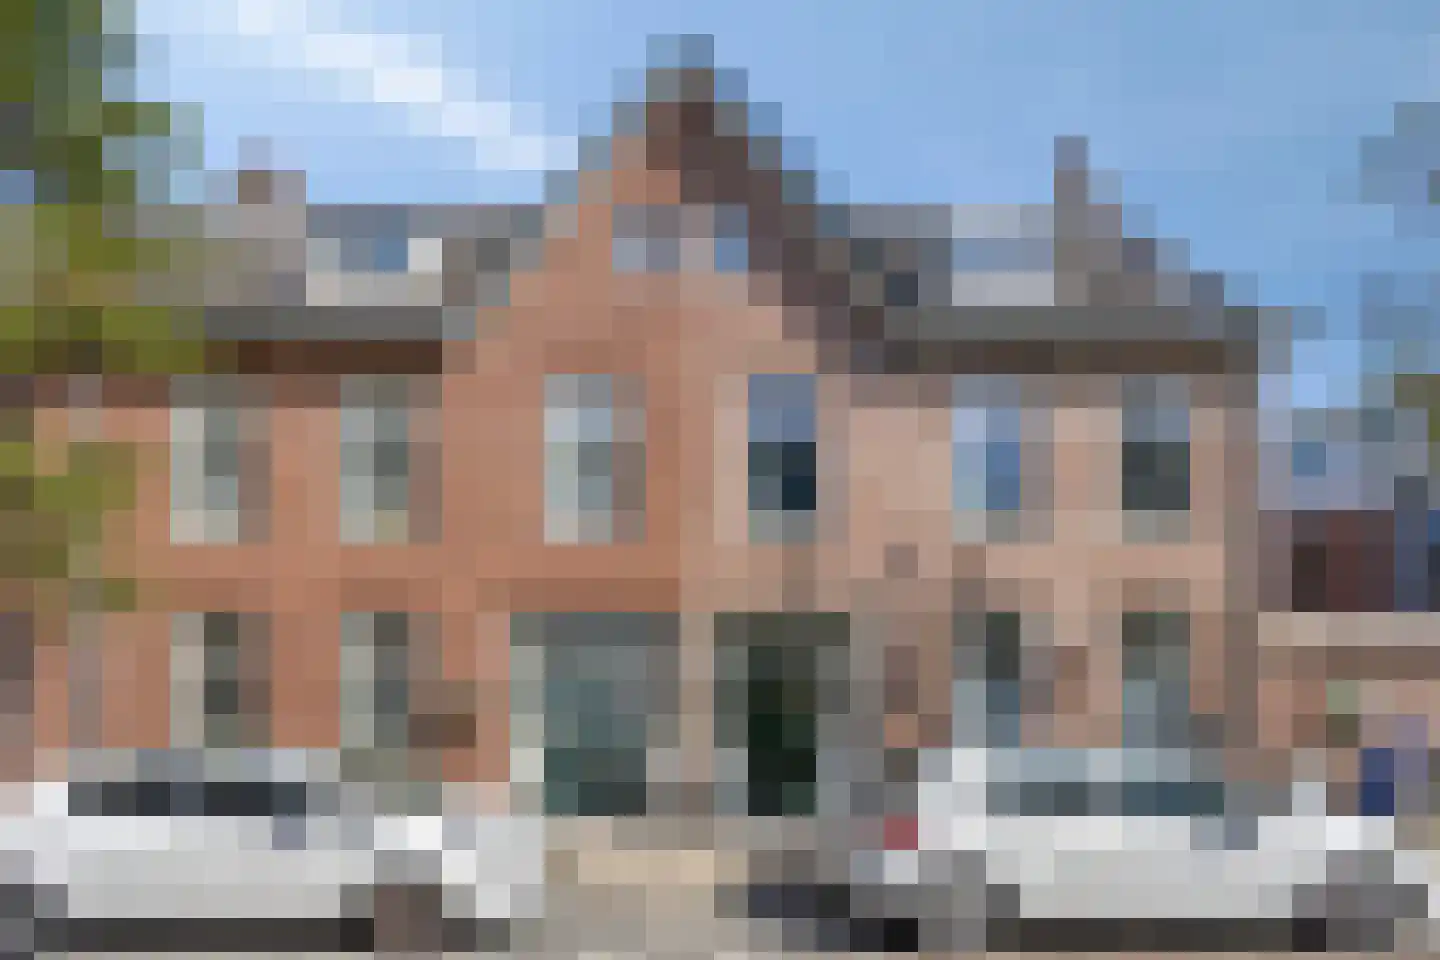
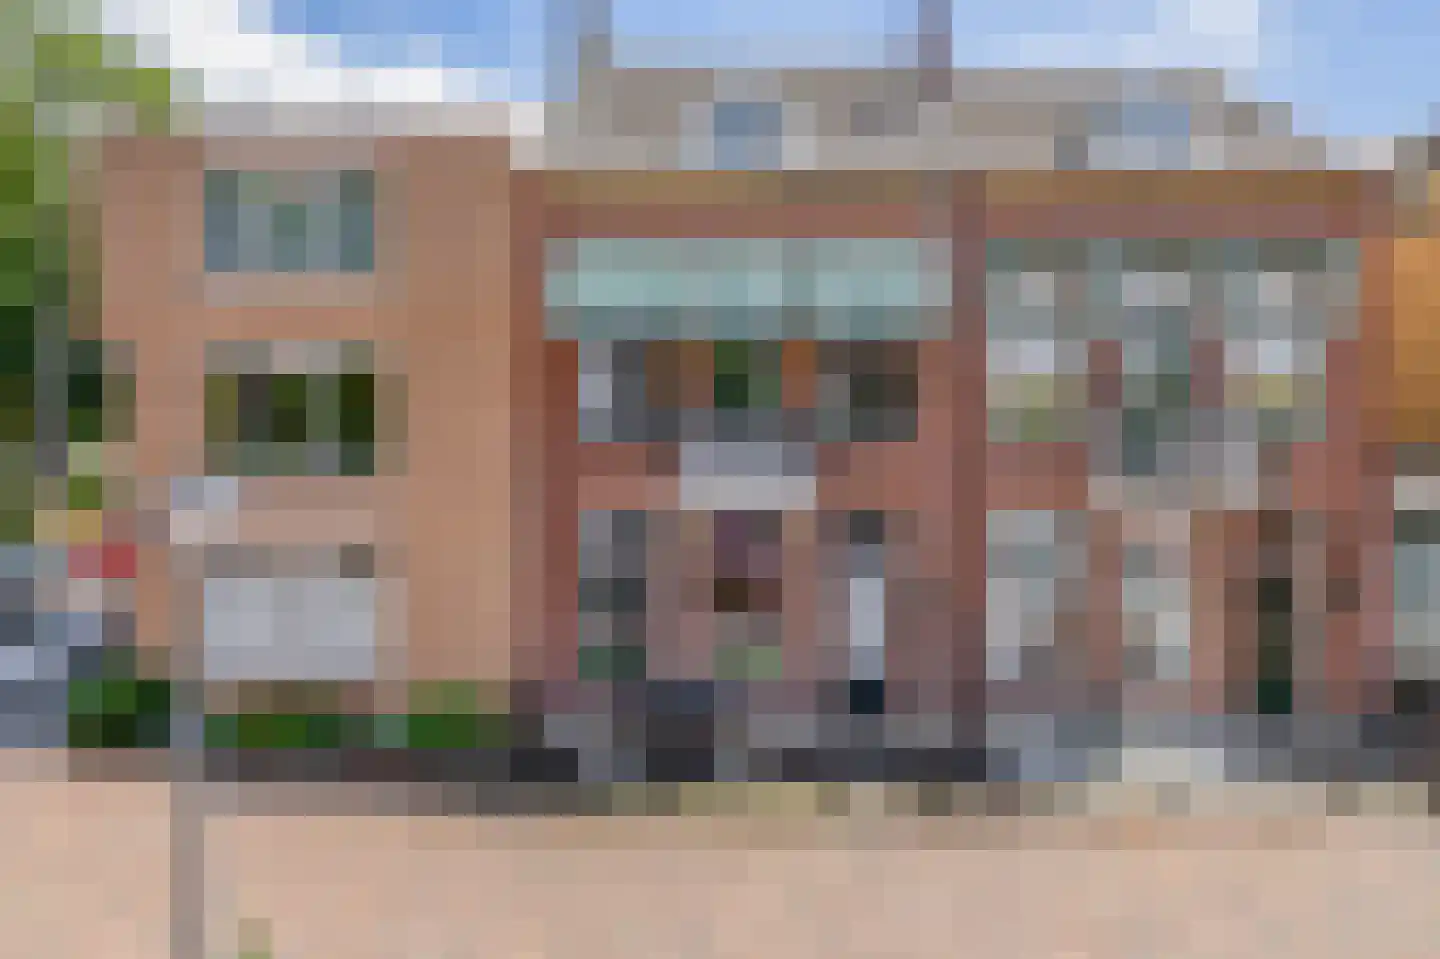
- Sold
Basilicumveld 11
3124CA Schiedam
€ 575.000 k.k.
€ 3.782/m²
- Living area
- 152 m²
- Land area
- 197 m²
- Bedrooms
- 5
View 766 sold houses in Schiedam
Type to search. Use arrow down and arrow up to navigate through results and press Enter to open.
Hidden search suggestions.
Compare sold homes in Schiedam or view the current offering in this location directly.
On this page you will find recently sold homes in Schiedam. Use this overview to better estimate selling prices, popular neighborhoods, and the local housing supply before you choose a real estate agent. Also view the current housing supply with 1.194 houses in Schiedam.
3124CA Schiedam
€ 575.000 k.k.
€ 3.782/m²
3123NL Schiedam
€ 300.000 k.k.
€ 3.703/m²
3117PZ Schiedam
€ 525.000 k.k.
€ 3.281/m²
3111AA Schiedam
€ 300.000 k.k.
€ 4.347/m²
3114XZ Schiedam
€ 385.000 k.k.
€ 3.468/m²
3124BA Schiedam
€ 645.000 k.k.
€ 4.673/m²
3111AD Schiedam
€ 239.500 k.k.
€ 4.696/m²
3114NL Schiedam
€ 250.000 k.k.
€ 3.333/m²
3117PH Schiedam
€ 449.000 k.k.
€ 3.096/m²
3119NC Schiedam
€ 285.000 k.k.
€ 3.653/m²
3124XH Schiedam
€ 389.000 k.k.
€ 4.228/m²
3114XV Schiedam
€ 295.000 k.k.
€ 4.469/m²
3111CC Schiedam
€ 375.000 k.k.
€ 4.870/m²
3124KE Schiedam
€ 850.000 k.k.
€ 6.439/m²
3111BT Schiedam
€ 289.500 k.k.
€ 4.453/m²
3119BA Schiedam
€ 665.000
€ 3.778/m²
3123NE Schiedam
€ 310.000 k.k.
€ 3.827/m²
3114PV Schiedam
€ 209.000 k.k.
€ 3.265/m²
3124CE Schiedam
€ 400.000 k.k.
€ 4.301/m²
3116HS Schiedam
Price upon request
3119VH Schiedam
Price upon request
3118GM Schiedam
€ 200.000 k.k.
€ 3.333/m²
3112GS Schiedam
€ 699.000 k.k.
€ 4.481/m²
3117PG Schiedam
€ 225.000 k.k.
€ 4.591/m²
3118AC Schiedam
€ 370.000 k.k.
€ 3.245/m²
3118BA Schiedam
€ 310.000 k.k.
€ 3.406/m²
3119HA Schiedam
€ 445.000 k.k.
€ 5.493/m²
3117AS Schiedam
€ 325.000 k.k.
€ 2.901/m²
Get free quotes from realtors with local market knowledge in Schiedam.
Selling a home in Schiedam? Compare real estate agents who know the local housing market. Also check out all real estate agents in Schiedam or the top 10 real estate agents in Schiedam for extra context for your choice.
By comparing brokers and requesting quotes
Short answers about housing prices, sold homes and comparing real estate agents in Schiedam.
The costs of a real estate agent in Schiedam vary per office, property type and sales approach. Therefore, compare multiple quotes and also look at the real estate agents in Schiedam to better compare rates, presentation and local experience.
On this page we currently show 766 sold houses in Schiedam from our selection. This helps you to better assess recent transactions and the local housing market.
Houses sold in Schiedam give insight into asking prices, house types and neighborhoods where recent transactions have taken place. Compare this also with the current housing stock in Schiedam to better understand the market.
You can use sold homes as a first market indication, but a local real estate agent can better take into account finishing, location, maintenance and current demand in Schiedam.
Compare realtors in Schiedam on local sales experience, reviews, expected yield, commission and marketing approach. The top 10 realtors in Schiedam helps to quickly discover strong offices.
View current location data on residents, WOZ development, housing stock, energy consumption, business activity and safety in Schiedam. In 2026 were there 82.055 residents. The average WOZ value in 2025 is EUR 314.000.
These figures help to better assess and compare the housing stock in Schiedam with recent sold homes. Orient yourself then on suitable top real estate agents in Schiedam for sales advice in this region.
Residents
82.055
Last year: 2026
Average WOZ
EUR 314.000
Last year: 2025
Average income per person.
EUR 32.300
Source: AllNumbers
Crimes (current year)
4.716
Total registered
| Year | Residents |
|---|---|
| 2022 | 79.644 |
| 2023 | 80.628 |
| 2024 | 81.838 |
| 2025 | 82.232 |
| 2026 | 82.055 |
| Year | Average WOZ |
|---|---|
| 2021 | EUR 221.000 |
| 2022 | EUR 250.000 |
| 2023 | EUR 288.000 |
| 2024 | EUR 299.000 |
| 2025 | EUR 314.000 |
Hoger
27
Praktisch
32
Middelbaar
41
Europa
11.801
Nederland
41.898
Buiten Europa
28.533
Label C
9.449
Label A
7.064
Label B
5.330
Label E
4.947
Label G
4.522
Label D
3.690
Label F
3.086
Label A+++
600
Label A+
532
Label A++
371
Label A++++
125
Label A+++++
5
| Year | Gas (m3) | Electricity (kWh) |
|---|---|---|
| 2020 | 960 | 2.490 |
| 2021 | 1.090 | 2.530 |
| 2022 | 840 | 2.380 |
| 2023 | 750 | 2.270 |
| 2024 | 730 | 2.330 |
Hoekwoning
Gas: 930 • Electricity: 2.960
Huurwoning
Gas: 700 • Electricity: 1.950
Koopwoning
Gas: 790 • Electricity: 2.600
Appartement
Gas: 690 • Electricity: 2.000
Tussenwoning
Gas: 810 • Electricity: 2.710
Vrijstaande woning
Gas: 1.380 • Electricity: 4.140
Twee-onder-één-kap woning
Gas: 1.140 • Electricity: 3.420
Total number of company establishments: 11.730
| Period | Crimes |
|---|---|
| jan 2025 | 394 |
| jan 2026 | 371 |
| jul 2025 | 449 |
| jun 2025 | 383 |
| mei 2025 | 392 |
| mrt 2025 | 384 |
| nov 2024 | 400 |
| nov 2025 | 361 |
| okt 2024 | 458 |
| okt 2025 | 419 |
| sep 2024 | 448 |
| sep 2025 | 380 |
These figures give an indicative picture of safety trends in the living environment of Schiedam.
Short answers based on current local statistics, handy for a quick comparison of the living environment.
Schiedam telt in 2026 ongeveer 82.055 inwoners.
De gemiddelde WOZ-waarde in Schiedam is in 2025 circa € 314.000.
Het gemiddelde inkomen per inwoner in Schiedam ligt rond € 32.300 per jaar.
Voor het huidige jaar gaat het om ongeveer 4.716 geregistreerde misdrijven. Gebruik deze cijfers als indicatie en vergelijk trends per periode.
In Schiedam komt vooral "Appartementen" veel voor, met ongeveer 27.099 woningen.