- Sold
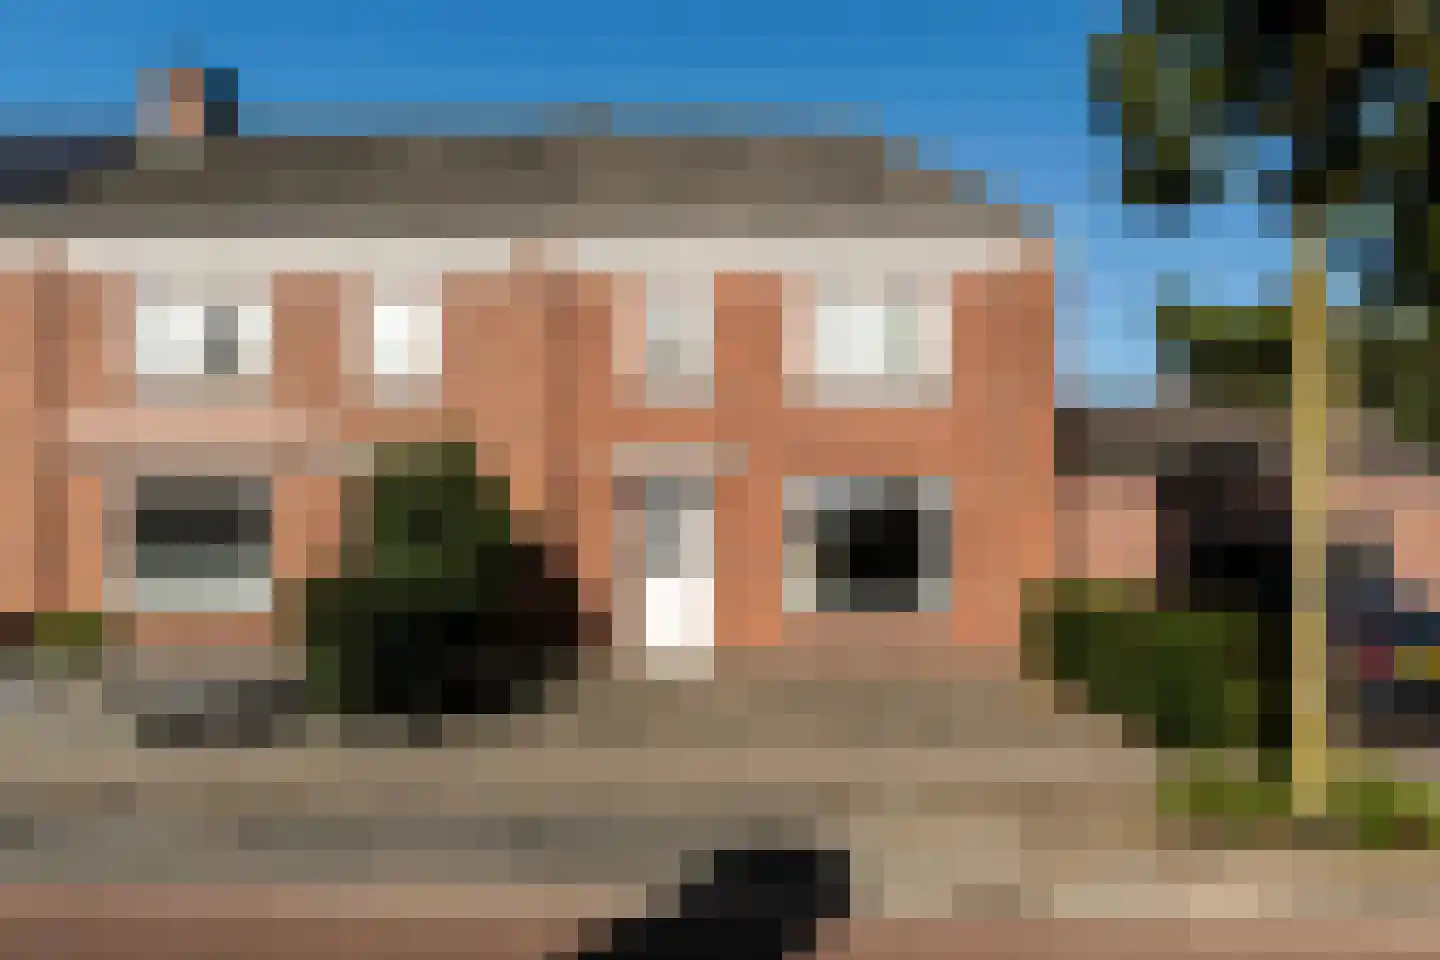
Deken van Dijkstraat 5
5482JX Schijndel
€ 445.000 k.k.
€ 3.449/m²
- Living area
- 129 m²
- Land area
- 164 m²
- Bedrooms
- 4
View 208 sold houses in Schijndel
Type to search. Use arrow down and arrow up to navigate through results and press Enter to open.
Hidden search suggestions.
Compare sold homes in Schijndel or view the current offering in this location directly.
On this page you will find recently sold homes in Schijndel. Use this overview to better estimate selling prices, popular neighborhoods, and the local housing supply before you choose a real estate agent. Also view the current housing supply with 288 houses in Schijndel.
5482JX Schijndel
€ 445.000 k.k.
€ 3.449/m²
5481EB Schijndel
€ 895.000 k.k.
€ 3.960/m²
5481ND Schijndel
€ 415.000 k.k.
€ 4.234/m²
5482CG Schijndel
€ 448.500 k.k.
€ 3.322/m²
5482VJ Schijndel
€ 775.000 k.k.
€ 5.000/m²
5482AM Schijndel
€ 445.000 k.k.
€ 4.238/m²
5482ER Schijndel
€ 615.000 k.k.
€ 4.155/m²
5481BL Schijndel
€ 399.000 k.k.
€ 4.750/m²
5482SB Schijndel
€ 835.000 k.k.
€ 5.964/m²
5481EM Schijndel
€ 365.000 k.k.
€ 4.620/m²
5482LH Schijndel
€ 1.025.000 k.k.
€ 5.256/m²
5481CA Schijndel
€ 475.000 k.k.
€ 5.864/m²
5482HE Schijndel
€ 759.000 k.k.
€ 5.307/m²
5481EH Schijndel
€ 469.000 k.k.
€ 3.065/m²
5482RA Schijndel
Price upon request
5482NE Schijndel
€ 499.000 k.k.
€ 4.056/m²
5481MN Schijndel
€ 525.000 k.k.
€ 4.038/m²
5481LP Schijndel
€ 420.000 k.k.
€ 4.827/m²
5482HH Schijndel
€ 485.000 k.k.
€ 3.514/m²
5481LA Schijndel
€ 599.000 k.k.
€ 3.743/m²
5481AK Schijndel
€ 439.000 k.k.
€ 3.048/m²
5481RB Schijndel
€ 620.000 k.k.
€ 4.000/m²
5482HD Schijndel
€ 495.000 k.k.
€ 5.561/m²
5481BP Schijndel
€ 649.000 k.k.
€ 4.772/m²
5482RB Schijndel
€ 399.000 k.k.
€ 3.990/m²
5482RG Schijndel
€ 428.000 k.k.
€ 4.458/m²
5481XT Schijndel
€ 470.000 k.k.
€ 4.947/m²
5482MS Schijndel
€ 439.000 k.k.
€ 3.689/m²
Get free quotes from realtors with local market knowledge in Schijndel.
Selling a home in Schijndel? Compare real estate agents who know the local housing market. Also check out all real estate agents in Schijndel or the top 10 real estate agents in Schijndel for extra context for your choice.
By comparing brokers and requesting quotes
Short answers about housing prices, sold homes and comparing real estate agents in Schijndel.
The costs of a real estate agent in Schijndel vary per office, property type and sales approach. Therefore, compare multiple quotes and also look at the real estate agents in Schijndel to better compare rates, presentation and local experience.
On this page we currently show 208 sold houses in Schijndel from our selection. This helps you to better assess recent transactions and the local housing market.
Houses sold in Schijndel give insight into asking prices, house types and neighborhoods where recent transactions have taken place. Compare this also with the current housing stock in Schijndel to better understand the market.
You can use sold homes as a first market indication, but a local real estate agent can better take into account finishing, location, maintenance and current demand in Schijndel.
Compare realtors in Schijndel on local sales experience, reviews, expected yield, commission and marketing approach. The top 10 realtors in Schijndel helps to quickly discover strong offices.
View current location data on residents, WOZ development, housing stock, energy consumption, business activity and safety in Schijndel. In 2025 were there 24.055 residents. The average WOZ value in 2025 is EUR 450.000.
These figures help to better assess and compare the housing stock in Schijndel with recent sold homes. Orient yourself then on suitable top real estate agents in Schijndel for sales advice in this region.
Residents
24.055
Last year: 2025
Average WOZ
EUR 450.000
Last year: 2025
Average income per person.
EUR 33.700
Source: AllNumbers
Crimes (current year)
768
Total registered
| Year | Residents |
|---|---|
| 2021 | 23.705 |
| 2022 | 23.825 |
| 2023 | 24.030 |
| 2024 | 24.040 |
| 2025 | 24.055 |
| Year | Average WOZ |
|---|---|
| 2021 | EUR 308.000 |
| 2022 | EUR 343.000 |
| 2023 | EUR 401.000 |
| 2024 | EUR 420.000 |
| 2025 | EUR 450.000 |
Hoger
4.390
Praktisch
5.450
Middelbaar
8.060
Europa
1.420
Nederland
20.835
Buiten Europa
1.800
Label C
3.228
Label A
2.682
Label B
2.086
Label D
1.042
Label F
576
Label E
557
Label G
556
Label A+
275
Label A+++
111
Label A++
108
Label A++++
71
Label A+++++
10
| Year | Gas (m3) | Electricity (kWh) |
|---|---|---|
| 2020 | 1.310 | 3.210 |
| 2021 | 1.460 | 3.250 |
| 2022 | 1.130 | 3.050 |
| 2023 | 950 | 2.870 |
| 2024 | 930 | 2.930 |
Hoekwoning
Gas: 950 • Electricity: 2.700
Huurwoning
Gas: 760 • Electricity: 2.150
Koopwoning
Gas: 1.060 • Electricity: 3.250
Appartement
Gas: 580 • Electricity: 2.060
Tussenwoning
Gas: 850 • Electricity: 2.550
Vrijstaande woning
Gas: 1.400 • Electricity: 4.150
Twee-onder-één-kap woning
Gas: 1.100 • Electricity: 3.220
Total number of company establishments: 3.480
| Period | Crimes |
|---|---|
| jan 2025 | 53 |
| jan 2026 | 51 |
| jul 2025 | 70 |
| jun 2025 | 64 |
| mei 2025 | 58 |
| mrt 2025 | 65 |
| nov 2024 | 54 |
| nov 2025 | 76 |
| okt 2024 | 55 |
| okt 2025 | 55 |
| sep 2024 | 57 |
| sep 2025 | 70 |
These figures give an indicative picture of safety trends in the living environment of Schijndel.
Short answers based on current local statistics, handy for a quick comparison of the living environment.
Schijndel telt in 2025 ongeveer 24.055 inwoners.
De gemiddelde WOZ-waarde in Schijndel is in 2025 circa € 450.000.
Het gemiddelde inkomen per inwoner in Schijndel ligt rond € 33.700 per jaar.
Voor het huidige jaar gaat het om ongeveer 768 geregistreerde misdrijven. Gebruik deze cijfers als indicatie en vergelijk trends per periode.
In Schijndel komt vooral "Tussenwoningen" veel voor, met ongeveer 3.161 woningen.