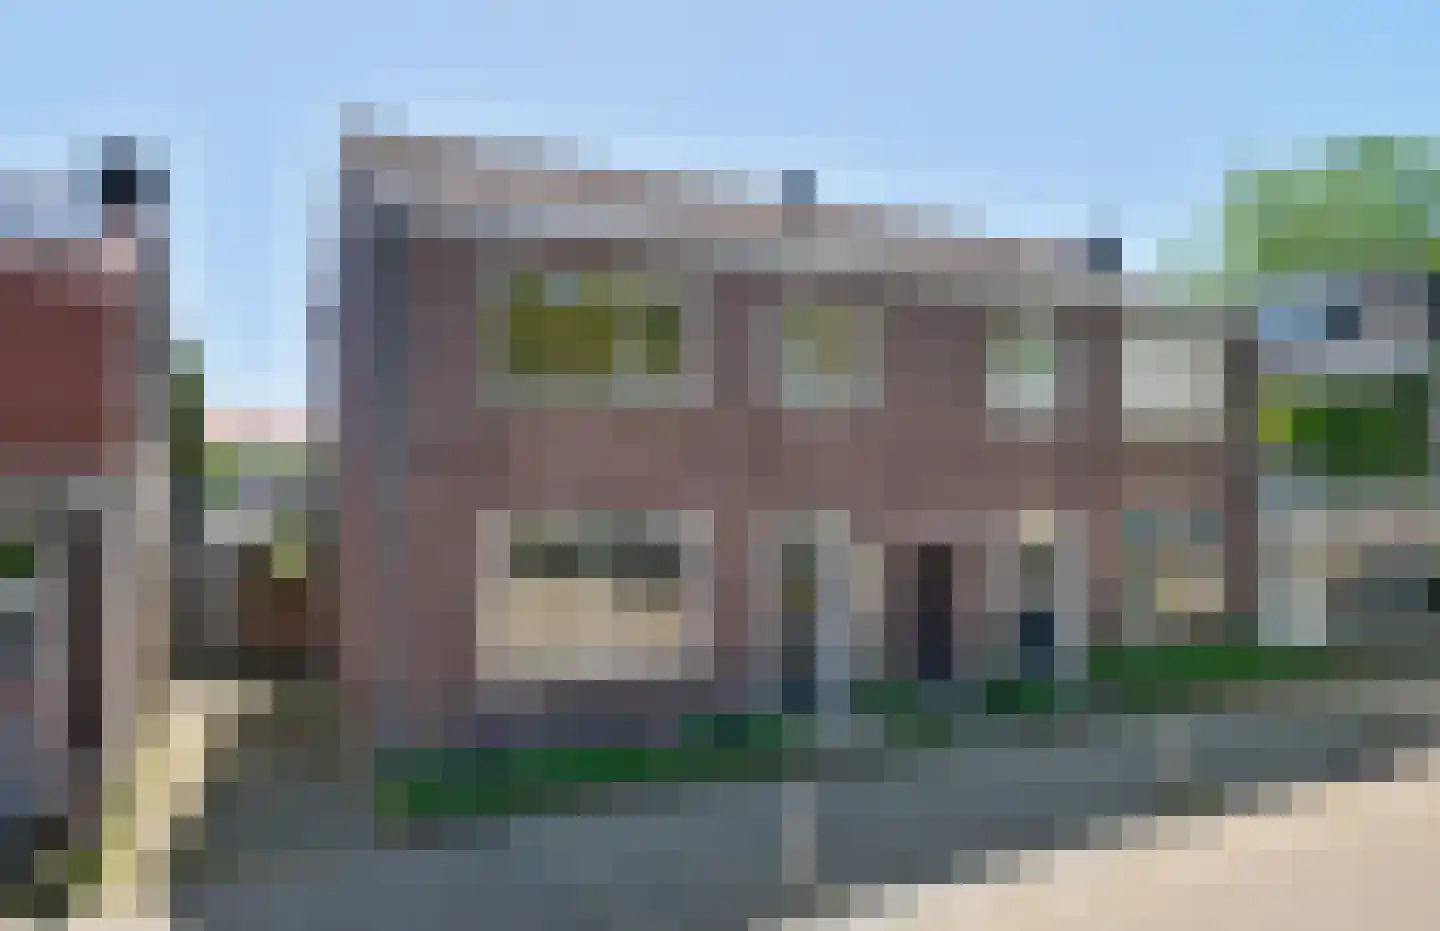
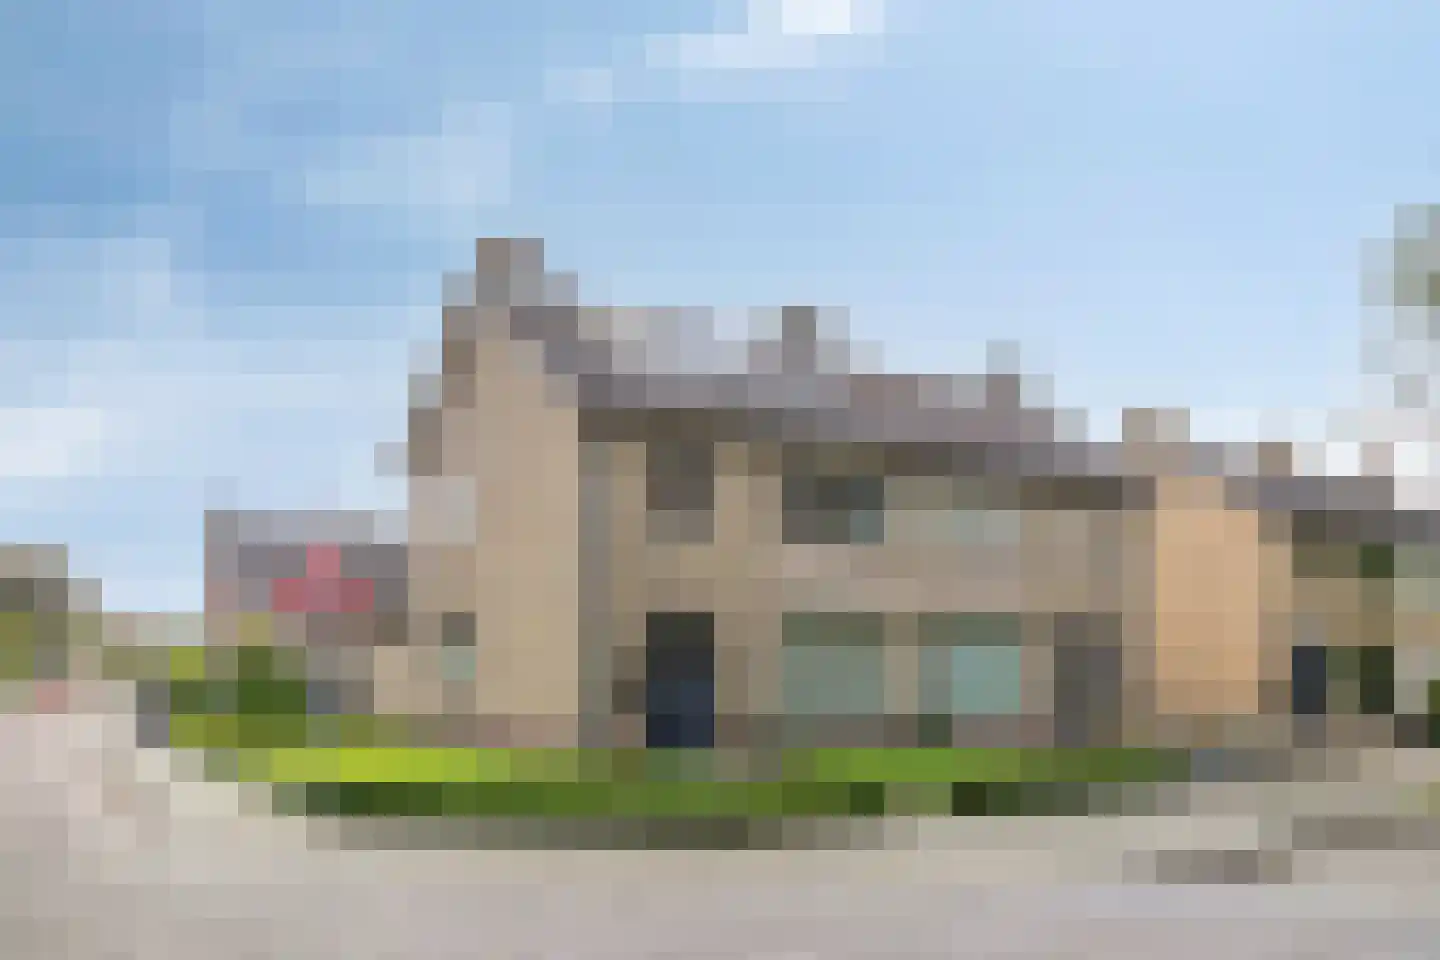
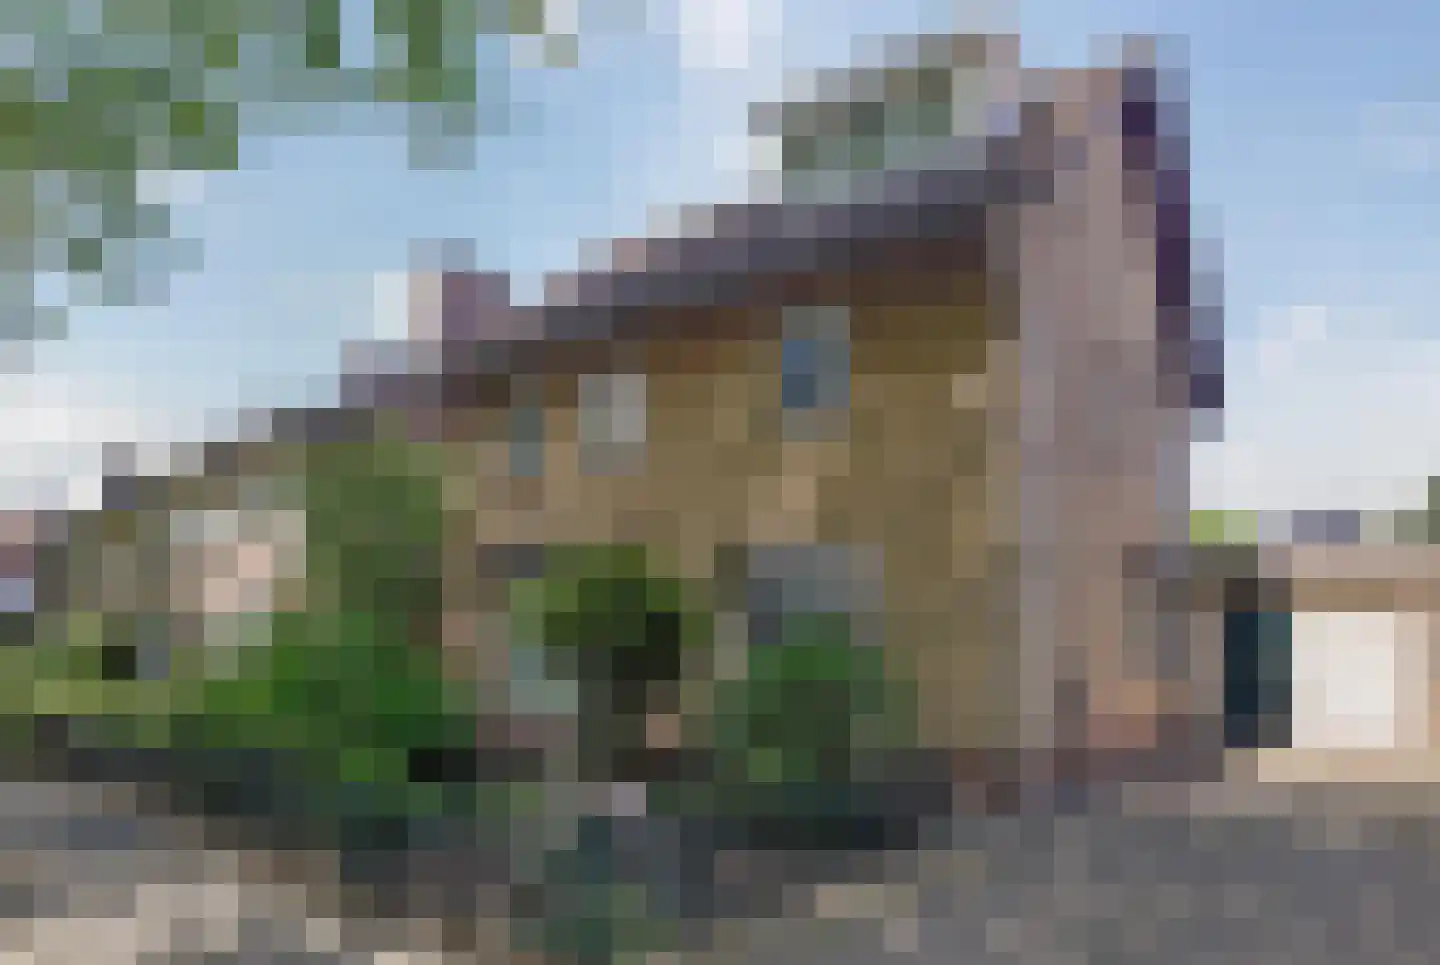
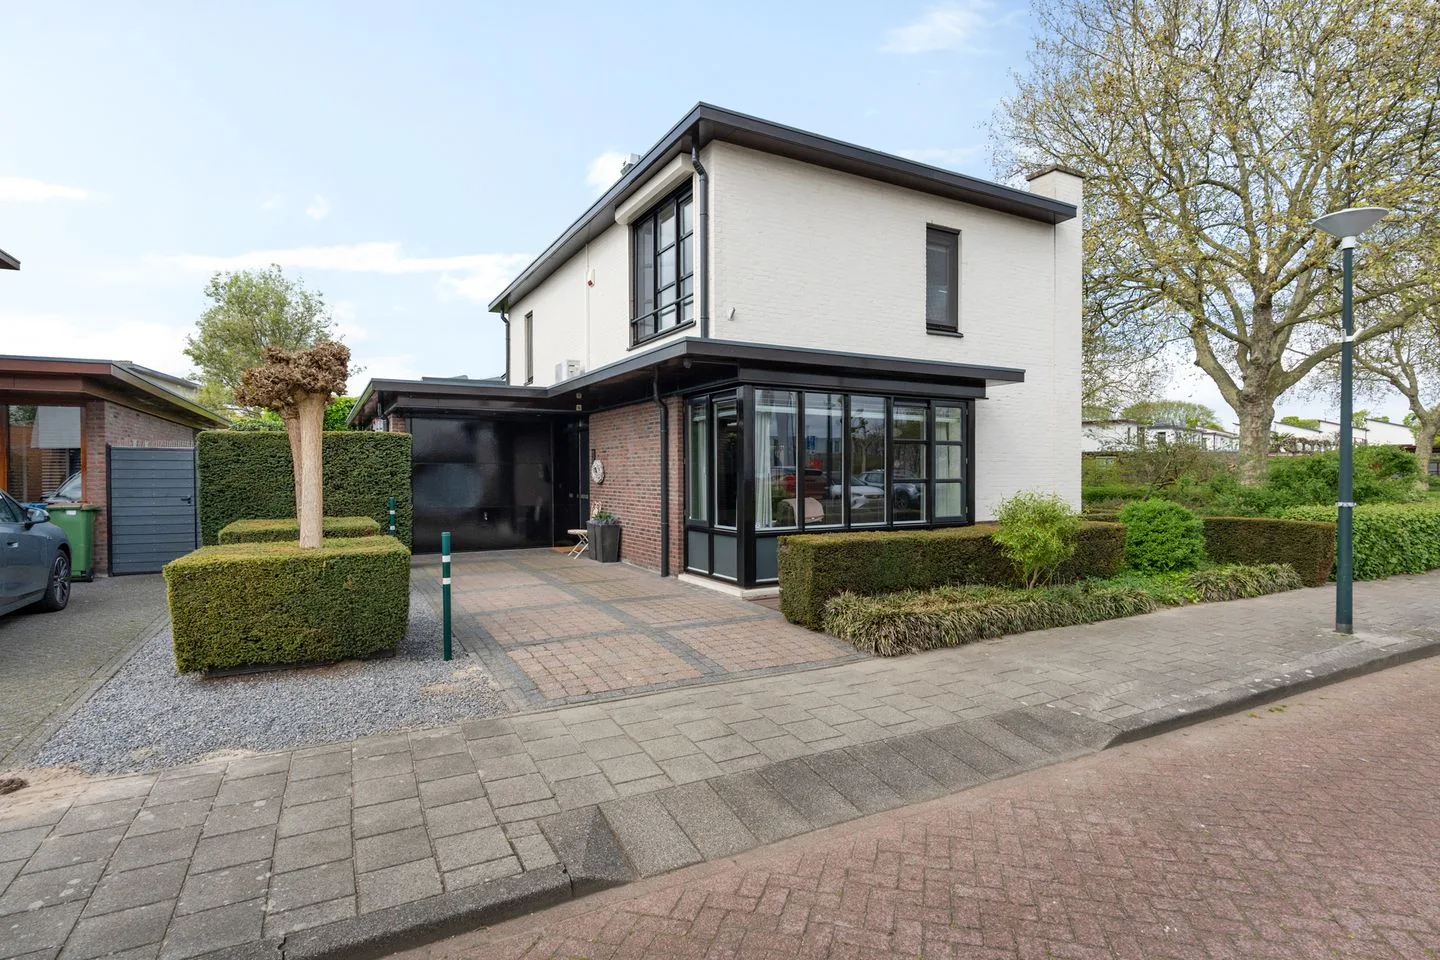
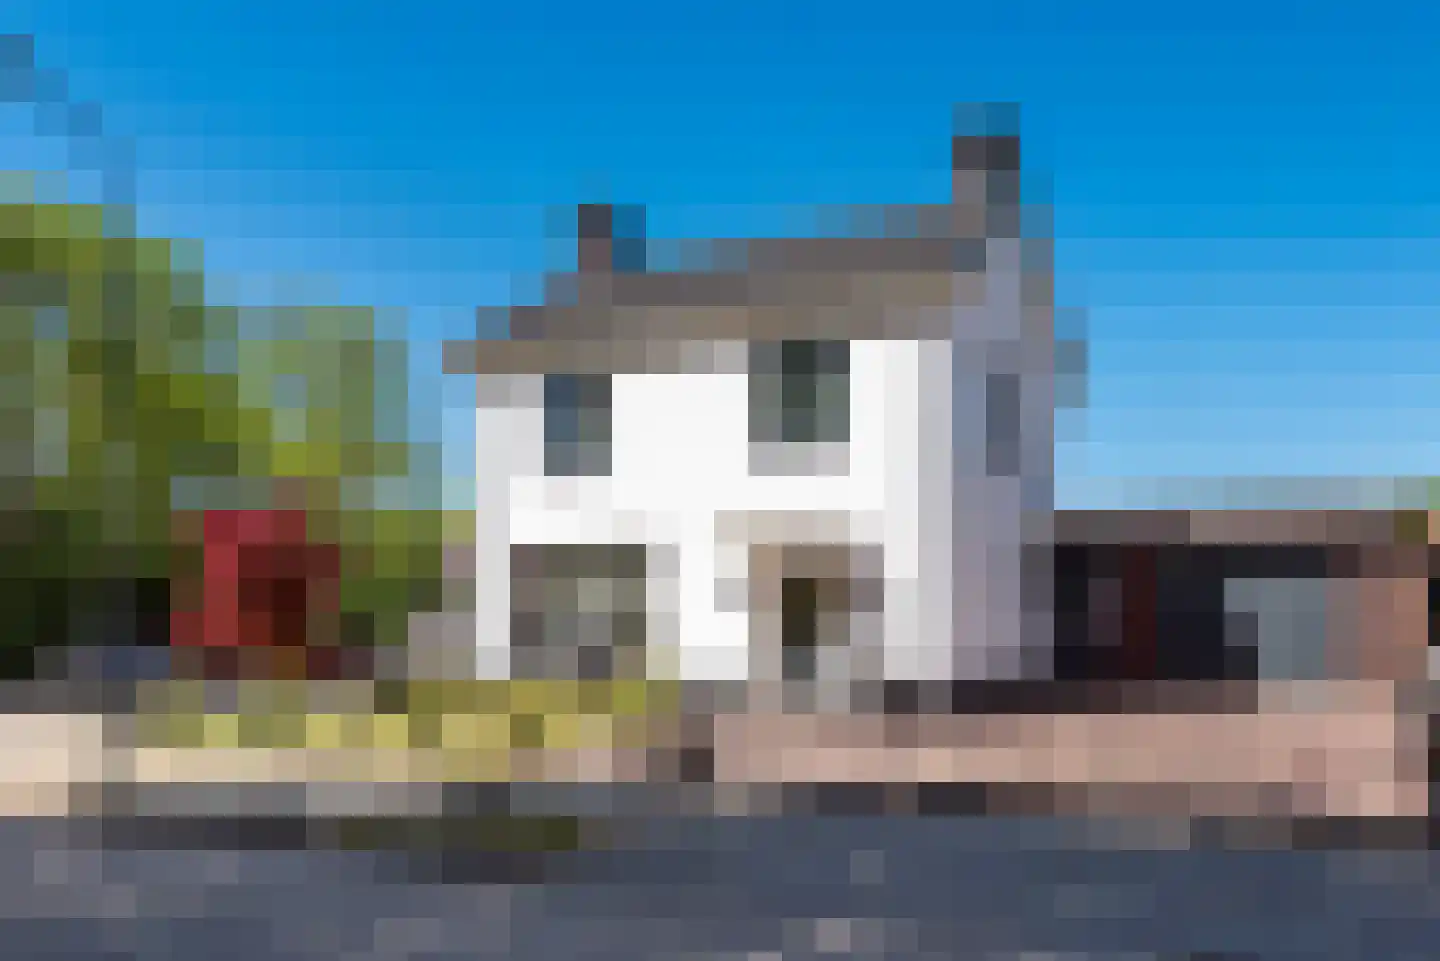
- Available
Emmalaan 42
5482AD Schijndel
€ 470.000 k.k.
€ 4.747/m²
- Living area
- 99 m²
- Land area
- 144 m²
- Bedrooms
- 4
Searching in 289 houses in Schijndel
Type to search. Use arrow down and arrow up to navigate through results and press Enter to open.
Hidden search suggestions.
View current properties in Schijndel or search targeted on street, postal code and property characteristics.
View the current housing stock in Schijndel and quickly filter by price, living area, rooms and more. There are currently 289 houses in this place within our selection. View also 208 sold houses in Schijndel for extra insight into the local housing market.
5482AD Schijndel
€ 470.000 k.k.
€ 4.747/m²
5482GA Schijndel
€ 425.000 k.k.
€ 3.455/m²
5482BG Schijndel
€ 425.000 k.k.
€ 4.167/m²
5482MR Schijndel
€ 375.000 k.k.
€ 3.319/m²
5481ED Schijndel
€ 798.500 k.k.
€ 4.899/m²
5482PW Schijndel
€ 885.000 k.k.
€ 5.057/m²
5481HN Schijndel
€ 560.000 k.k.
€ 4.000/m²
5481HD Schijndel
€ 429.000 k.k.
€ 4.248/m²
5481LR Schijndel
€ 398.000 k.k.
€ 4.914/m²
5482EJ Schijndel
€ 495.000 k.k.
€ 4.231/m²
5482GR Schijndel
€ 639.000 k.k.
€ 4.044/m²
5482EN Schijndel
€ 625.000 k.k.
€ 3.858/m²
5482TX Schijndel
€ 850.000 k.k.
€ 3.991/m²
5481NX Schijndel
€ 430.000 k.k.
€ 4.343/m²
5482XS Schijndel
€ 1.080.000 k.k.
€ 3.956/m²
5482EX Schijndel
€ 685.000 k.k.
€ 3.391/m²
5482JH Schijndel
€ 507.500 k.k.
€ 5.639/m²
5481CN Schijndel
€ 499.500 k.k.
€ 5.808/m²
5481XZ Schijndel
€ 695.000 k.k.
€ 5.890/m²
5482XL Schijndel
€ 475.000 k.k.
€ 3.682/m²
5482MR Schijndel
€ 385.000 k.k.
€ 3.348/m²
5481KH Schijndel
€ 995.000 k.k.
€ 3.980/m²
5482PC Schijndel
€ 579.000 k.k.
€ 3.966/m²
5482SN Schijndel
€ 689.000 k.k.
€ 5.180/m²
5481GC Schijndel
€ 875.000 k.k.
€ 5.208/m²
5481KC Schijndel
€ 899.000 k.k.
5482EJ Schijndel
€ 749.000 k.k.
5482DE Schijndel
€ 845.000 k.k.
Get free quotes from real estate agents with local market knowledge. Compare more than 44 real estate agents in Schijndel.
Selling a home in Schijndel? View the sales-oriented guide sell a house in Schijndel, compare all real estate agents in Schijndel or view the top 10 real estate agents in Schijndel for extra context to your choice.
Real estate agents make sharper offers when they know you're comparing — ask for quotes for sale or purchase.
Practical answers about housing supply, sales and comparing real estate agents in Schijndel.
The costs of a real estate agent in Schijndel depend on commission, setup costs, property presentation and the chosen service. Compare the 44 real estate agents in Schijndel via the real estate agent page and request multiple quotes to compare rates and approach well.
Within our selection, we are currently showing 289 houses in Schijndel. View also the sold houses in Schijndel to compare the current offering with recent transactions.
Take into account not only price and living area but also maintenance, energy label, location, outdoor space and sales status. This way you compare houses in Schijndel on more than just the asking price.
A local real estate agent knows the neighborhoods, recent transactions and demand in Schijndel. By comparing 44 real estate agents in the region you get a better insight into prices, sales strategy and expected yield; the top 10 in Schijndel provides a useful starting point.
Yes, when making a sales plan, a valuation in Schijndel is wise. You gain insight into a realistic asking price and can then compare offers from real estate agents specifically.
View current location data on residents, WOZ development, housing stock, energy consumption, business activity and safety in Schijndel. In 2025 were there 24.055 residents. The average WOZ value in 2025 is EUR 450.000.
These figures help to better assess and compare the housing stock in Schijndel with recent sold homes. Orient yourself then on suitable top real estate agents in Schijndel for sales advice in this region.
Residents
24.055
Last year: 2025
Average WOZ
EUR 450.000
Last year: 2025
Average income per person.
EUR 33.700
Source: AllNumbers
Crimes (current year)
768
Total registered
| Year | Residents |
|---|---|
| 2021 | 23.705 |
| 2022 | 23.825 |
| 2023 | 24.030 |
| 2024 | 24.040 |
| 2025 | 24.055 |
| Year | Average WOZ |
|---|---|
| 2021 | EUR 308.000 |
| 2022 | EUR 343.000 |
| 2023 | EUR 401.000 |
| 2024 | EUR 420.000 |
| 2025 | EUR 450.000 |
Hoger
4.390
Praktisch
5.450
Middelbaar
8.060
Europa
1.420
Nederland
20.835
Buiten Europa
1.800
Label C
3.228
Label A
2.682
Label B
2.086
Label D
1.042
Label F
576
Label E
557
Label G
556
Label A+
275
Label A+++
111
Label A++
108
Label A++++
71
Label A+++++
10
| Year | Gas (m3) | Electricity (kWh) |
|---|---|---|
| 2020 | 1.310 | 3.210 |
| 2021 | 1.460 | 3.250 |
| 2022 | 1.130 | 3.050 |
| 2023 | 950 | 2.870 |
| 2024 | 930 | 2.930 |
Hoekwoning
Gas: 950 • Electricity: 2.700
Huurwoning
Gas: 760 • Electricity: 2.150
Koopwoning
Gas: 1.060 • Electricity: 3.250
Appartement
Gas: 580 • Electricity: 2.060
Tussenwoning
Gas: 850 • Electricity: 2.550
Vrijstaande woning
Gas: 1.400 • Electricity: 4.150
Twee-onder-één-kap woning
Gas: 1.100 • Electricity: 3.220
Total number of company establishments: 3.480
| Period | Crimes |
|---|---|
| jan 2025 | 53 |
| jan 2026 | 51 |
| jul 2025 | 70 |
| jun 2025 | 64 |
| mei 2025 | 58 |
| mrt 2025 | 65 |
| nov 2024 | 54 |
| nov 2025 | 76 |
| okt 2024 | 55 |
| okt 2025 | 55 |
| sep 2024 | 57 |
| sep 2025 | 70 |
These figures give an indicative picture of safety trends in the living environment of Schijndel.
Short answers based on current local statistics, handy for a quick comparison of the living environment.
Schijndel telt in 2025 ongeveer 24.055 inwoners.
De gemiddelde WOZ-waarde in Schijndel is in 2025 circa € 450.000.
Het gemiddelde inkomen per inwoner in Schijndel ligt rond € 33.700 per jaar.
Voor het huidige jaar gaat het om ongeveer 768 geregistreerde misdrijven. Gebruik deze cijfers als indicatie en vergelijk trends per periode.
In Schijndel komt vooral "Tussenwoningen" veel voor, met ongeveer 3.161 woningen.