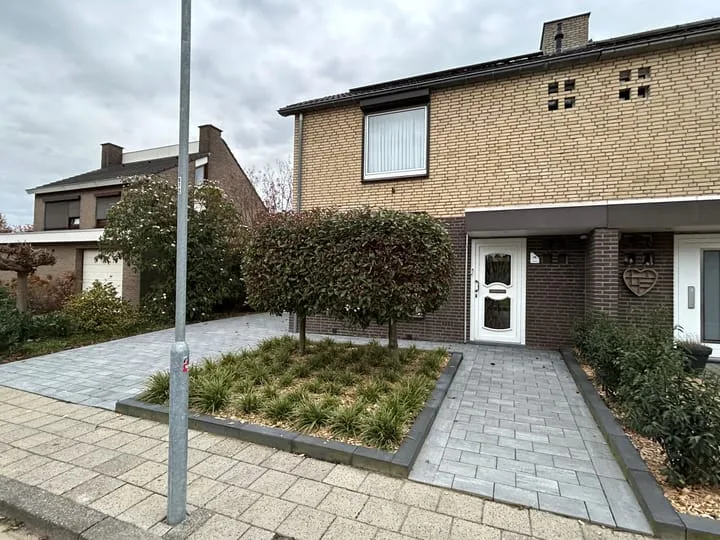
Houses sold in Schinveld

View 33 sold houses in Schinveld

Connected to: Vastgoed Nederland NVM Makelaars

On this page you will find recently sold homes in Schinveld. Use this overview to better estimate selling prices, popular neighborhoods, and the local housing supply before you choose a real estate agent. Also view the current housing supply with 56 houses in Schinveld.

Selection

Search and filter homes

Set your preferences and discover homes that suit you.

Total supply 242.172
Filters

Set price, area and other characteristics. Adjust a filter or click on Show homes. Location changes directly above.

Reset filters

You search for

  • Place Schinveld
  • Status Sold

Huis verkopen in Schinveld? Vergelijk verkoopmakelaars

Bekijk recente verkopen en ontvang gratis offertes van lokale makelaars. Vergelijk meer dan 51 makelaars in Schinveld.

Free request a quote

  • Quotes in Schinveld
  • Non-binding
  • Personal
  • Compare free rates

Zelf je woning verkopen in Schinveld? Vergelijk verkoopmakelaars in Schinveld of bekijk de beste verkoopmakelaars in Schinveld als referentie bij jouw keuze.

Vergelijk meerdere offertes

Makelaars maken scherpere voorstellen als ze weten dat je vergelijkt — vraag offertes aan voor verkoop of aankoop.

Frequently asked questions about sold homes in Schinveld

Short answers about housing prices, sold homes and comparing real estate agents in Schinveld.

Residential and neighborhood statistics in Schinveld

View current location data on residents, WOZ development, housing stock, energy consumption, business activity and safety in Schinveld. In 2026 were there 4.602 residents. The average WOZ value in 2025 is EUR 269.445.

These figures help to better assess and compare the housing stock in Schinveld with recent sold homes. Orient yourself then on suitable top real estate agents in Schinveld for sales advice in this region.

Residents

4.602

Last year: 2026

Average WOZ

EUR 269.445

Last year: 2025

Average income per person.

EUR 30.536

Source: AllNumbers

Crimes (current year)

206

Total registered

Demographics and WOZ development

Inhabitants per year

Inhabitants per year in Schinveld
Year Residents
2021 4.630
2022 4.650
2023 4.705
2024 4.680
2025 4.650
2026 4.602

Annual WOZ value

WOZ value per year in Schinveld
Year Average WOZ
2021 EUR 203.855
2022 EUR 218.727
2023 EUR 249.620
2024 EUR 251.509
2025 EUR 269.445

Composition of residents

Age build-up

65+: 1.230 0-15: 575 15-25: 430 25-45: 1.005 45-65: 1.350

Education level

Hoger

770

Praktisch

1.070

Middelbaar

1.580

Origin of residents (2025)

Europa

800

Nederland

3.545

Buiten Europa

310

Housing stock and construction periods

Types of homes

Hoekwoningen 427
Appartementen 341
Tussenwoningen 607
Vrijstaande woningen 431
Twee-onder-één-kap woningen 486

Construction period of buildings

Voor 1700 0
1700 tot 1900 105
1900 tot 1925 136
1925 tot 1950 314
1950 tot 1970 693
1970 tot 1980 392
1980 tot 1990 267
1990 tot 2000 175
2000 tot 2010 99
2010 tot 2020 31
2020 en later 12

Energy and sustainability

Energy label distribution

Label C

531

Label D

350

Label F

308

Label B

301

Label G

255

Label E

212

Label A

201

Label A+

8

Label A++

3

Label A+++

3

Label A++++

1

Label A+++++

0

Average energy consumption per year

Average energy consumption per year in Schinveld
Year Gas (m3) Electricity (kWh)
2020 1.459 3.114
2021 1.641 3.188
2022 1.277 3.027
2023 1.044 2.952
2024 1.004 3.004

Consumption per house type

Hoekwoning

Gas: 1.028 • Electricity: 2.965

Huurwoning

Gas: 948 • Electricity: 2.328

Koopwoning

Gas: 1.082 • Electricity: 3.211

Appartement

Gas: 763 • Electricity: 1.869

Tussenwoning

Gas: 969 • Electricity: 2.809

Vrijstaande woning

Gas: 1.279 • Electricity: 3.730

Twee-onder-één-kap woning

Gas: 1.067 • Electricity: 2.907

Business activity in Schinveld (2025)

Handel en HORECA 90
Nijverheid en energie 75
Zakelijke dienstverlening 80
Overheid, onderwijs en zorg 80
Landbouw, bosbouw en visserij 5
Vervoer, informatie en communicatie 20
Financiele diensten en onroerendgoed 10
Cultuur, recreatie en overige diensten 70

Total number of company establishments: 440

Recent crime statistics

Recent crime statistics in Schinveld
Period Crimes
jan 2026 13
jul 2025 11
jun 2025 11
mei 2025 21
mrt 2025 17
mrt 2026 11
nov 2024 28
nov 2025 15
okt 2024 13
okt 2025 25
sep 2024 18
sep 2025 17

These figures give an indicative picture of safety trends in the living environment of Schinveld.

Frequently asked questions about living in Schinveld

Short answers based on current local statistics, handy for a quick comparison of the living environment.

Hoeveel inwoners heeft Schinveld?

Schinveld telt in 2026 ongeveer 4.602 inwoners.

Wat is de gemiddelde WOZ-waarde in Schinveld?

De gemiddelde WOZ-waarde in Schinveld is in 2025 circa € 269.445.

Wat is het gemiddelde inkomen per inwoner in Schinveld?

Het gemiddelde inkomen per inwoner in Schinveld ligt rond € 30.536 per jaar.

Hoe veilig is wonen in Schinveld?

Voor het huidige jaar gaat het om ongeveer 206 geregistreerde misdrijven. Gebruik deze cijfers als indicatie en vergelijk trends per periode.

Welke woningtypen komen het meest voor in Schinveld?

In Schinveld komt vooral "Tussenwoningen" veel voor, met ongeveer 607 woningen.

Receive free, non-binding quotes

Compare multiple real estate agents and choose the best match.