Residents
4.351
Last year: 2026
7761PJ Schoonebeek • Drenthe
€ 1.695.000 k.k.
Cost of copper (estimated): € 35.750
2% transfer tax (€ 33.900) + notary (€ 1.150) + valuation (€ 700)
Total incl. VAT: € 1.730.750
Purchase price /m²: € 10.935
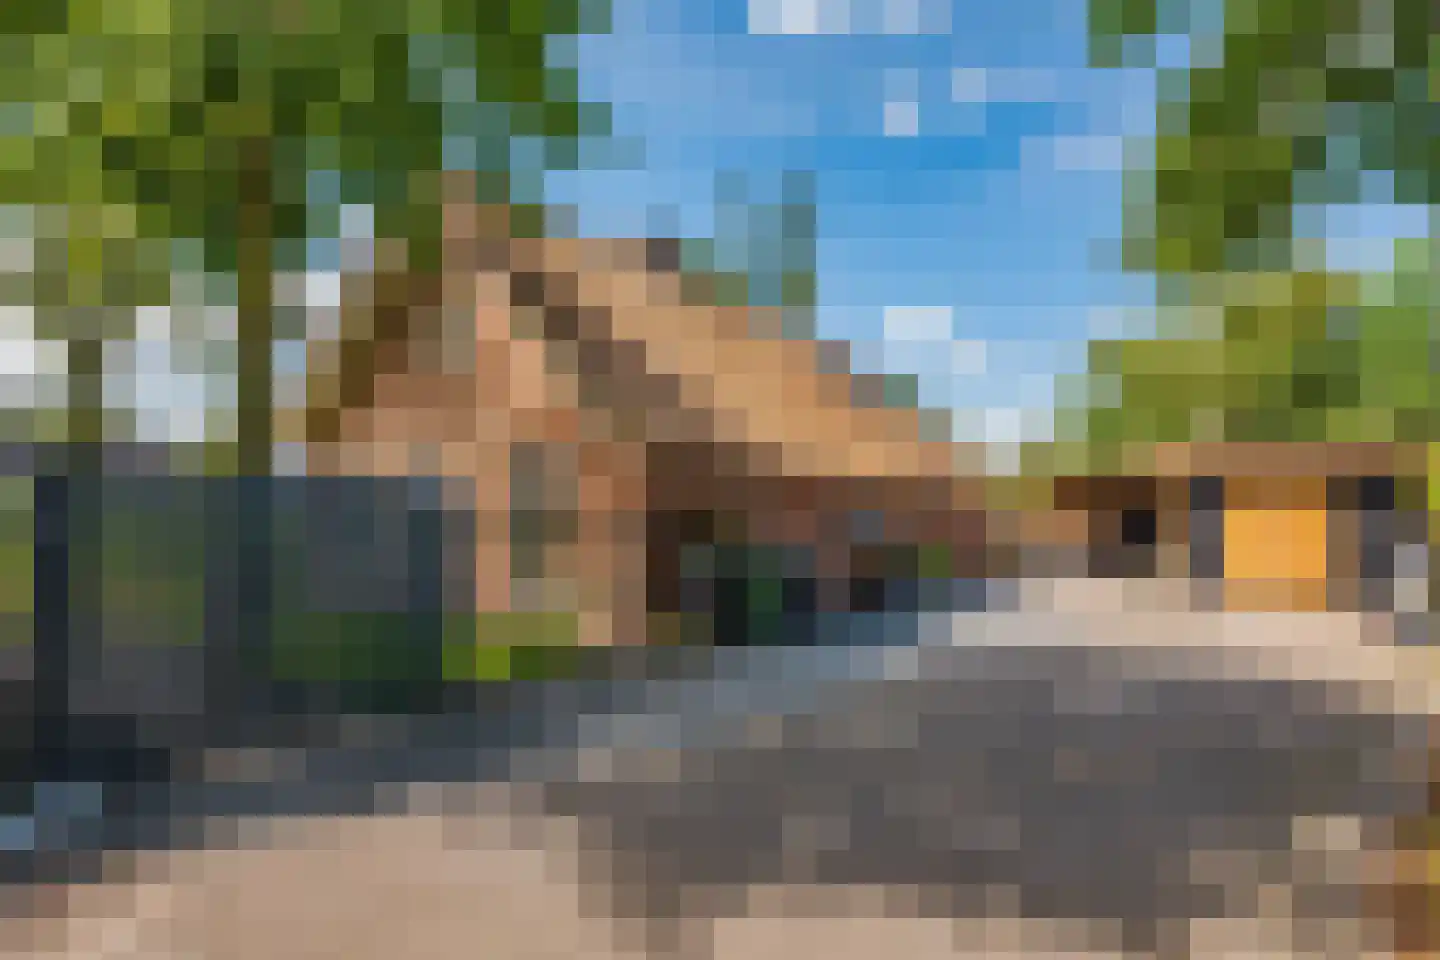
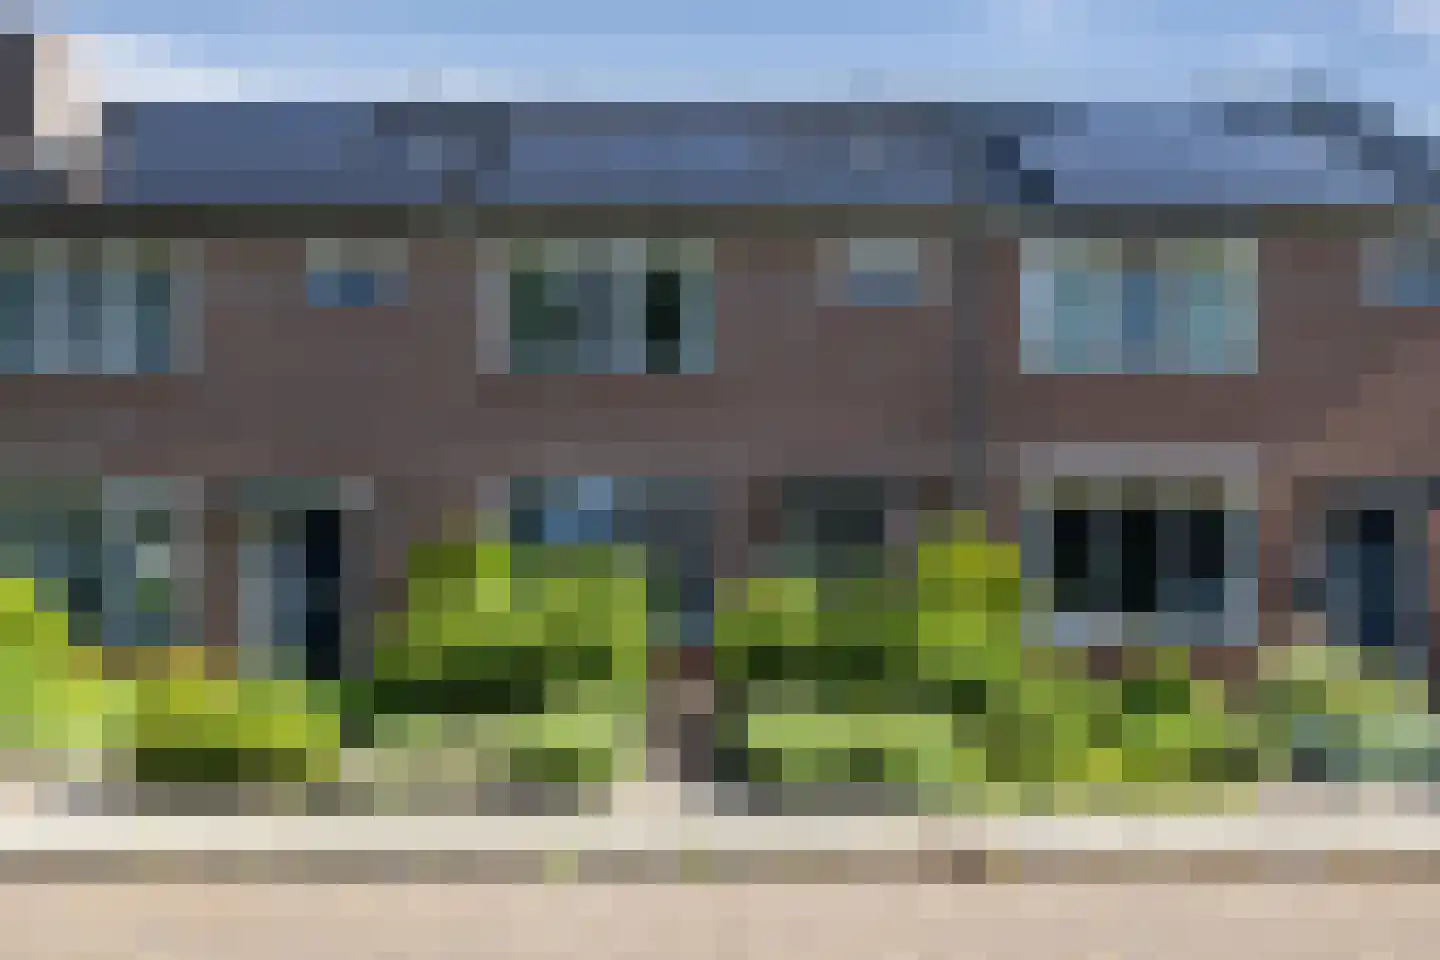
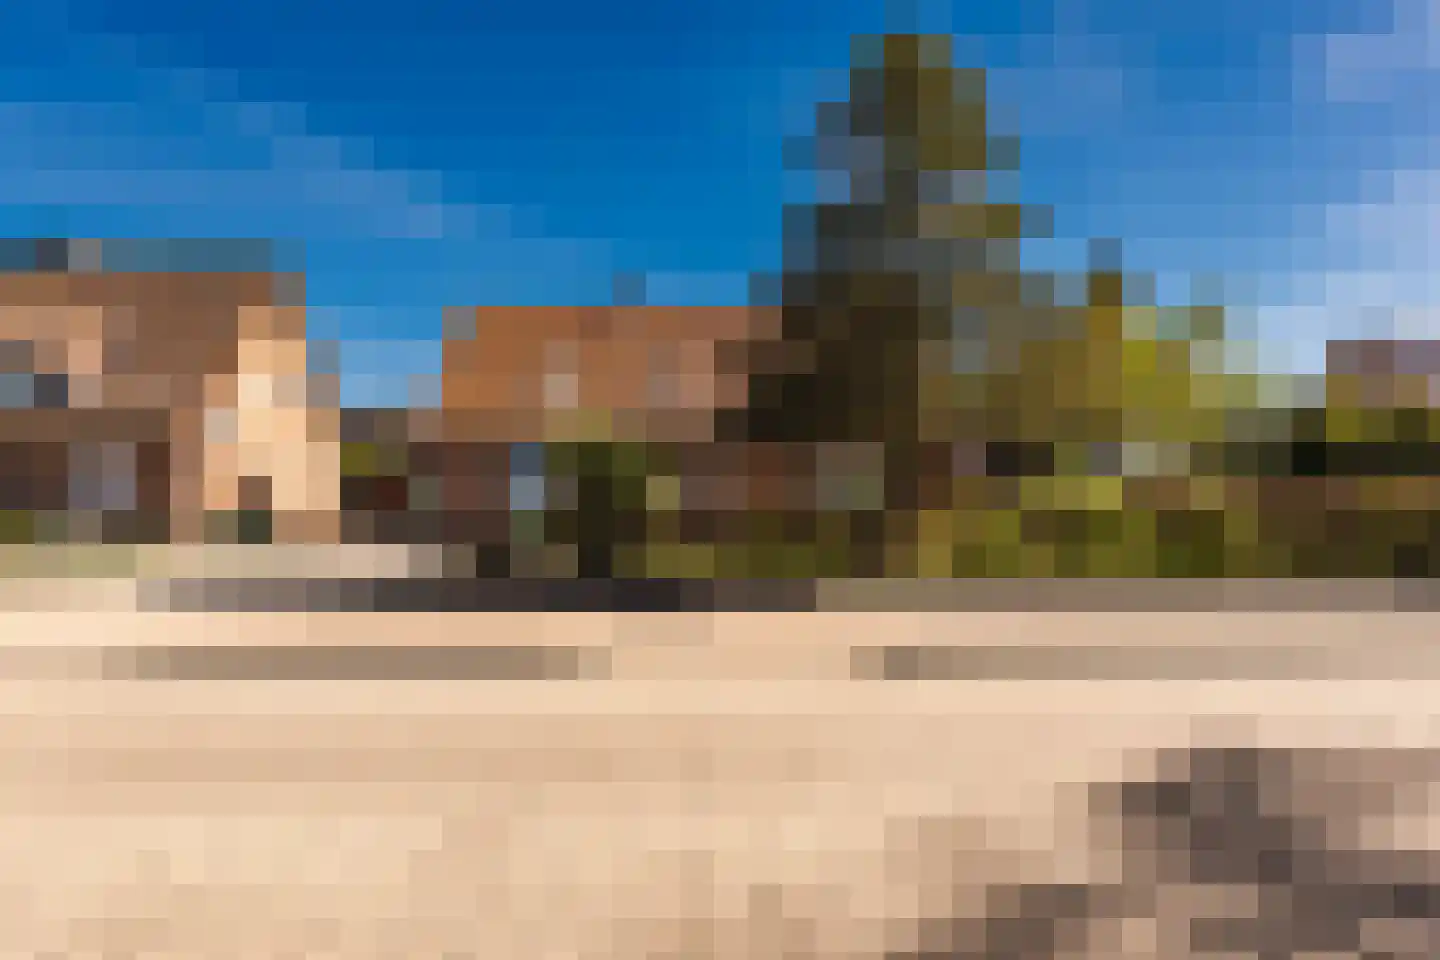
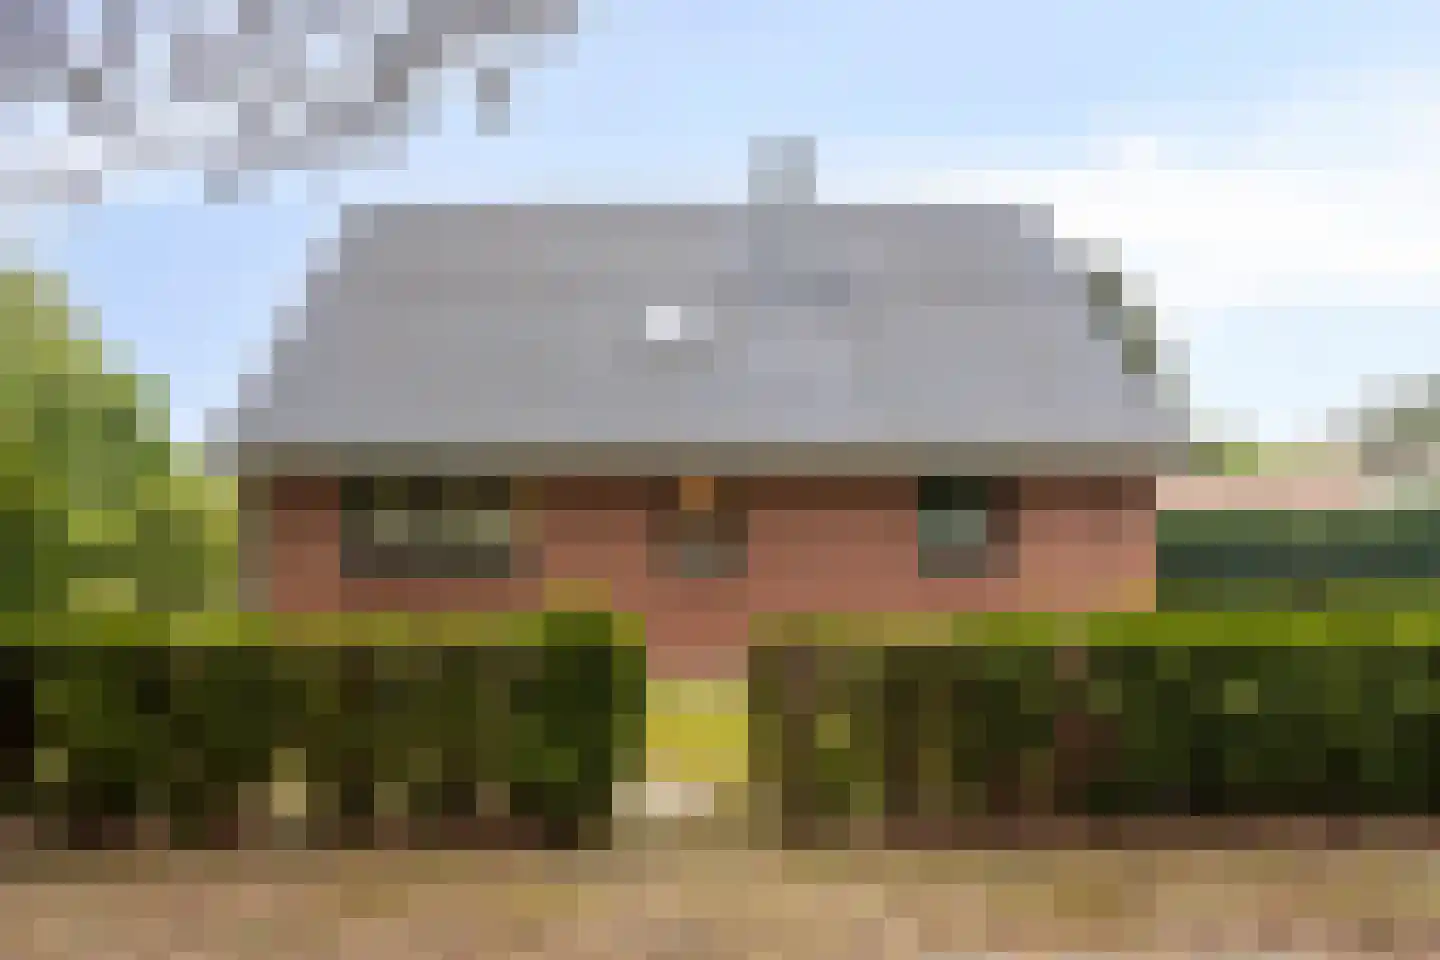
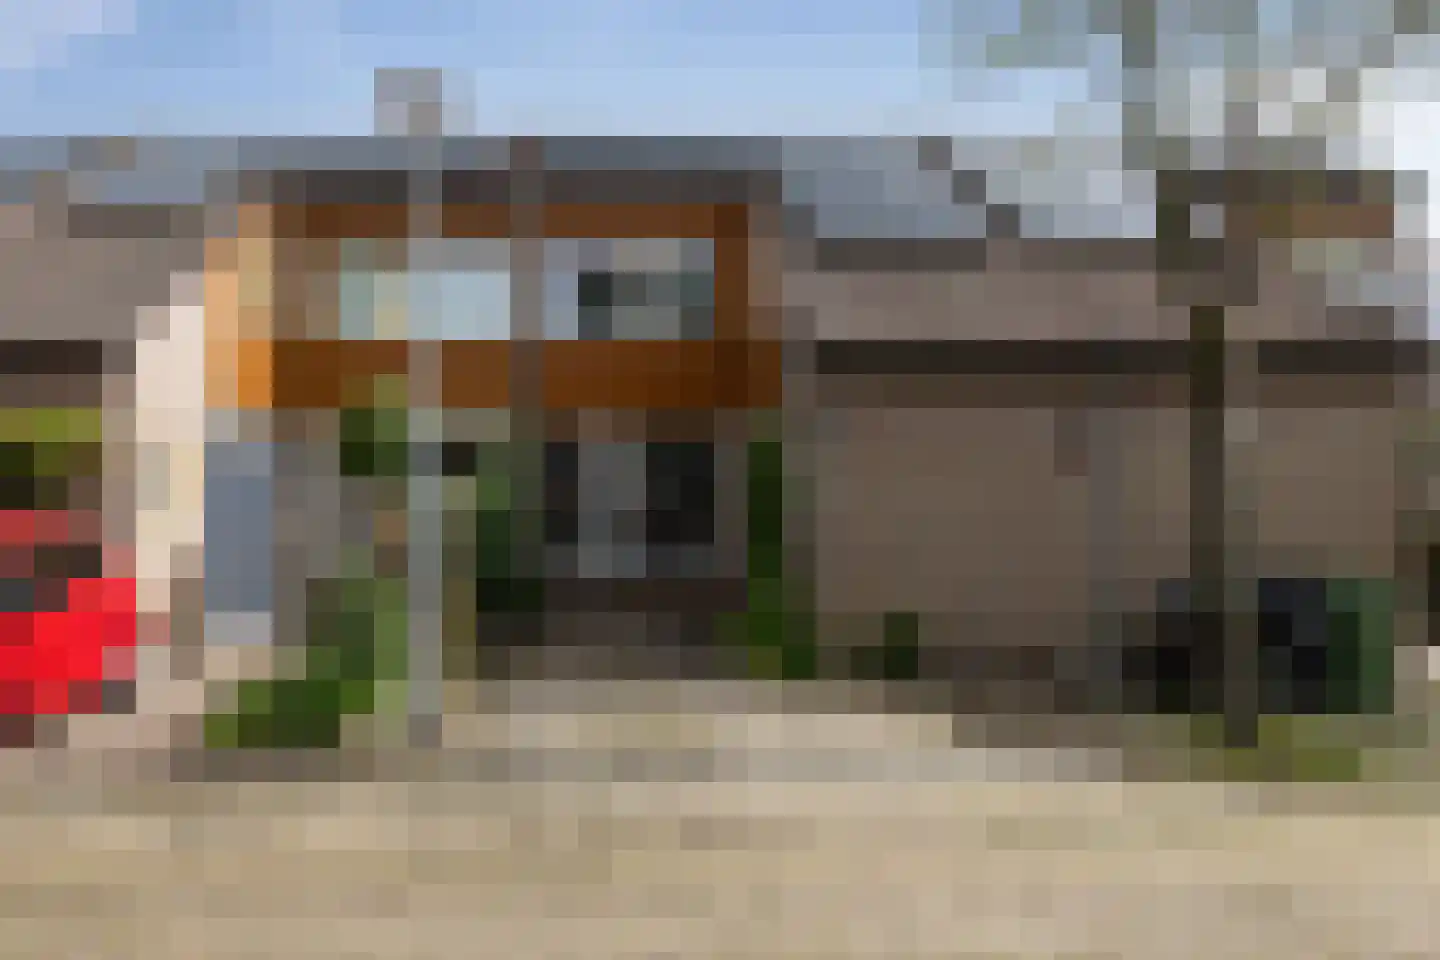
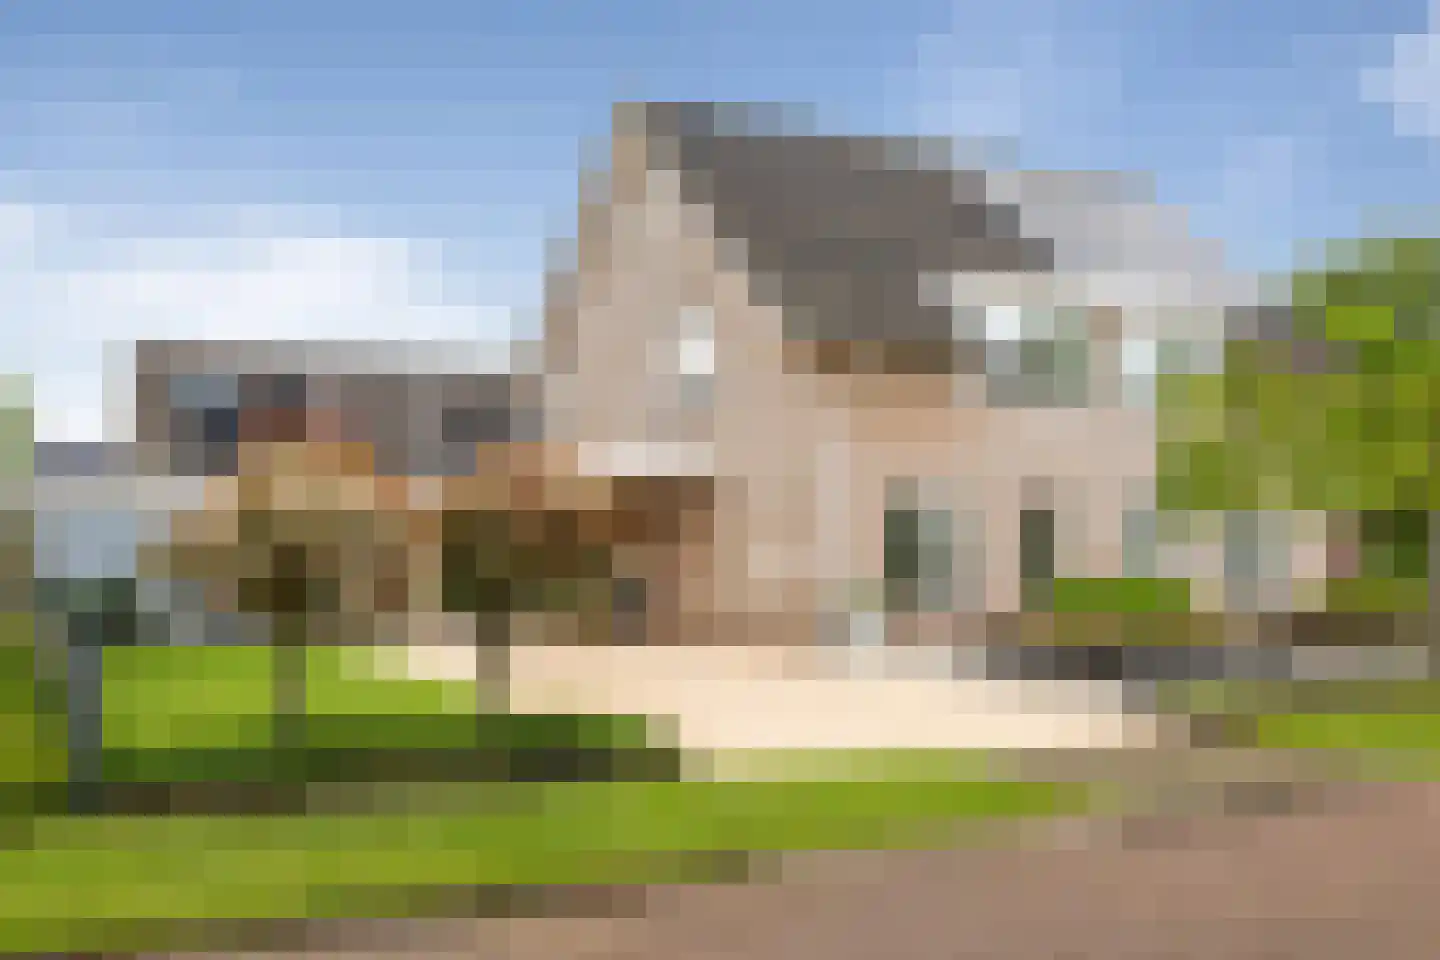
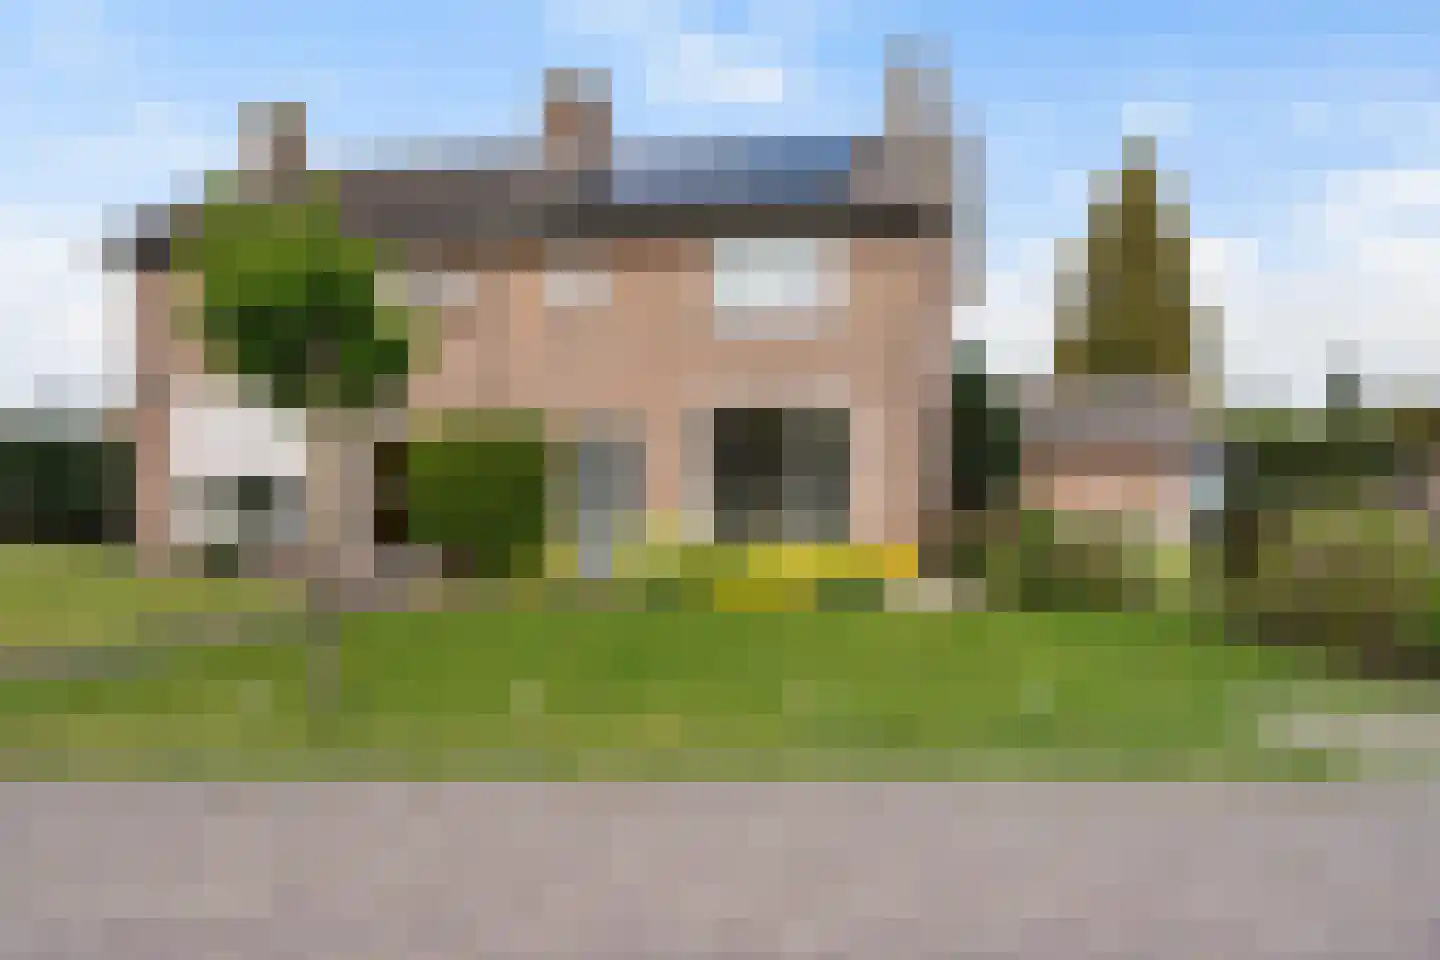
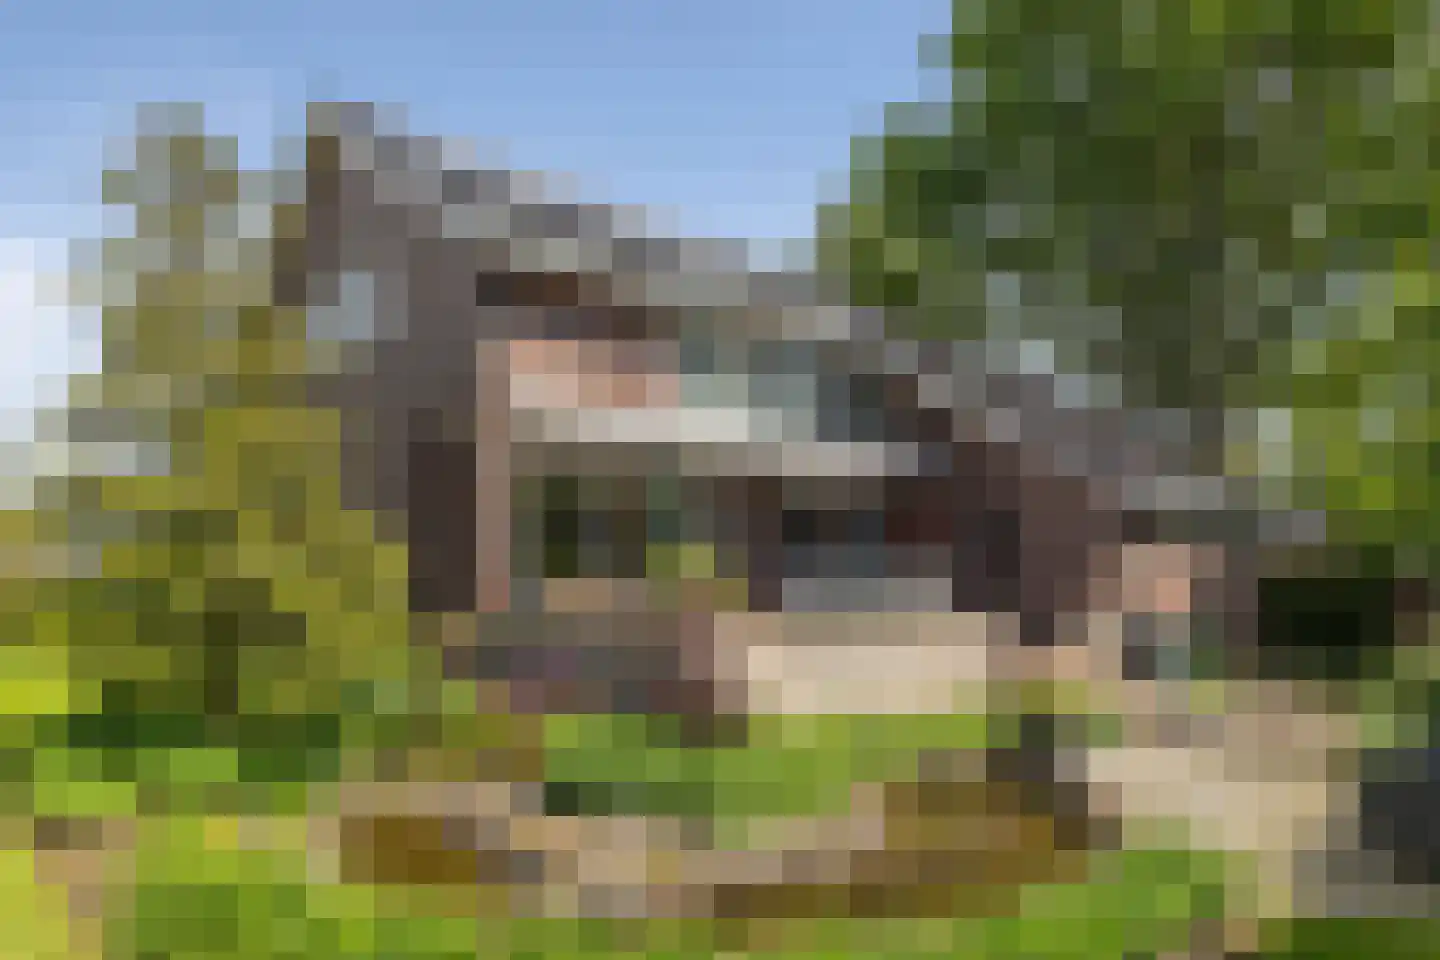
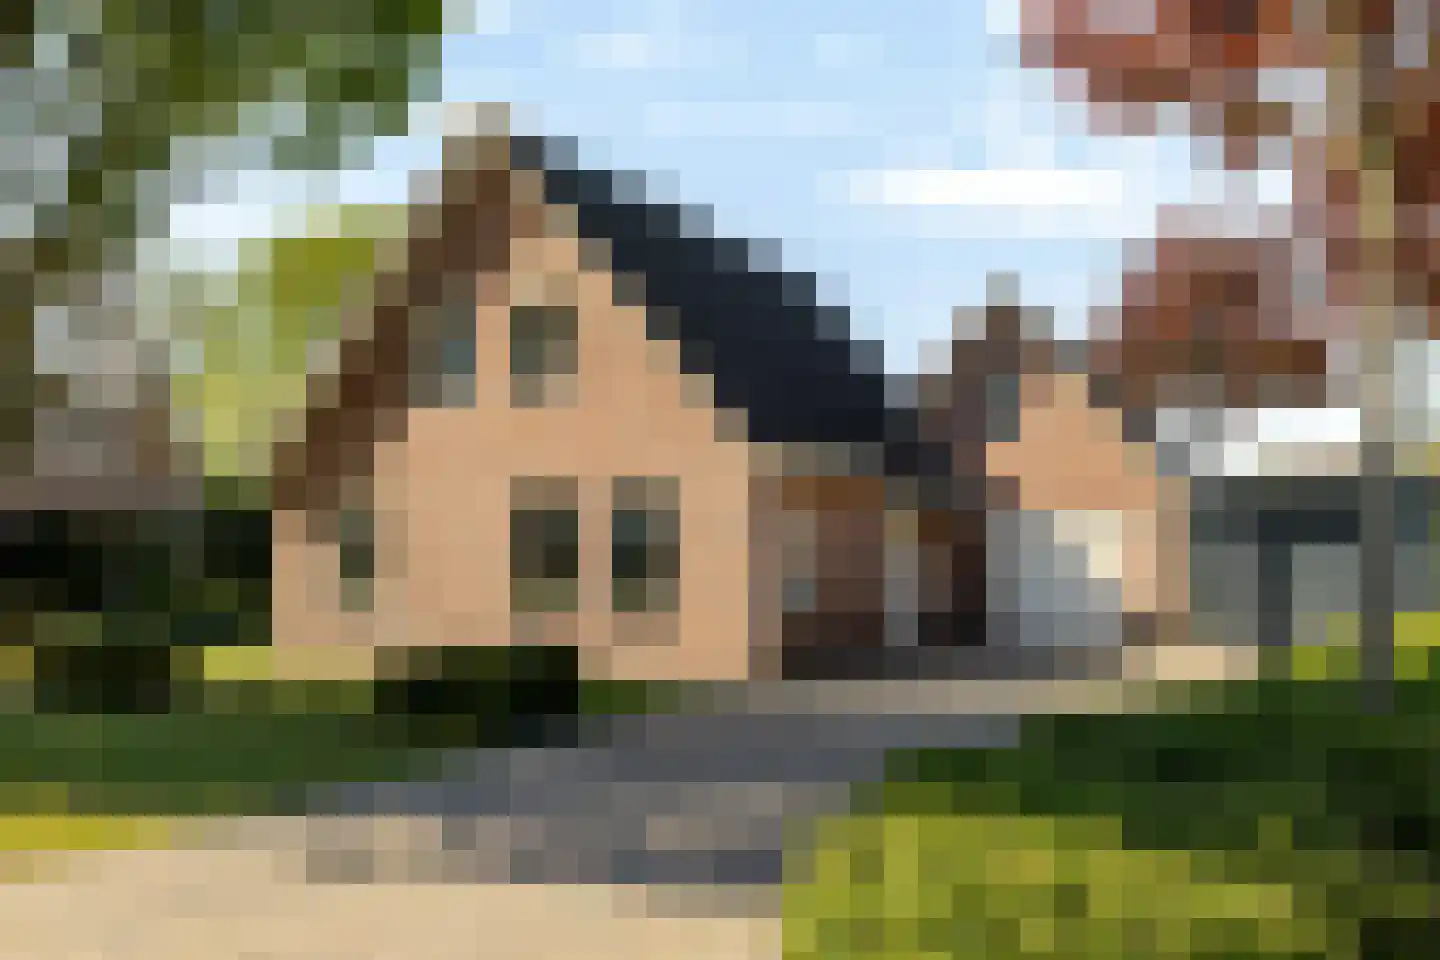
**Unieke kans: wonen en werken combineren op een sfeervolle camping centraal in Drenthe – met extra (toekomstige) woonmogelijkheid** Op een prachtige locatie in het zuidoosten van Drenthe, nabij de Duitse grens en in het karakteristieke Schoonebeek, ligt deze aantrekkelijke en goed onderhouden familiecamping. Omringd door rust, ruimte en uitgestrekte natuur, met het indrukwekkende Bargerveen op korte afstand, biedt deze plek een uitzonderlijke kans voor ondernemers die wonen en werken willen combineren in een groene en ontspannen omgeving. De camping is gelegen op circa 3,3 hectare eigen grond en vormt een solide recreatiebedrijf met een gevarieerd aanbod aan verblijfsaccommodaties. In totaal zijn er 98 plaatsen, verdeeld over toeristische kampeerplaatsen, vaste jaarplaatsen en diverse verhuuraccommodaties, waaronder safaritenten, een trekkershut en chalets. Hiermee wordt een brede doelgroep bediend, van recreatieve kampeerders tot vaste gasten. Wat deze locatie extra bijzonder maakt, is de uitstekende combinatie van ondernemen en wonen. Op het terrein bevindt zich een bedrijfswoning, waardoor u letterlijk naast uw bedrijf kunt wonen en betrokken blijft bij de dagelijkse gang van zaken. Daarnaast is er een separate bouwkavel met woonbestemming aanwezig. Dit biedt interessante mogelijkheden, bijvoorbeeld voor dubbele bewoning, het creëren van een tweede woning, of het samen runnen van de camping met twee gezinnen of twee generaties. De voorzieningen op de camping zijn modern en compleet. Zo is er recent een nieuw restaurant gerealiseerd met terras en een aparte receptie, wat bijdraagt aan een professionele uitstraling en een optimale gastbeleving. Verder beschikt de camping over een verwarmd buitenzwembad en een speeltuin, wat het geheel bijzonder aantrekkelijk maakt voor gezinnen en recreanten. Kortom: een veelzijdig recreatieobject met sterke exploitatiemogelijkheden, gelegen in een uniek natuurgebied, én met uitstekende kansen voor dubbele bewoning of een familiebedrijf. Een ideale plek voor wie droomt van wonen, werken en ondernemen in het groen. De bedrijfswoning: Voorop het terrein is een vrijstaande bedrijfswoning gevestigd. De woning met een oppervlakte van circa 155 m² is opgetrokken met stenen muren en het dak is bedekt met een rieten kap welke recent geheel onderhouden is. De bedrijfswoning verkeert ten opzichte van het oorspronkelijke bouwjaar 1979 in een uitstekende staat en beschikt over energielabel C. De indeling bestaat uit een entree met een hal die doorgang geeft tot de keuken, welke voorzien is van een keukenblok met gasfornuis, oven en magnetron. De keuken geeft een directe toegang tot de aangrenzende woonkamer. Er is een aparte ruimte die momenteel functioneert als opslagkamer. Verder is er een badkamer voorzien van douche, ligbad en wastafel, en een separaat toilet. de trapopgang naar de eerste verdieping komt uit op een overloop welke in verbinding staat met twee ruime slaapkamers en een separaat toilet. Aan de bedrijfswoning is een schuur met afdak gebouwd, in de omliggende diepe tuin is een tuinhuis met hottub geplaatst. Bouwkavel: Aan de voorzijde van het terrein bevindt zich een bouwkavel voor de realisatie van een vrijstaande woning. De voormalige woning is reeds gesloopt. De toekomstige bebouwing mag, inclusief bijbehorende bouwwerken, een maximale oppervlakte van 250 m² bedragen. Voor de woning geldt een maximale goothoogte van 3,5 meter en een maximale bouwhoogte van 9 meter. Receptie/horeca Bij de entree van het terrein bevindt zich een nieuw gerealiseerd horeca- en receptiegebouw. De horecaruimte beschikt over een ruim terras dat is voorzien van glazen wanden, waardoor het afsluitbaar is en het hele jaar door optimaal benut kan worden, ook bij minder gunstige weersomstandigheden. Het gebouw is ingericht met een professionele keuken, sfeervolle diningroom met aangrenzend terras, een bar, loungehoek en praktische opslagruimtes. Het campingterrein: De camping beschikt over 50 toeristische kampeerplaatsen, welke allen zijn voorzien van een eigen stroomaansluiting. De plaatsen zijn ruim opgezet en gelegen in een groene, natuurlijke omgeving. Tussen de bestaande kampeerplaatsen bestaat de mogelijkheid om extra standplaatsen te creëren zonder stroompunt. Op het vijverveld zijn 4 kampeerplaatsen voorzien van privé-sanitair. Daarnaast zijn 2 standplaatsen ingericht als camperplaatsen. Deze plaatsen zijn verhard en uitgerust met een stroomaansluiting. De 37 vaste plaatsen zijn voorzien van een aansluiting op water, stroom, riolering en gas. Van de vaste plaatsen zijn er 27 bezet met een stacaravan of chalet in eigendom van derden. 10 kavels staan op dit moment leeg. Er zijn daarbij nog 3 plaatsen bezet met een eigen verhuuraccommodatie in de vorm van een trekkershut, een chalet ten behoeve van de toeristische verhuur en een chalet welke voor langere tijd verhuurd wordt. Verhuureenheden: De trekkerslodge betreft een zogeheten Iglu trekkershut in de bouwstijl van een traditionele Noorse Iglo, welke capaciteit biedt voor 2 personen. De hut is compleet gemaakt van hout, goed geïsoleerd en is voorzien van een gemeubileerde keuken en een comfortabele zithoek welke kan worden aangepast naar een bed. Op het terrein zijn eveneens 8 safaritenten aanwezig voor de verhuur. Deze safaritenten zijn geschikt voor 4 of 6 personen en zijn verschillend ingericht. 3 van de safaritenten zijn zonder sanitair, 3 safaritenten zijn met enkel toilet en 2 safaritenten met een volledige sanitair inclusief douche. 1 safaritent zonder sanitair en 1 safaritent met enkel toilet huurt de camping, de overige safaritenten zijn in eigendom. Er is een 4-persoons chalet bestemd voor de verhuur. Deze is ingedeeld met een woonkamer, een zit- en eethoek en een open keuken. Dit chalet beschikt over 2 slaapkamers en een badkamer met douche en toilet. Op het terrein is nog een chalet aanwezig welke momenteel langdurig verhuurd wordt. Sanitair: Ter behoeve van de camping is er nabij de entree een verwarmd sanitairgebouw geplaatst welke is voorzien van warm water, douches, toiletten, wasplaatsen, een speciale babyruimte en afwasmogelijkheden. De kosten voor het gebruik van het sanitair zit in de nachtprijs inbegrepen. Speelvoorzieningen: Op het terrein bevinden zich meerdere speelvoorzieningen. Grenzend aan het terras zijn een airtrampoline, een zandbak en een pannakooi. Op het familieveld is onlangs een nieuw speeltoestel geplaatst. Naast de diverse speelvoorzieningen beschikt het park tevens over een verwarmd zwembad en een visvijver. Het recent aangelegde zwembad heeft een afmeting van circa 11 x 6 meter en is verwarmd. Daarnaast bevindt zich op het terrein een visvijver waar gasten in alle rust kunnen vissen. Referentienummer: 210228 Voor de volledigheid vermelden wij dat voor de aankoop van een recreatiebedrijf minimaal 40% eigen vermogen benodigd is in verband met het verkrijgen van een financiering. We begrijpen dat u, na het lezen van deze tekst, mogelijk nog diverse vragen heeft en graag wilt komen kijken. U kunt altijd vrijblijvend contact op nemen met een van onze makelaars voor meer informatie én het maken van een afspraak. De volledige documentatie over dit bedrijf en de exploitatie kunt u aanvragen via de website van de makelaar. Neem voor meer informatie contact met ons op doormiddel van het telefoonnummer en kies voor keuze 2 in het keuze menu. Disclaimer metrages en inhoud: Het betreft een bedrijfswoning waarvoor geen officiële meetrapportage conform de geldende meetinstructie beschikbaar is. Om deze reden zijn de genoemde metrages en inhoud niet exact vastgesteld en kunnen hieraan geen rechten worden ontleend. De vermelde gegevens met betrekking tot woonoppervlakte, overige inpandige ruimte, gebouwgebonden buitenruimte en inhoud zijn indicatief en gebaseerd op een globale inschatting. Koper wordt geadviseerd om, indien gewenst, zelf (of via een deskundige) de exacte afmetingen en inhoud te (laten) bepalen. Het object wordt aangeboden door een recreatie-bedrijfsmakelaardij. Derhalve heeft er geen inmeting van de woning plaats gevonden. De oppervlaktes en inhoud is een indicatie en kunnen in werkelijkheid afwijken.
€ 1.695.000
Cost of copper (estimated): € 35.750
2% transfer tax (€ 33.900) + notary (€ 1.150) + valuation (€ 700)
Total purchase (incl. p.p.): € 1.730.750
3,21%
Yearly
€ 84.750
Direct available
Estimated mortgage
Indicative gross monthly cost
Based on annuity and 30 year term
Indicative net monthly cost
iDisclaimer: this mortgage calculation is a simplified indication based on general assumptions. No rights can be derived from the results shown. Calculated with 10-annual interest (zonder NHG), automatically determined based on the price limit € 470.000. Source: 10-jaars rente uit mortgage_rates (08-06-2026 03:45). For non-NHG, an 80% mortgage of the market value has been used in this indication.
Douche, ligbad, en wastafel
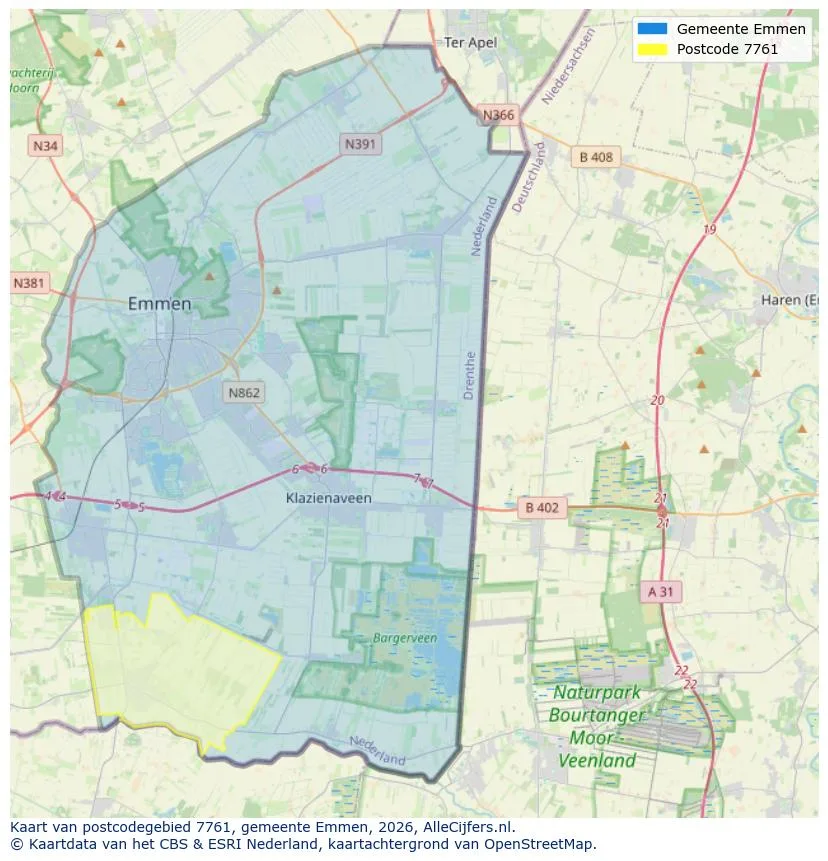
Spatial overview of the work area in Schoonebeek
View current location data on residents, WOZ development, housing stock, energy consumption, business activity and safety in Schoonebeek. In 2026 were there 4.351 residents. The average WOZ value in 2025 is EUR 296.850.
Residents
4.351
Last year: 2026
Average WOZ
EUR 296.850
Last year: 2025
Average income per person.
EUR 26.801
Source: AllNumbers
Crimes (current year)
96
Total registered
| Year | Residents |
|---|---|
| 2021 | 4.365 |
| 2022 | 4.400 |
| 2023 | 4.385 |
| 2024 | 4.390 |
| 2025 | 4.390 |
| 2026 | 4.351 |
| Year | Average WOZ |
|---|---|
| 2021 | EUR 204.483 |
| 2022 | EUR 227.916 |
| 2023 | EUR 262.957 |
| 2024 | EUR 277.903 |
| 2025 | EUR 296.850 |
Hoger
580
Praktisch
830
Middelbaar
1.570
Europa
255
Nederland
4.000
Buiten Europa
135
Label A
607
Label C
513
Label B
315
Label D
163
Label G
156
Label F
138
Label E
88
Label A+
18
Label A+++
16
Label A++
11
Label A++++
2
Label A+++++
0
| Year | Gas (m3) | Electricity (kWh) |
|---|---|---|
| 2020 | 1.425 | 3.052 |
| 2021 | 1.558 | 3.151 |
| 2022 | 1.215 | 2.990 |
| 2023 | 1.025 | 2.902 |
| 2024 | 990 | 3.081 |
Hoekwoning
Gas: 885 • Electricity: 2.200
Huurwoning
Gas: 799 • Electricity: 2.082
Koopwoning
Gas: 1.096 • Electricity: 3.142
Appartement
Gas: 644 • Electricity: 1.440
Tussenwoning
Gas: 832 • Electricity: 2.066
Vrijstaande woning
Gas: 1.238 • Electricity: 3.572
Twee-onder-één-kap woning
Gas: 945 • Electricity: 2.928
Total number of company establishments: 380
| Period | Crimes |
|---|---|
| jan 2026 | 12 |
| jul 2025 | 6 |
| jun 2025 | 10 |
| mei 2025 | 9 |
| mrt 2025 | 10 |
| mrt 2026 | 6 |
| nov 2024 | 3 |
| nov 2025 | 9 |
| okt 2024 | 4 |
| okt 2025 | 6 |
| sep 2024 | 11 |
| sep 2025 | 6 |
These figures give an indicative picture of safety trends in the living environment of Schoonebeek.
Short answers based on current local statistics, handy for a quick comparison of the living environment.
Schoonebeek telt in 2026 ongeveer 4.351 inwoners.
De gemiddelde WOZ-waarde in Schoonebeek is in 2025 circa € 296.850.
Het gemiddelde inkomen per inwoner in Schoonebeek ligt rond € 26.801 per jaar.
Voor het huidige jaar gaat het om ongeveer 96 geregistreerde misdrijven. Gebruik deze cijfers als indicatie en vergelijk trends per periode.
In Schoonebeek komt vooral "Twee-onder-één-kap woningen" veel voor, met ongeveer 697 woningen.
View more homes in this location.
7761XJ Schoonebeek
€ 282.000 k.k.
€ 2.186/m²
Schoonebeek
€ 245.000 k.k.
€ 1.531/m²
2222AM Schoonebeek
€ 209.000 k.k.
€ 1.866/m²
7761DG Schoonebeek
€ 259.500 k.k.
€ 2.569/m²
7761KA Schoonebeek
€ 399.500 k.k.
€ 3.567/m²
7761BB Schoonebeek
€ 275.000 k.k.
€ 3.198/m²
7761ZA Schoonebeek
€ 550.000 k.k.
€ 3.005/m²
7761HC Schoonebeek
€ 539.500 k.k.
