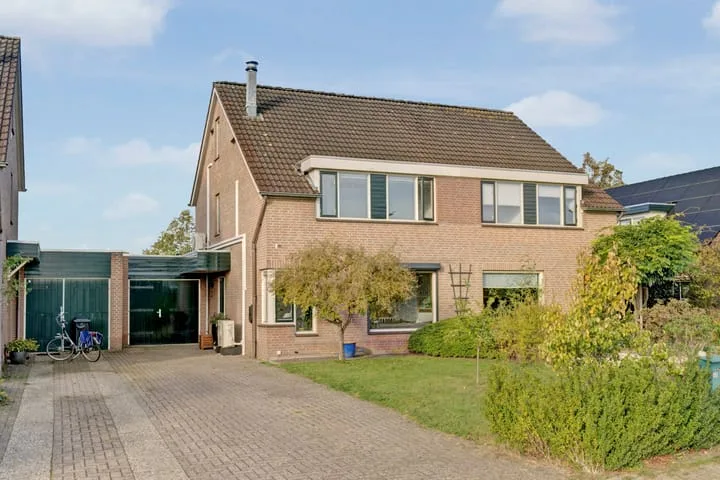
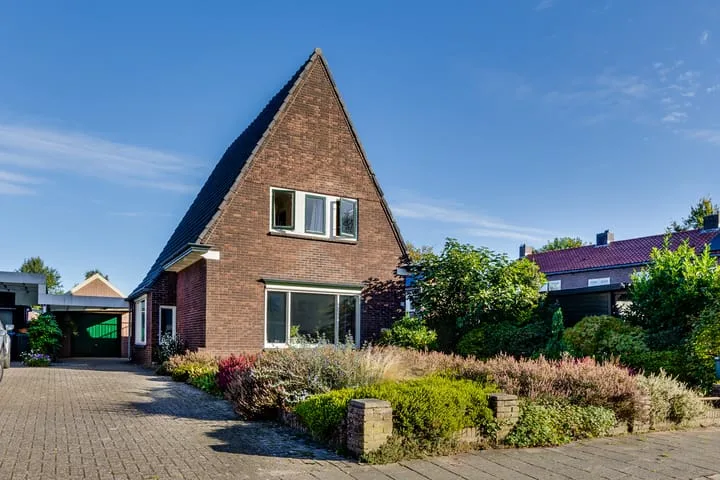
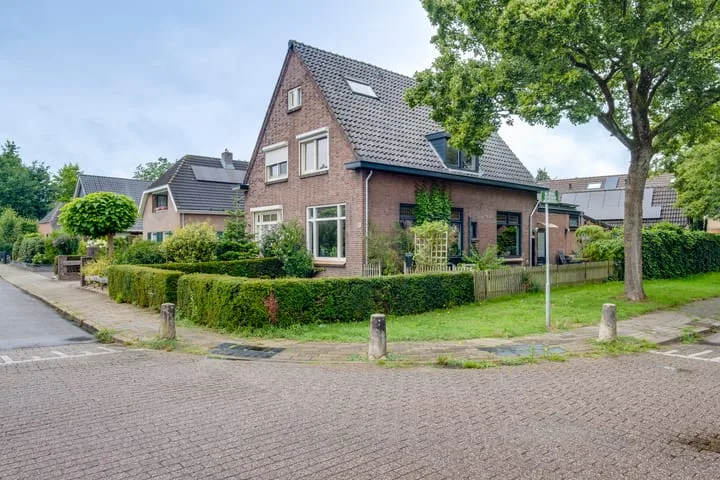
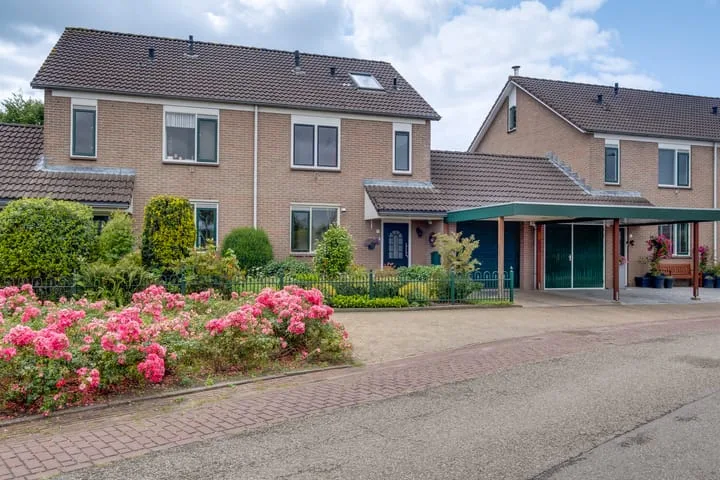
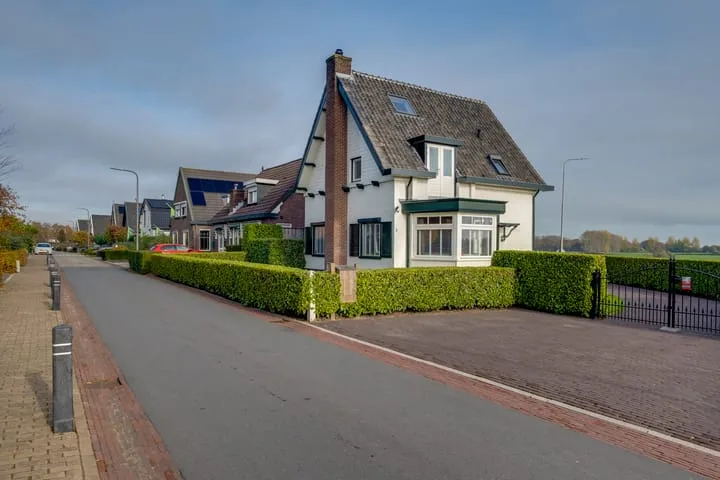
Houses sold in Spankeren

View 6 sold houses in Spankeren

Connected to: Vastgoed Nederland NVM Makelaars

On this page you will find recently sold homes in Spankeren. Use this overview to better estimate selling prices, popular neighborhoods, and the local housing supply before you choose a real estate agent. Also view the current housing supply with 7 houses in Spankeren.

Selection

Search and filter homes

Set your preferences and discover homes that suit you.

Total supply 242.996
Filters

Set price, area and other characteristics. Adjust a filter or click on Show homes. Location changes directly above.

Reset filters

You search for

  • Place Spankeren
  • Status Sold

Huis verkopen in Spankeren? Vergelijk verkoopmakelaars

Bekijk recente verkopen en ontvang gratis offertes van lokale makelaars. Vergelijk meer dan 18 makelaars in Spankeren.

Free request a quote

  • Quotes in Spankeren
  • Non-binding
  • Personal
  • Compare free rates

Zelf je woning verkopen in Spankeren? Vergelijk verkoopmakelaars in Spankeren of bekijk de beste verkoopmakelaars in Spankeren als referentie bij jouw keuze.

Vergelijk meerdere offertes

Makelaars maken scherpere voorstellen als ze weten dat je vergelijkt — vraag offertes aan voor verkoop of aankoop.

Frequently asked questions about sold homes in Spankeren

Short answers about housing prices, sold homes and comparing real estate agents in Spankeren.

Residential and neighborhood statistics in Spankeren

View current location data on residents, WOZ development, housing stock, energy consumption, business activity and safety in Spankeren. In 2026 were there 931 residents. The average WOZ value in 2025 is EUR 412.261.

These figures help to better assess and compare the housing stock in Spankeren with recent sold homes. Orient yourself then on suitable top real estate agents in Spankeren for sales advice in this region.

Residents

931

Last year: 2026

Average WOZ

EUR 412.261

Last year: 2025

Average income per person.

EUR 30.317

Source: AllNumbers

Crimes (current year)

17

Total registered

Demographics and WOZ development

Inhabitants per year

Inhabitants per year in Spankeren
Year Residents
2021 935
2022 950
2023 955
2024 945
2025 950
2026 931

Annual WOZ value

WOZ value per year in Spankeren
Year Average WOZ
2021 EUR 274.875
2022 EUR 306.000
2023 EUR 376.785
2024 EUR 396.381
2025 EUR 412.261

Composition of residents

Age build-up

65+: 245 0-15: 140 15-25: 85 25-45: 170 45-65: 305

Education level

Hoger

160

Praktisch

130

Middelbaar

310

Origin of residents (2025)

Europa

40

Nederland

845

Buiten Europa

60

Housing stock and construction periods

Types of homes

Hoekwoningen 75
Appartementen 8
Tussenwoningen 99
Vrijstaande woningen 95
Twee-onder-één-kap woningen 110

Construction period of buildings

Voor 1700 7
1700 tot 1900 27
1900 tot 1925 29
1925 tot 1950 63
1950 tot 1970 34
1970 tot 1980 122
1980 tot 1990 102
1990 tot 2000 48
2000 tot 2010 21
2010 tot 2020 9
2020 en later 5

Energy and sustainability

Energy label distribution

Label A

108

Label C

108

Label G

76

Label B

41

Label D

20

Label E

18

Label F

10

Label A+

5

Label A++

2

Label A++++

2

Label A+++

0

Label A+++++

0

Average energy consumption per year

Average energy consumption per year in Spankeren
Year Gas (m3) Electricity (kWh)
2020 1.375 3.046
2021 1.569 3.075
2022 1.234 2.939
2023 1.020 2.881
2024 1.012 3.038

Consumption per house type

Hoekwoning

Gas: 737 • Electricity: 2.018

Huurwoning

Gas: 881 • Electricity: 2.309

Koopwoning

Gas: 1.096 • Electricity: 3.195

Appartement

Gas: 172 • Electricity: 366

Tussenwoning

Gas: 632 • Electricity: 1.991

Vrijstaande woning

Gas: 1.353 • Electricity: 3.673

Twee-onder-één-kap woning

Gas: 1.020 • Electricity: 3.007

Business activity in Spankeren (2025)

Handel en HORECA 40
Nijverheid en energie 40
Zakelijke dienstverlening 40
Overheid, onderwijs en zorg 25
Landbouw, bosbouw en visserij 10
Vervoer, informatie en communicatie 10
Financiele diensten en onroerendgoed 10
Cultuur, recreatie en overige diensten 15

Total number of company establishments: 180

Recent crime statistics

Recent crime statistics in Spankeren
Period Crimes
jan 2026 1
jul 2025 0
jun 2025 1
mei 2025 0
mrt 2025 3
mrt 2026 7
nov 2024 0
nov 2025 0
okt 2024 1
okt 2025 0
sep 2024 0
sep 2025 2

These figures give an indicative picture of safety trends in the living environment of Spankeren.

Frequently asked questions about living in Spankeren

Short answers based on current local statistics, handy for a quick comparison of the living environment.

Hoeveel inwoners heeft Spankeren?

Spankeren telt in 2026 ongeveer 931 inwoners.

Wat is de gemiddelde WOZ-waarde in Spankeren?

De gemiddelde WOZ-waarde in Spankeren is in 2025 circa € 412.261.

Wat is het gemiddelde inkomen per inwoner in Spankeren?

Het gemiddelde inkomen per inwoner in Spankeren ligt rond € 30.317 per jaar.

Hoe veilig is wonen in Spankeren?

Voor het huidige jaar gaat het om ongeveer 17 geregistreerde misdrijven. Gebruik deze cijfers als indicatie en vergelijk trends per periode.

Welke woningtypen komen het meest voor in Spankeren?

In Spankeren komt vooral "Twee-onder-één-kap woningen" veel voor, met ongeveer 110 woningen.

Receive free, non-binding quotes

Compare multiple real estate agents and choose the best match.