- Sold subject to confirmation
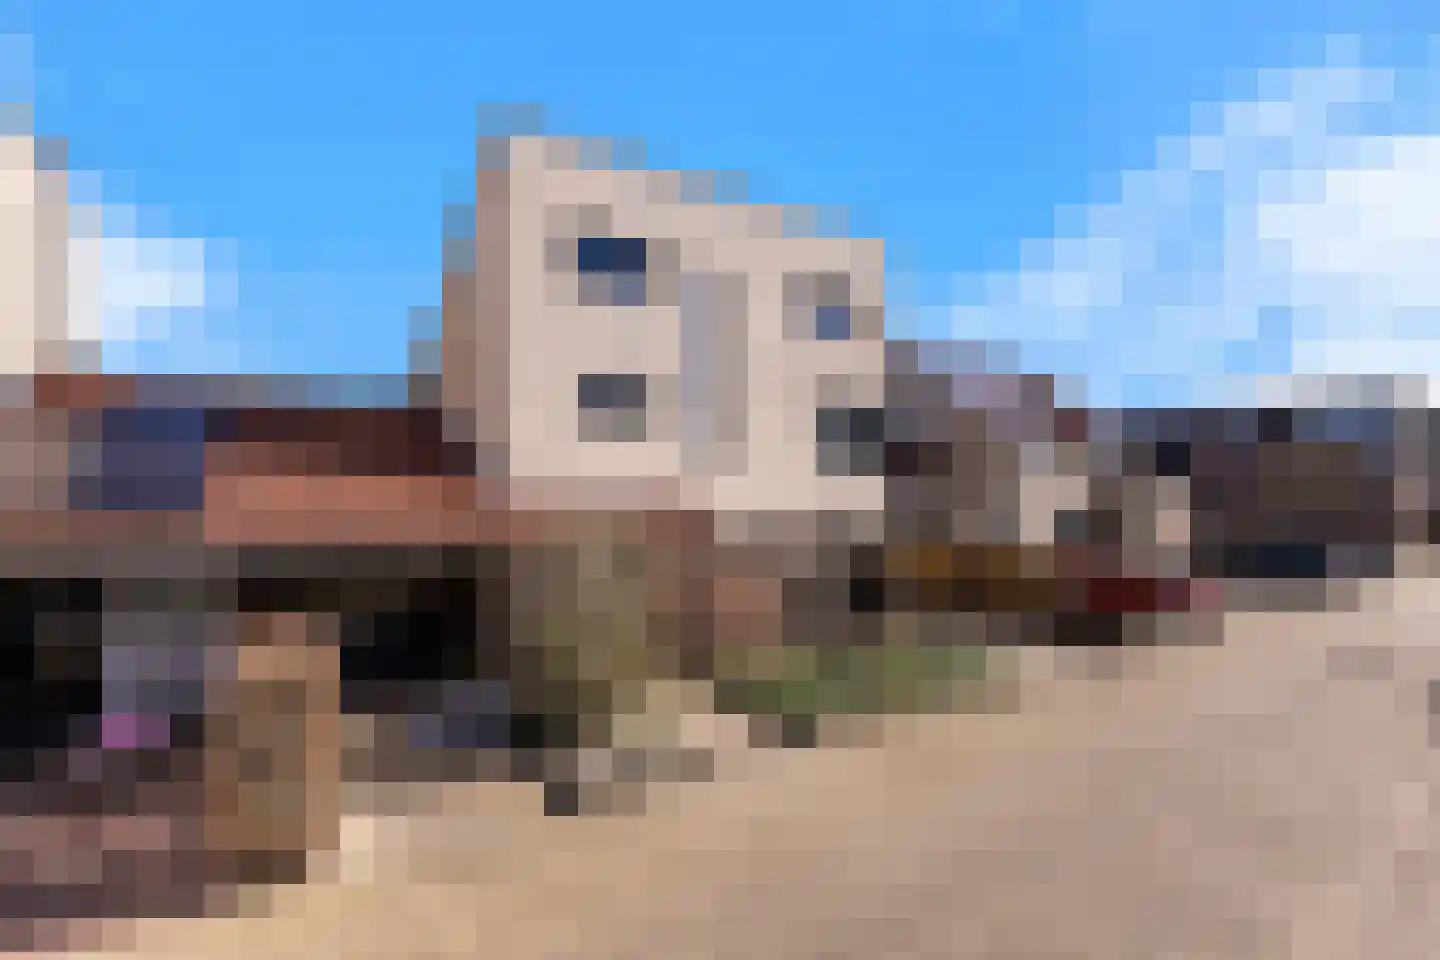
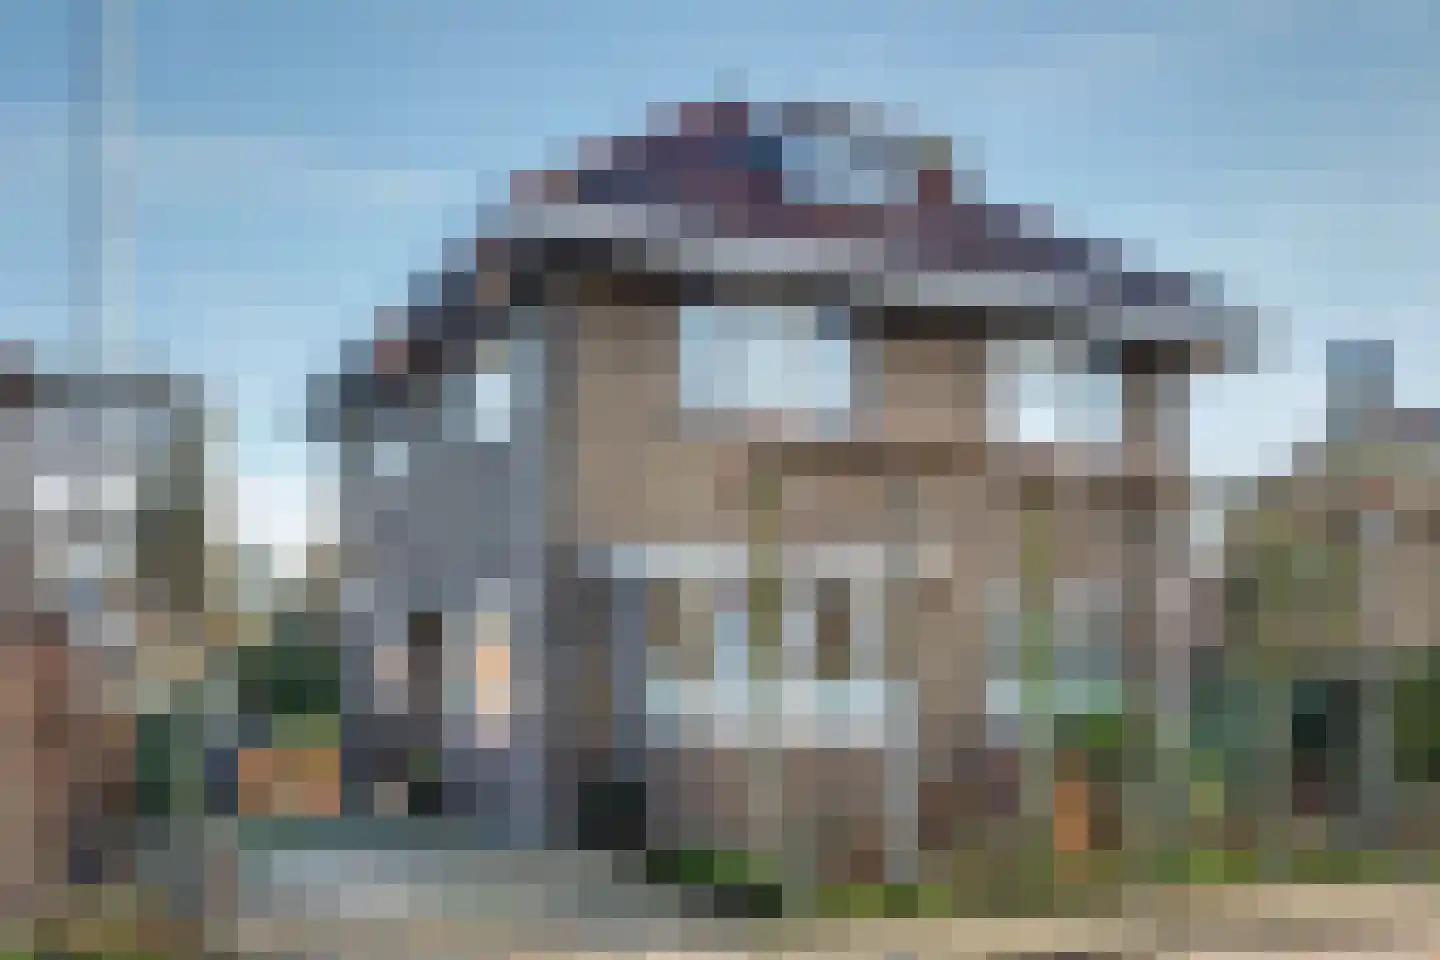
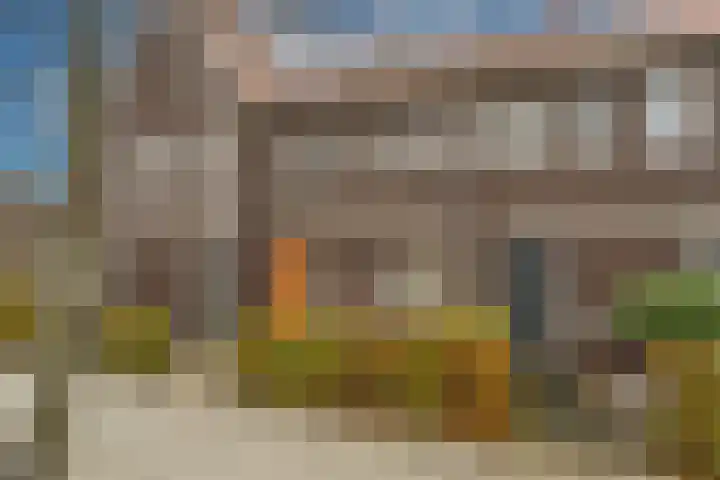
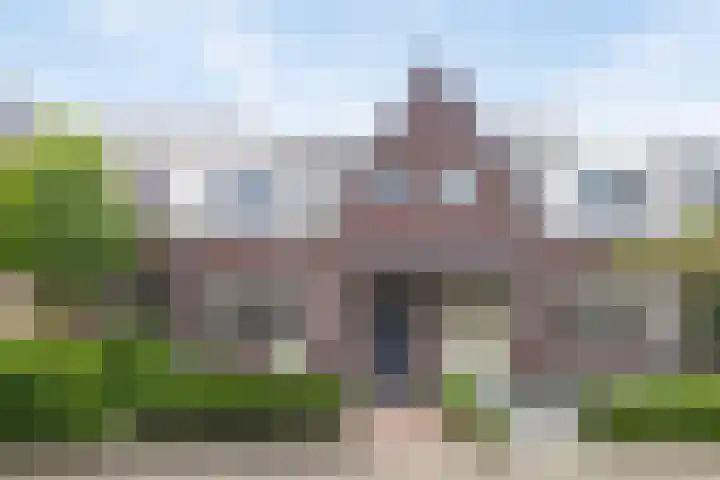
Keizersdijk 72
3291CE Strijen
€ 450.000 k.k.
€ 5.172/m²
D
Save as favorite
- Living area
- 87 m²
- Land area
- 735 m²
- Bedrooms
- 2