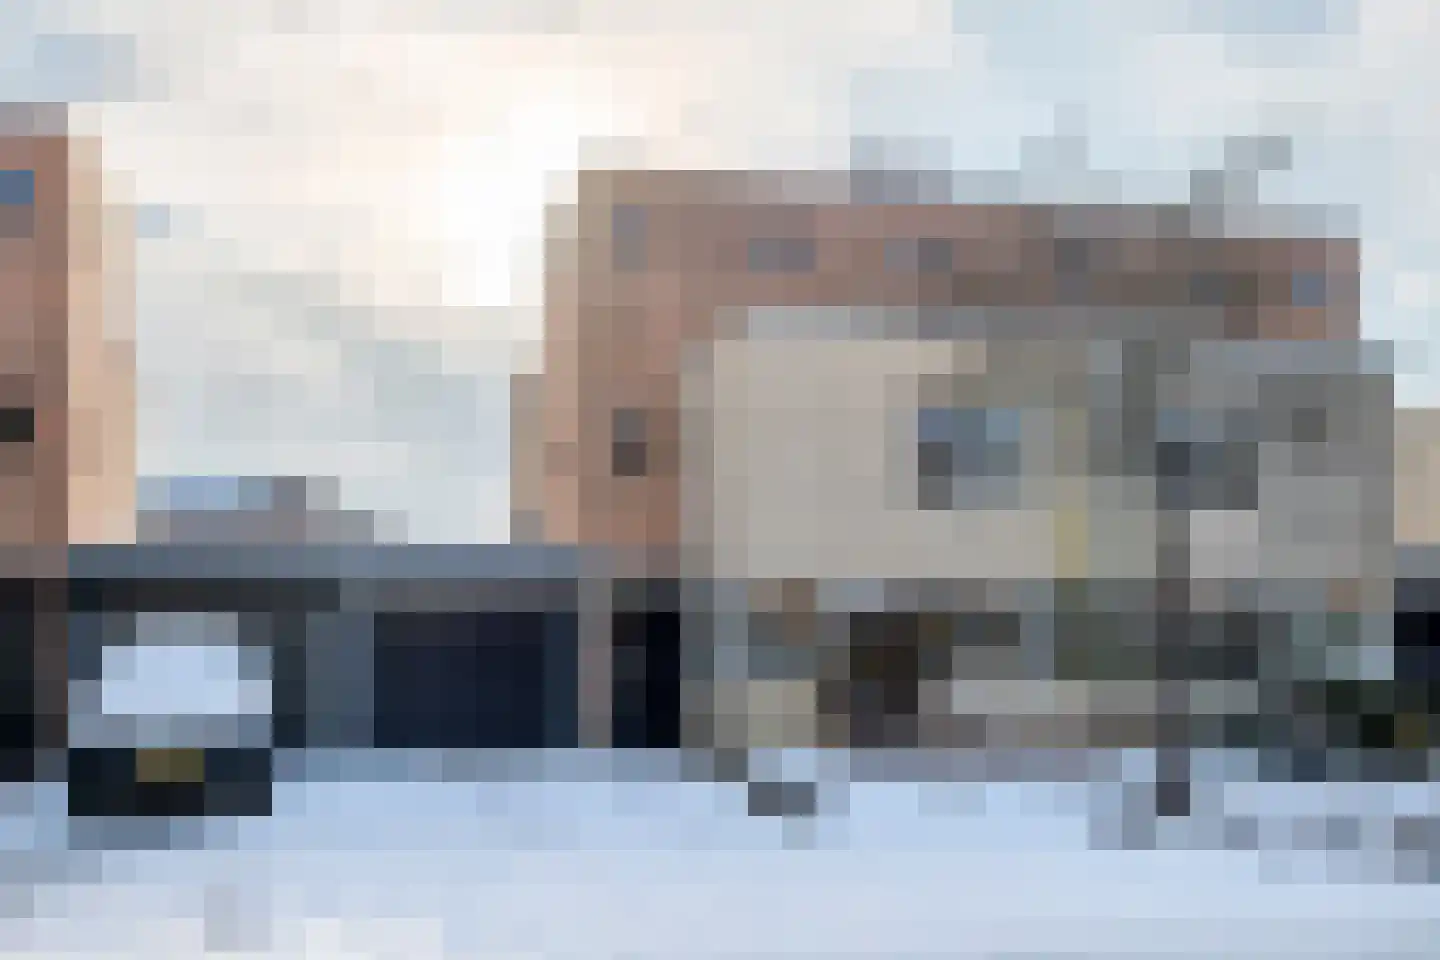
- Sold
Duifkruid 102
4007SZ Tiel
€ 545.000 k.k.
€ 3.949/m²
- Living area
- 138 m²
- Land area
- 242 m²
- Bedrooms
- 3
View 359 sold houses in Tiel
Type to search. Use arrow down and arrow up to navigate through results and press Enter to open.
Hidden search suggestions.
Compare sold homes in Tiel or view the current offering in this location directly.
On this page you will find recently sold homes in Tiel. Use this overview to better estimate selling prices, popular neighborhoods, and the local housing supply before you choose a real estate agent. Also view the current housing supply with 533 houses in Tiel.
4007SZ Tiel
€ 545.000 k.k.
€ 3.949/m²
4007HB Tiel
€ 498.000 k.k.
€ 5.030/m²
4003XG Tiel
€ 389.000 k.k.
€ 3.188/m²
4007WL Tiel
€ 495.000 k.k.
€ 3.807/m²
4003KN Tiel
€ 335.000 k.k.
€ 5.075/m²
4003KP Tiel
€ 415.000 k.k.
€ 4.150/m²
4001LX Tiel
€ 225.000 k.k.
€ 5.232/m²
4001HR Tiel
€ 319.000 k.k.
€ 3.505/m²
4007VD Tiel
€ 469.000 k.k.
€ 4.424/m²
4006BA Tiel
€ 335.000 k.k.
€ 2.658/m²
4007VB Tiel
€ 425.000 k.k.
€ 3.863/m²
4006GC Tiel
€ 335.000 k.k.
€ 2.745/m²
4007VB Tiel
€ 350.000 k.k.
€ 3.271/m²
4001BE Tiel
€ 265.000 k.k.
€ 4.732/m²
4005AH Tiel
€ 425.000 k.k.
€ 3.541/m²
4001DP Tiel
€ 479.500 k.k.
€ 3.578/m²
4006XT Tiel
€ 392.500 k.k.
€ 3.702/m²
4003TJ Tiel
€ 529.000 k.k.
€ 4.336/m²
4003BA Tiel
€ 380.000 k.k.
€ 2.676/m²
4007VE Tiel
€ 545.000 k.k.
€ 3.586/m²
4001HH Tiel
€ 469.000 k.k.
€ 4.114/m²
4001WN Tiel
€ 375.000 k.k.
€ 3.676/m²
4001RV Tiel
€ 265.000 k.k.
€ 3.785/m²
4005AC Tiel
€ 395.000 k.k.
€ 3.185/m²
4007WJ Tiel
€ 475.000 k.k.
€ 3.571/m²
4003VN Tiel
€ 438.000 k.k.
€ 4.380/m²
4001MH Tiel
€ 500.000 k.k.
€ 3.225/m²
4001KA Tiel
€ 292.500 k.k.
€ 4.500/m²
View recent sales and receive free quotes from local real estate agents. Compare more than 28 real estate agents in Tiel.
Sold recently in Tiel? Read the sales-oriented guide sell your home in Tiel, compare sales agents in Tiel or view the top sales agents in Tiel for reference in your choice.
Real estate agents make sharper offers when they know you're comparing — ask for quotes for sale or purchase.
Short answers about housing prices, sold homes and comparing real estate agents in Tiel.
The costs of a real estate agent in Tiel vary per office, property type and sales approach. In Tiel you can compare 28 real estate agents; therefore also look at the real estate agents in Tiel to better compare fees, presentation and local experience.
On this page we currently show 359 sold houses in Tiel from our selection. This helps you to better assess recent transactions and the local housing market.
Houses sold in Tiel give insight into asking prices, house types and neighborhoods where recent transactions have taken place. Compare this also with the current housing stock in Tiel to better understand the market.
You can use sold homes as a first market indication, but a local real estate agent can better take into account finishing, location, maintenance and current demand in Tiel. Plan the next step via the guide selling a house in Tiel.
Compare the 28 real estate agents in Tiel on local sales experience, reviews, expected yield, commission and marketing approach. View real estate agents in Tiel or the top 10 agents in Tiel to quickly discover strong offices.
View current location data on residents, WOZ development, housing stock, energy consumption, business activity and safety in Tiel. In 2026 were there 42.493 residents. The average WOZ value in 2025 is EUR 358.000.
These figures help to better assess and compare the housing stock in Tiel with recent sold homes. Orient yourself then on suitable top real estate agents in Tiel for sales advice in this region.
Residents
42.493
Last year: 2026
Average WOZ
EUR 358.000
Last year: 2025
Average income per person.
EUR 32.500
Source: AllNumbers
Crimes (current year)
1.841
Total registered
| Year | Residents |
|---|---|
| 2022 | 42.277 |
| 2023 | 42.604 |
| 2024 | 42.370 |
| 2025 | 42.575 |
| 2026 | 42.493 |
| Year | Average WOZ |
|---|---|
| 2021 | EUR 238.000 |
| 2022 | EUR 264.000 |
| 2023 | EUR 315.000 |
| 2024 | EUR 346.000 |
| 2025 | EUR 358.000 |
Hoger
27
Praktisch
32
Middelbaar
41
Europa
3.963
Nederland
29.505
Buiten Europa
9.107
Label C
4.627
Label B
4.514
Label A
4.005
Label D
1.446
Label G
1.043
Label E
964
Label F
928
Label A+
525
Label A++
334
Label A+++
225
Label A++++
17
Label A+++++
15
| Year | Gas (m3) | Electricity (kWh) |
|---|---|---|
| 2020 | 1.150 | 2.910 |
| 2021 | 1.310 | 2.930 |
| 2022 | 1.020 | 2.740 |
| 2023 | 860 | 2.600 |
| 2024 | 840 | 2.650 |
Hoekwoning
Gas: 940 • Electricity: 2.790
Huurwoning
Gas: 750 • Electricity: 2.030
Koopwoning
Gas: 940 • Electricity: 3.030
Appartement
Gas: 640 • Electricity: 1.800
Tussenwoning
Gas: 800 • Electricity: 2.580
Vrijstaande woning
Gas: 1.390 • Electricity: 4.160
Twee-onder-één-kap woning
Gas: 1.060 • Electricity: 3.070
Total number of company establishments: 5.185
| Period | Crimes |
|---|---|
| jan 2026 | 162 |
| jul 2025 | 155 |
| jun 2025 | 127 |
| mei 2025 | 160 |
| mrt 2025 | 190 |
| mrt 2026 | 124 |
| nov 2024 | 140 |
| nov 2025 | 137 |
| okt 2024 | 190 |
| okt 2025 | 153 |
| sep 2024 | 206 |
| sep 2025 | 194 |
These figures give an indicative picture of safety trends in the living environment of Tiel.
Short answers based on current local statistics, handy for a quick comparison of the living environment.
Tiel telt in 2026 ongeveer 42.493 inwoners.
De gemiddelde WOZ-waarde in Tiel is in 2025 circa € 358.000.
Het gemiddelde inkomen per inwoner in Tiel ligt rond € 32.500 per jaar.
Voor het huidige jaar gaat het om ongeveer 1.841 geregistreerde misdrijven. Gebruik deze cijfers als indicatie en vergelijk trends per periode.
In Tiel komt vooral "Tussenwoningen" veel voor, met ongeveer 7.189 woningen.