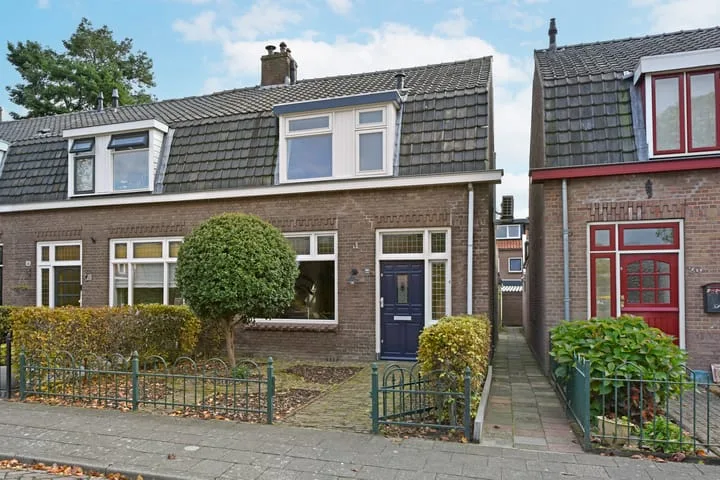
Houses sold in Tiel

View 359 sold houses in Tiel

Connected to: Vastgoed Nederland NVM Makelaars

On this page you will find recently sold homes in Tiel. Use this overview to better estimate selling prices, popular neighborhoods, and the local housing supply before you choose a real estate agent. Also view the current housing supply with 533 houses in Tiel.

Selection

Search and filter homes

Set your preferences and discover homes that suit you.

Total supply 241.817
Filters

Set price, area and other characteristics. Adjust a filter or click on Show homes. Location changes directly above.

Reset filters

You search for

  • Place Tiel
  • Status Sold

Sell your house in Tiel? Compare real estate agents

View recent sales and receive free quotes from local real estate agents. Compare more than 28 real estate agents in Tiel.

Free request a quote

  • Quotes in Tiel
  • Non-binding
  • Personal
  • Compare free rates

Sold recently in Tiel? Read the sales-oriented guide sell your home in Tiel, compare sales agents in Tiel or view the top sales agents in Tiel for reference in your choice.

Compare multiple quotes

Real estate agents make sharper offers when they know you're comparing — ask for quotes for sale or purchase.

Frequently asked questions about sold homes in Tiel

Short answers about housing prices, sold homes and comparing real estate agents in Tiel.

Residential and neighborhood statistics in Tiel

View current location data on residents, WOZ development, housing stock, energy consumption, business activity and safety in Tiel. In 2026 were there 42.493 residents. The average WOZ value in 2025 is EUR 358.000.

These figures help to better assess and compare the housing stock in Tiel with recent sold homes. Orient yourself then on suitable top real estate agents in Tiel for sales advice in this region.

Residents

42.493

Last year: 2026

Average WOZ

EUR 358.000

Last year: 2025

Average income per person.

EUR 32.500

Source: AllNumbers

Crimes (current year)

1.841

Total registered

Demographics and WOZ development

Inhabitants per year

Inhabitants per year in Tiel
Year Residents
2022 42.277
2023 42.604
2024 42.370
2025 42.575
2026 42.493

Annual WOZ value

WOZ value per year in Tiel
Year Average WOZ
2021 EUR 238.000
2022 EUR 264.000
2023 EUR 315.000
2024 EUR 346.000
2025 EUR 358.000

Composition of residents

Age build-up

65+: 8.525 0-15: 6.168 15-25: 5.044 25-45: 10.897 45-65: 11.941

Education level

Hoger

27

Praktisch

32

Middelbaar

41

Origin of residents (2025)

Europa

3.963

Nederland

29.505

Buiten Europa

9.107

Housing stock and construction periods

Types of homes

Hoekwoningen 3.245
Appartementen 5.286
Tussenwoningen 7.189
Vrijstaande woningen 1.273
Twee-onder-één-kap woningen 1.447

Construction period of buildings

Voor 1700 12
1700 tot 1900 441
1900 tot 1925 950
1925 tot 1950 1.477
1950 tot 1970 2.577
1970 tot 1980 2.442
1980 tot 1990 2.155
1990 tot 2000 3.237
2000 tot 2010 568
2010 tot 2020 946
2020 en later 688

Energy and sustainability

Energy label distribution

Label C

4.627

Label B

4.514

Label A

4.005

Label D

1.446

Label G

1.043

Label E

964

Label F

928

Label A+

525

Label A++

334

Label A+++

225

Label A++++

17

Label A+++++

15

Average energy consumption per year

Average energy consumption per year in Tiel
Year Gas (m3) Electricity (kWh)
2020 1.150 2.910
2021 1.310 2.930
2022 1.020 2.740
2023 860 2.600
2024 840 2.650

Consumption per house type

Hoekwoning

Gas: 940 • Electricity: 2.790

Huurwoning

Gas: 750 • Electricity: 2.030

Koopwoning

Gas: 940 • Electricity: 3.030

Appartement

Gas: 640 • Electricity: 1.800

Tussenwoning

Gas: 800 • Electricity: 2.580

Vrijstaande woning

Gas: 1.390 • Electricity: 4.160

Twee-onder-één-kap woning

Gas: 1.060 • Electricity: 3.070

Business activity in Tiel (2025)

Handel en HORECA 1.035
Nijverheid en energie 850
Zakelijke dienstverlening 1.195
Overheid, onderwijs en zorg 915
Landbouw, bosbouw en visserij 70
Vervoer, informatie en communicatie 370
Financiele diensten en onroerendgoed 210
Cultuur, recreatie en overige diensten 535

Total number of company establishments: 5.185

Recent crime statistics

Recent crime statistics in Tiel
Period Crimes
jan 2026 162
jul 2025 155
jun 2025 127
mei 2025 160
mrt 2025 190
mrt 2026 124
nov 2024 140
nov 2025 137
okt 2024 190
okt 2025 153
sep 2024 206
sep 2025 194

These figures give an indicative picture of safety trends in the living environment of Tiel.

Frequently asked questions about living in Tiel

Short answers based on current local statistics, handy for a quick comparison of the living environment.

Hoeveel inwoners heeft Tiel?

Tiel telt in 2026 ongeveer 42.493 inwoners.

Wat is de gemiddelde WOZ-waarde in Tiel?

De gemiddelde WOZ-waarde in Tiel is in 2025 circa € 358.000.

Wat is het gemiddelde inkomen per inwoner in Tiel?

Het gemiddelde inkomen per inwoner in Tiel ligt rond € 32.500 per jaar.

Hoe veilig is wonen in Tiel?

Voor het huidige jaar gaat het om ongeveer 1.841 geregistreerde misdrijven. Gebruik deze cijfers als indicatie en vergelijk trends per periode.

Welke woningtypen komen het meest voor in Tiel?

In Tiel komt vooral "Tussenwoningen" veel voor, met ongeveer 7.189 woningen.

Receive free, non-binding quotes

Compare multiple real estate agents and choose the best match.