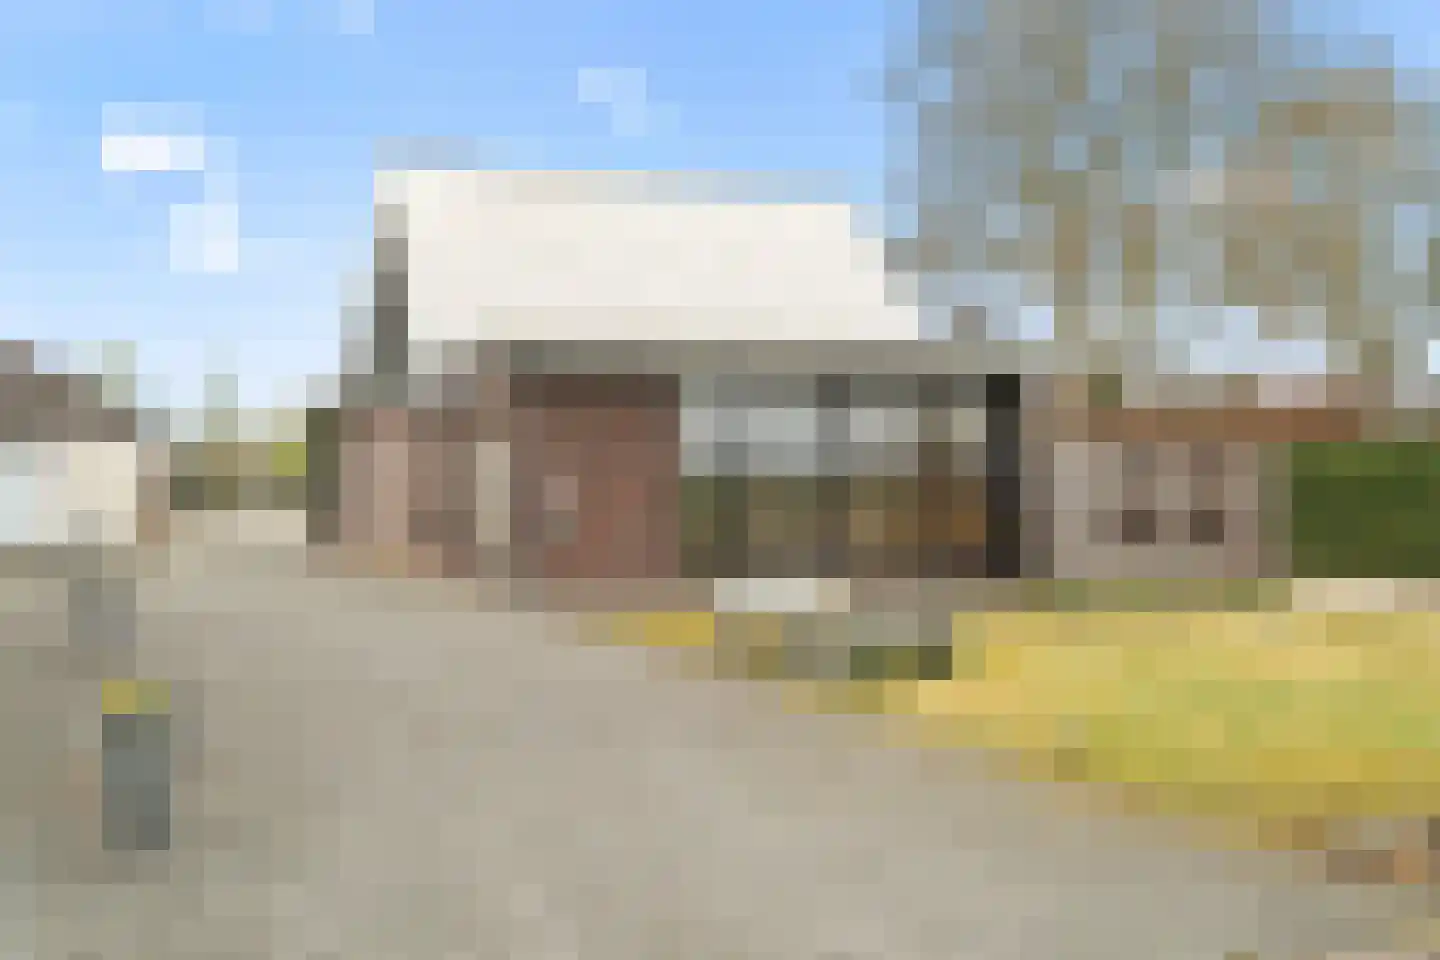
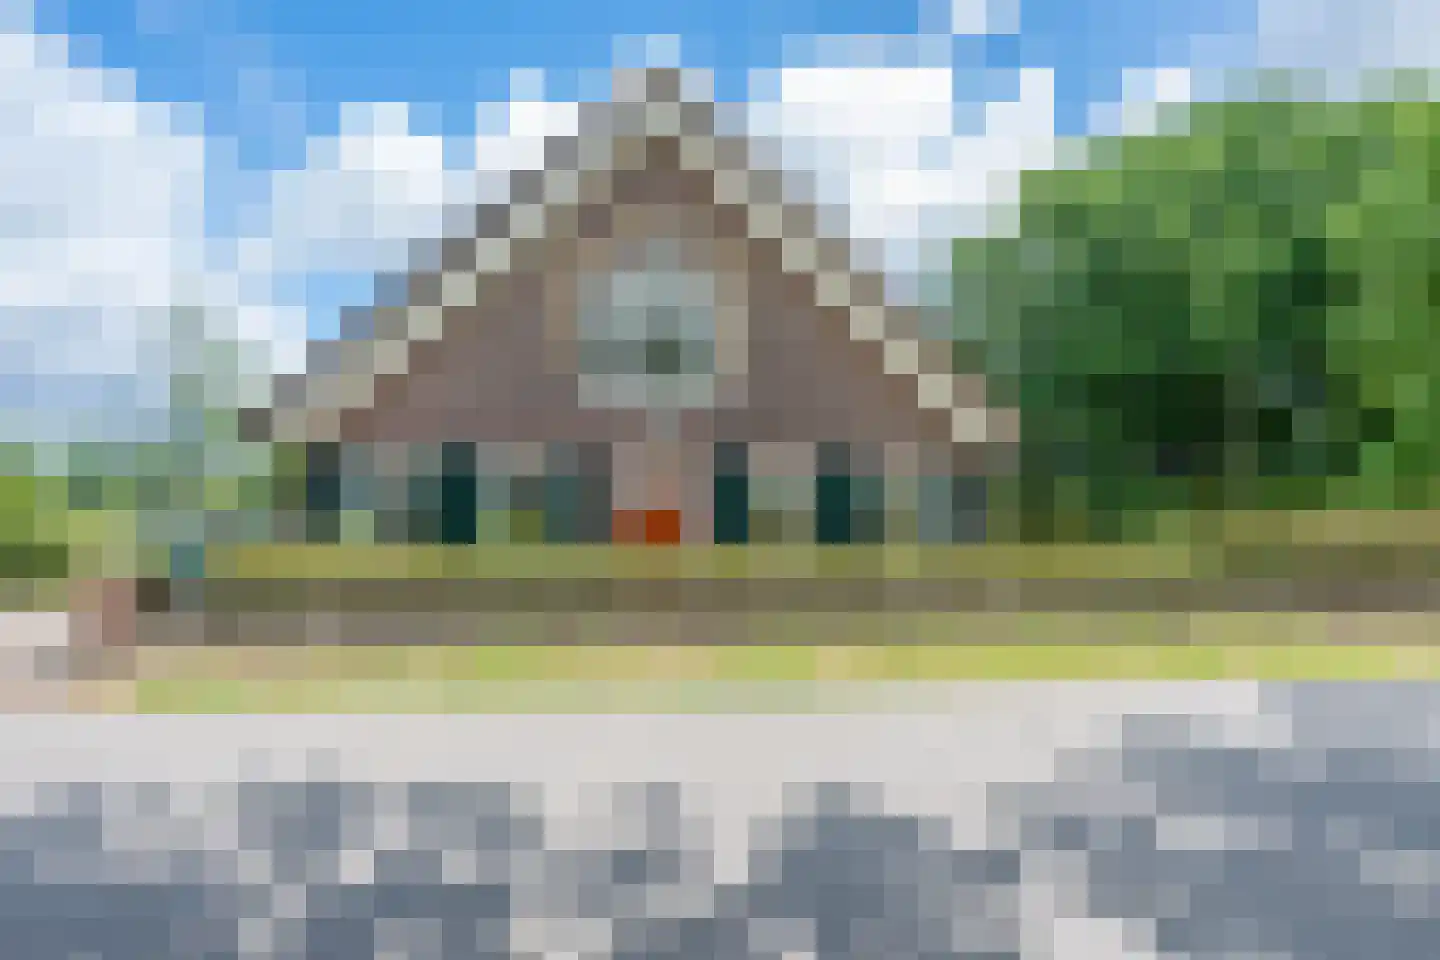
- Available
Waalseweg 84
3999NV Tull en 't Waal
€ 1.850.000 k.k.
€ 5.539/m²
- Living area
- 334 m²
- Land area
- 19050 m²
- Bedrooms
- 5
Searching in 9 houses in Tull en 't Waal
Type to search. Use arrow down and arrow up to navigate through results and press Enter to open.
Hidden search suggestions.
View current properties in Tull en 't Waal or search targeted on street, postal code and property characteristics.
View the current housing stock in Tull en 't Waal and quickly filter by price, living area, rooms and more. There are currently 9 houses in this place within our selection. View also 5 sold houses in Tull en 't Waal for extra insight into the local housing market.
3999NV Tull en 't Waal
€ 1.850.000 k.k.
€ 5.539/m²
3999WK Tull en 't Waal
€ 1.395.000 k.k.
€ 7.010/m²
3999NL Tull en 't Waal
€ 489.000 k.k.
3999NW Tull en 't Waal
€ 2.750 p/m
€ 14/m²
3999NH Tull en 't Waal
€ 569.000 k.k.
€ 4.863/m²
3999NK Tull en 't Waal
€ 450.000 k.k.
€ 5.625/m²
3999NK Tull en 't Waal
€ 525.000 k.k.
€ 4.565/m²
3999NK Tull en 't Waal
€ 519.500 k.k.
€ 5.195/m²
3999NT Tull en 't Waal
€ 895.000 k.k.
€ 4.566/m²
Get free quotes from real estate agents with local market knowledge. Compare more than 107 real estate agents in Tull en 't Waal.
Selling a home in Tull en 't Waal? Compare all real estate agents in Tull en 't Waal or view the top 10 real estate agents in Tull en 't Waal for extra context for your choice.
Real estate agents make sharper offers when they know you're comparing — ask for quotes for sale or purchase.
Practical answers about housing supply, sales and comparing real estate agents in Tull en 't Waal.
The costs of a real estate agent in Tull en 't Waal depend on commission, setup costs, property presentation and the chosen service. Compare the 107 real estate agents in Tull en 't Waal via the real estate agent page and request multiple quotes to compare rates and approach well.
Within our selection, we are currently showing 9 houses in Tull en 't Waal. View also the sold houses in Tull en 't Waal to compare the current offering with recent transactions.
Take into account not only price and living area but also maintenance, energy label, location, outdoor space and sales status. This way you compare houses in Tull en 't Waal on more than just the asking price.
A local real estate agent knows the neighborhoods, recent transactions and demand in Tull en 't Waal. By comparing 107 real estate agents in the region you get a better insight into prices, sales strategy and expected yield; the top 10 in Tull en 't Waal provides a useful starting point.
Yes, when making a sales plan, a valuation in Tull en 't Waal is wise. You gain insight into a realistic asking price and can then compare offers from real estate agents specifically.
View current location data on residents, WOZ development, housing stock, energy consumption, business activity and safety in Tull en 't Waal. In 2025 were there 735 residents. The average WOZ value in 2025 is EUR 626.365.
These figures help to better assess and compare the housing stock in Tull en 't Waal with recent sold homes. Orient yourself then on suitable top real estate agents in Tull en 't Waal for sales advice in this region.
Residents
735
Last year: 2025
Average WOZ
EUR 626.365
Last year: 2025
Average income per person.
EUR 35.818
Source: AllNumbers
Crimes (current year)
10
Total registered
| Year | Residents |
|---|---|
| 2021 | 765 |
| 2022 | 765 |
| 2023 | 770 |
| 2024 | 750 |
| 2025 | 735 |
| Year | Average WOZ |
|---|---|
| 2021 | EUR 452.442 |
| 2022 | EUR 479.977 |
| 2023 | EUR 600.703 |
| 2024 | EUR 613.703 |
| 2025 | EUR 626.365 |
Hoger
160
Praktisch
180
Middelbaar
210
Europa
40
Nederland
670
Buiten Europa
20
Label A
86
Label G
43
Label C
42
Label F
37
Label B
32
Label D
32
Label E
7
Label A++
2
Label A+++
1
Label A+
0
Label A++++
0
Label A+++++
0
| Year | Gas (m3) | Electricity (kWh) |
|---|---|---|
| 2020 | 1.582 | 3.576 |
| 2021 | 1.665 | 3.451 |
| 2022 | 1.268 | 3.207 |
| 2023 | 1.044 | 2.983 |
| 2024 | 1.016 | 3.011 |
Hoekwoning
Gas: 755 • Electricity: 2.293
Huurwoning
Gas: 783 • Electricity: 2.126
Koopwoning
Gas: 1.091 • Electricity: 3.142
Appartement
Gas: 345 • Electricity: 1.659
Tussenwoning
Gas: 690 • Electricity: 2.265
Vrijstaande woning
Gas: 1.259 • Electricity: 3.515
Twee-onder-één-kap woning
Gas: 1.147 • Electricity: 2.993
Total number of company establishments: 145
| Period | Crimes |
|---|---|
| jan 2026 | 0 |
| jul 2025 | 2 |
| jun 2025 | 1 |
| mei 2025 | 0 |
| mrt 2025 | 0 |
| mrt 2026 | 1 |
| nov 2024 | 0 |
| nov 2025 | 0 |
| okt 2024 | 1 |
| okt 2025 | 0 |
| sep 2024 | 0 |
| sep 2025 | 0 |
These figures give an indicative picture of safety trends in the living environment of Tull en 't Waal.
Short answers based on current local statistics, handy for a quick comparison of the living environment.
Tull en 't Waal telt in 2025 ongeveer 735 inwoners.
De gemiddelde WOZ-waarde in Tull en 't Waal is in 2025 circa € 626.365.
Het gemiddelde inkomen per inwoner in Tull en 't Waal ligt rond € 35.818 per jaar.
Voor het huidige jaar gaat het om ongeveer 10 geregistreerde misdrijven. Gebruik deze cijfers als indicatie en vergelijk trends per periode.
In Tull en 't Waal komt vooral "Vrijstaande woningen" veel voor, met ongeveer 154 woningen.