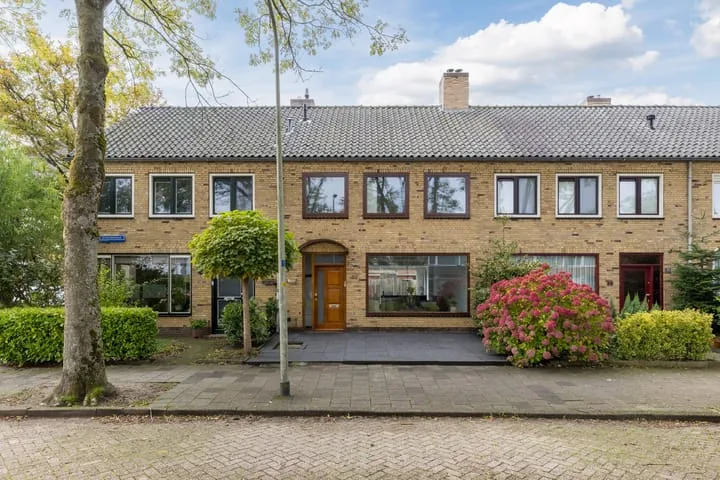
- Sold
Colijnlaan 188
1421CD Uithoorn
€ 650.000 k.k.
€ 7.065/m²
- Living area
- 92 m²
- Land area
- 305 m²
- Bedrooms
- 2
View 231 sold houses in Uithoorn
Type to search. Use arrow down and arrow up to navigate through results and press Enter to open.
Hidden search suggestions.
Compare sold homes in Uithoorn or view the current offering in this location directly.
On this page you will find recently sold homes in Uithoorn. Use this overview to better estimate selling prices, popular neighborhoods, and the local housing supply before you choose a real estate agent. Also view the current housing supply with 338 houses in Uithoorn.
1421CD Uithoorn
€ 650.000 k.k.
€ 7.065/m²
1422BJ Uithoorn
€ 550.000 k.k.
€ 3.666/m²
1423CC Uithoorn
€ 500.000 k.k.
€ 6.097/m²
1421KB Uithoorn
€ 495.000 k.k.
€ 4.459/m²
1422BZ Uithoorn
€ 575.000 k.k.
€ 5.637/m²
1422ZH Uithoorn
€ 1.343.000 k.k.
€ 4.631/m²
1422LA Uithoorn
€ 495.000 k.k.
€ 5.322/m²
1422JJ Uithoorn
€ 489.000 k.k.
€ 4.215/m²
1422RX Uithoorn
€ 475.000 k.k.
€ 4.166/m²
1421KH Uithoorn
€ 480.000 k.k.
€ 5.333/m²
1422KL Uithoorn
€ 475.000 k.k.
€ 4.060/m²
1422KN Uithoorn
€ 475.000 k.k.
€ 3.653/m²
1422NL Uithoorn
€ 375.000 k.k.
€ 4.464/m²
1421XX Uithoorn
€ 435.000 k.k.
€ 6.041/m²
1422NT Uithoorn
€ 315.000 k.k.
€ 5.833/m²
1423NH Uithoorn
€ 719.000 k.k.
€ 5.027/m²
1422SK Uithoorn
€ 535.000 k.k.
€ 4.246/m²
1423DL Uithoorn
€ 490.000 k.k.
€ 4.711/m²
1422LC Uithoorn
€ 545.000 k.k.
€ 4.037/m²
1422BX Uithoorn
€ 485.000 k.k.
€ 5.511/m²
1422XT Uithoorn
€ 700.000 k.k.
€ 7.446/m²
1421LE Uithoorn
€ 650.000 k.k.
€ 5.200/m²
1422AA Uithoorn
€ 650.000 k.k.
€ 5.200/m²
1422CX Uithoorn
€ 525.000 k.k.
€ 4.338/m²
1421CE Uithoorn
€ 250.000 k.k.
€ 5.208/m²
1422AV Uithoorn
€ 490.000 k.k.
€ 4.803/m²
1422DG Uithoorn
€ 595.000 k.k.
€ 4.648/m²
1422BJ Uithoorn
€ 525.000 k.k.
€ 4.565/m²
Get free quotes from realtors with local market knowledge in Uithoorn.
Selling a home in Uithoorn? Compare real estate agents who know the local housing market. Also check out all real estate agents in Uithoorn or the top 10 real estate agents in Uithoorn for extra context for your choice.
By comparing brokers and requesting quotes
Short answers about housing prices, sold homes and comparing real estate agents in Uithoorn.
The costs of a real estate agent in Uithoorn vary per office, property type and sales approach. Therefore, compare multiple quotes and also look at the real estate agents in Uithoorn to better compare rates, presentation and local experience.
On this page we currently show 231 sold houses in Uithoorn from our selection. This helps you to better assess recent transactions and the local housing market.
Houses sold in Uithoorn give insight into asking prices, house types and neighborhoods where recent transactions have taken place. Compare this also with the current housing stock in Uithoorn to better understand the market.
You can use sold homes as a first market indication, but a local real estate agent can better take into account finishing, location, maintenance and current demand in Uithoorn.
Compare realtors in Uithoorn on local sales experience, reviews, expected yield, commission and marketing approach. The top 10 realtors in Uithoorn helps to quickly discover strong offices.
View current location data on residents, WOZ development, housing stock, energy consumption, business activity and safety in Uithoorn. In 2025 were there 27.005 residents. The average WOZ value in 2025 is EUR 449.295.
These figures help to better assess and compare the housing stock in Uithoorn with recent sold homes. Orient yourself then on suitable top real estate agents in Uithoorn for sales advice in this region.
Residents
27.005
Last year: 2025
Average WOZ
EUR 449.295
Last year: 2025
Average income per person.
EUR 34.391
Source: AllNumbers
Crimes (current year)
893
Total registered
| Year | Residents |
|---|---|
| 2021 | 25.720 |
| 2022 | 26.380 |
| 2023 | 26.655 |
| 2024 | 26.860 |
| 2025 | 27.005 |
| Year | Average WOZ |
|---|---|
| 2021 | EUR 327.857 |
| 2022 | EUR 358.896 |
| 2023 | EUR 420.144 |
| 2024 | EUR 426.670 |
| 2025 | EUR 449.295 |
Hoger
6.920
Praktisch
4.920
Middelbaar
7.770
Europa
2.650
Nederland
16.690
Buiten Europa
7.660
Label C
3.733
Label A
3.297
Label B
1.904
Label E
1.093
Label D
840
Label F
394
Label A+++
245
Label G
208
Label A+
204
Label A++
190
Label A++++
79
Label A+++++
2
| Year | Gas (m3) | Electricity (kWh) |
|---|---|---|
| 2020 | 1.117 | 2.704 |
| 2021 | 1.218 | 2.784 |
| 2022 | 940 | 2.589 |
| 2023 | 828 | 2.448 |
| 2024 | 804 | 2.515 |
Hoekwoning
Gas: 978 • Electricity: 2.878
Huurwoning
Gas: 707 • Electricity: 1.960
Koopwoning
Gas: 909 • Electricity: 2.781
Appartement
Gas: 650 • Electricity: 1.714
Tussenwoning
Gas: 824 • Electricity: 2.596
Vrijstaande woning
Gas: 1.695 • Electricity: 4.279
Twee-onder-één-kap woning
Gas: 1.232 • Electricity: 3.555
Total number of company establishments: 3.485
| Period | Crimes |
|---|---|
| jan 2025 | 80 |
| jan 2026 | 66 |
| jul 2025 | 78 |
| jun 2025 | 79 |
| mei 2025 | 60 |
| mrt 2025 | 71 |
| nov 2024 | 82 |
| nov 2025 | 72 |
| okt 2024 | 88 |
| okt 2025 | 75 |
| sep 2024 | 103 |
| sep 2025 | 80 |
These figures give an indicative picture of safety trends in the living environment of Uithoorn.
Short answers based on current local statistics, handy for a quick comparison of the living environment.
Uithoorn telt in 2025 ongeveer 27.005 inwoners.
De gemiddelde WOZ-waarde in Uithoorn is in 2025 circa € 449.295.
Het gemiddelde inkomen per inwoner in Uithoorn ligt rond € 34.391 per jaar.
Voor het huidige jaar gaat het om ongeveer 893 geregistreerde misdrijven. Gebruik deze cijfers als indicatie en vergelijk trends per periode.
In Uithoorn komt vooral "Tussenwoningen" veel voor, met ongeveer 5.621 woningen.