
Residents
1.310
Last year: 2025
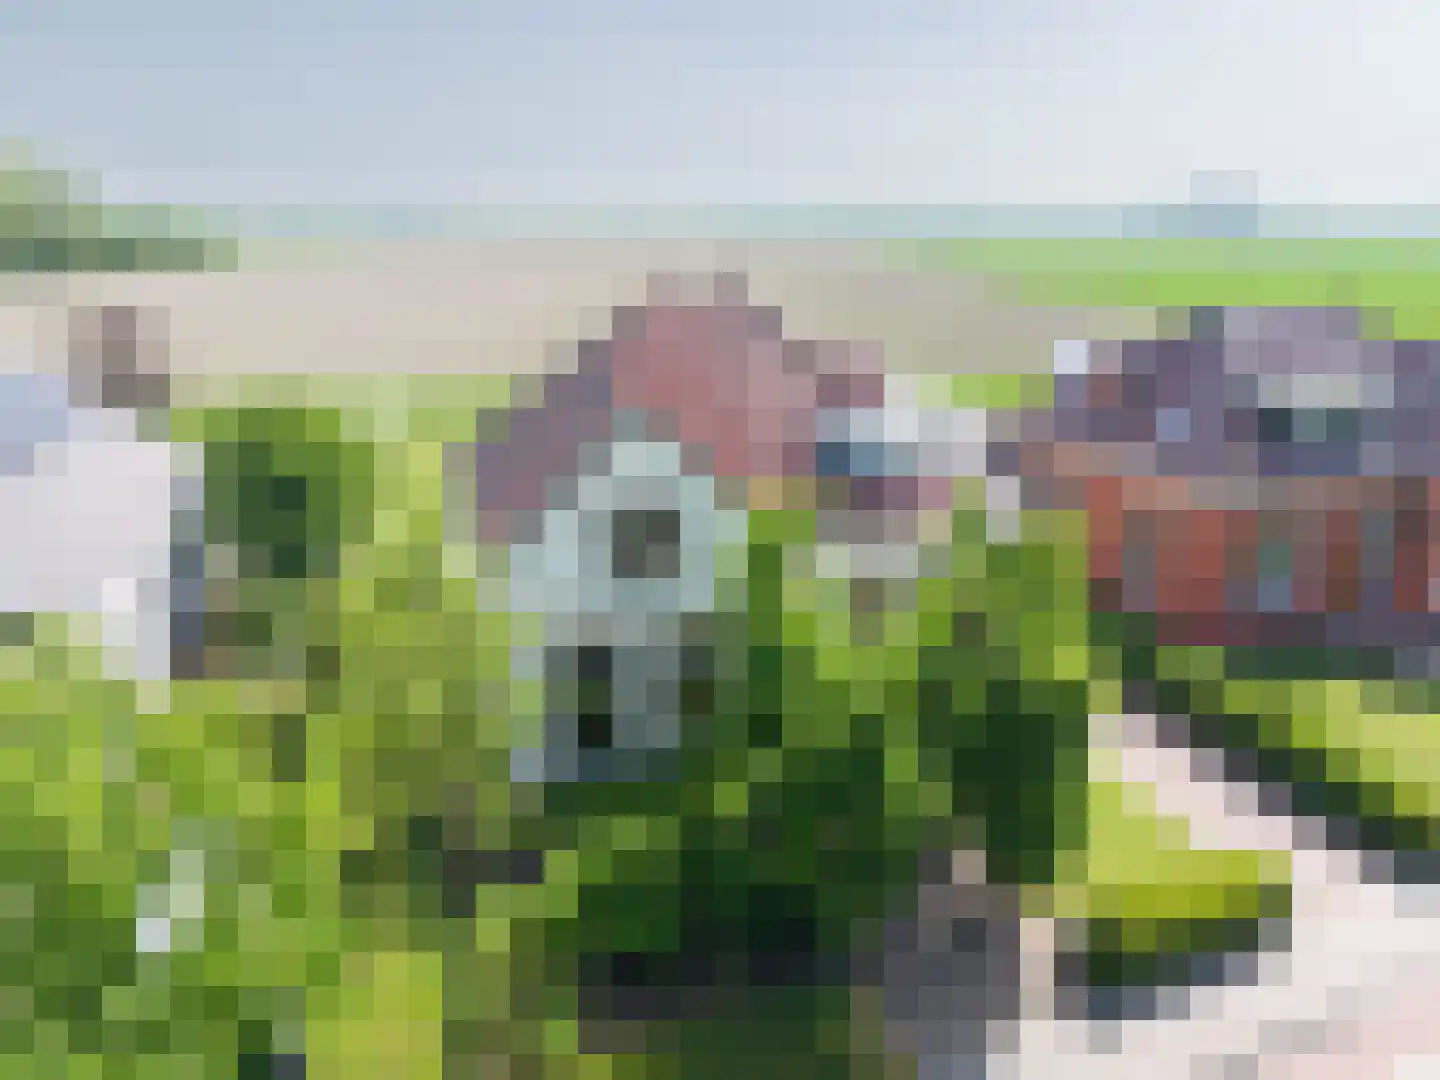
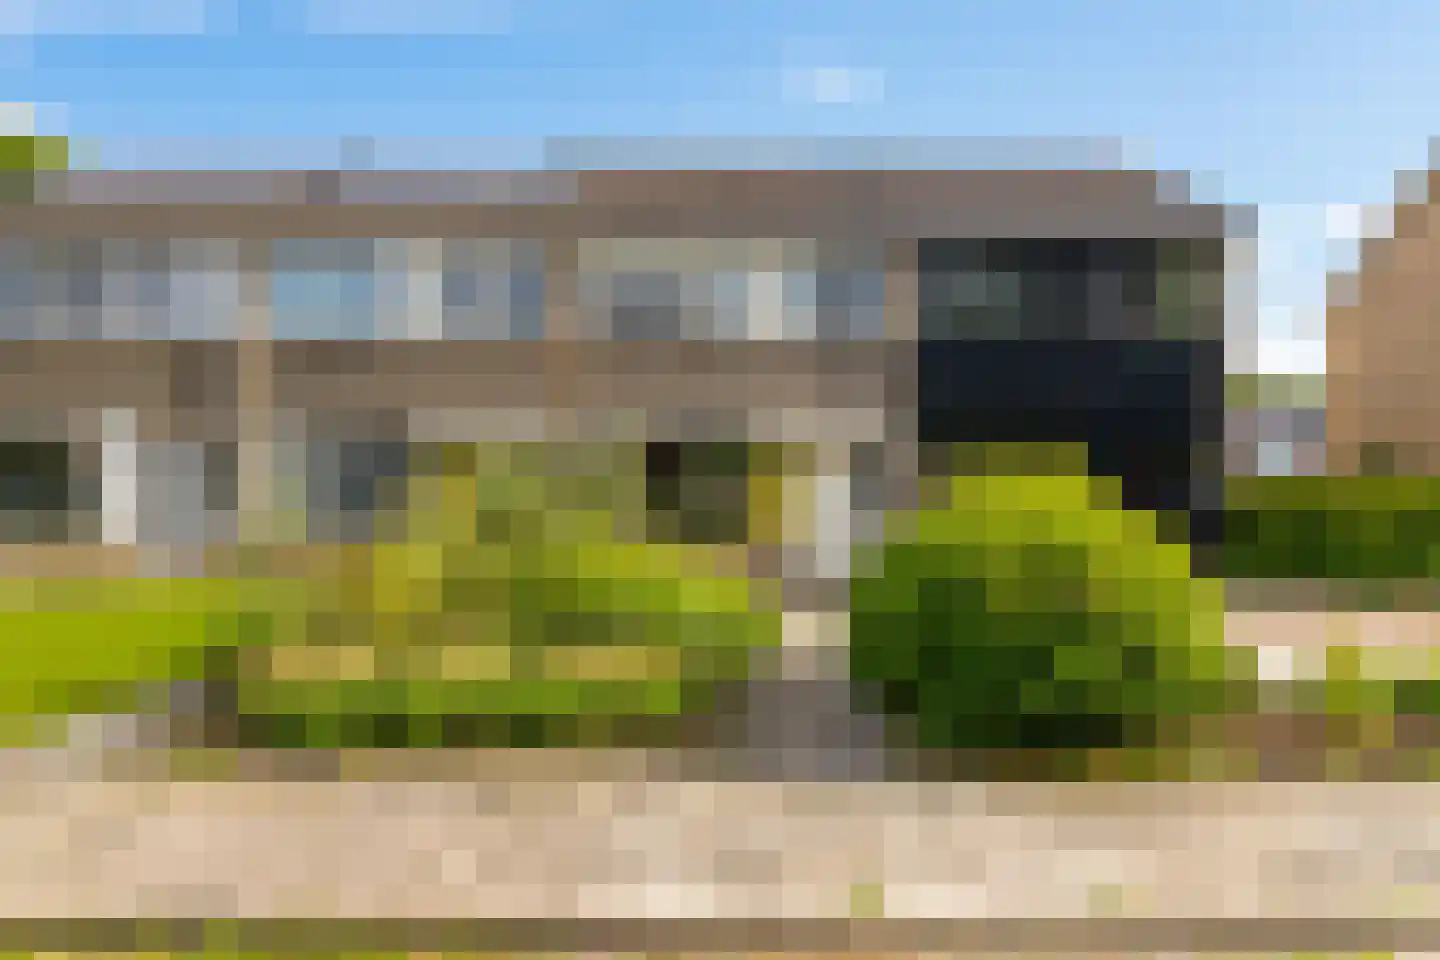
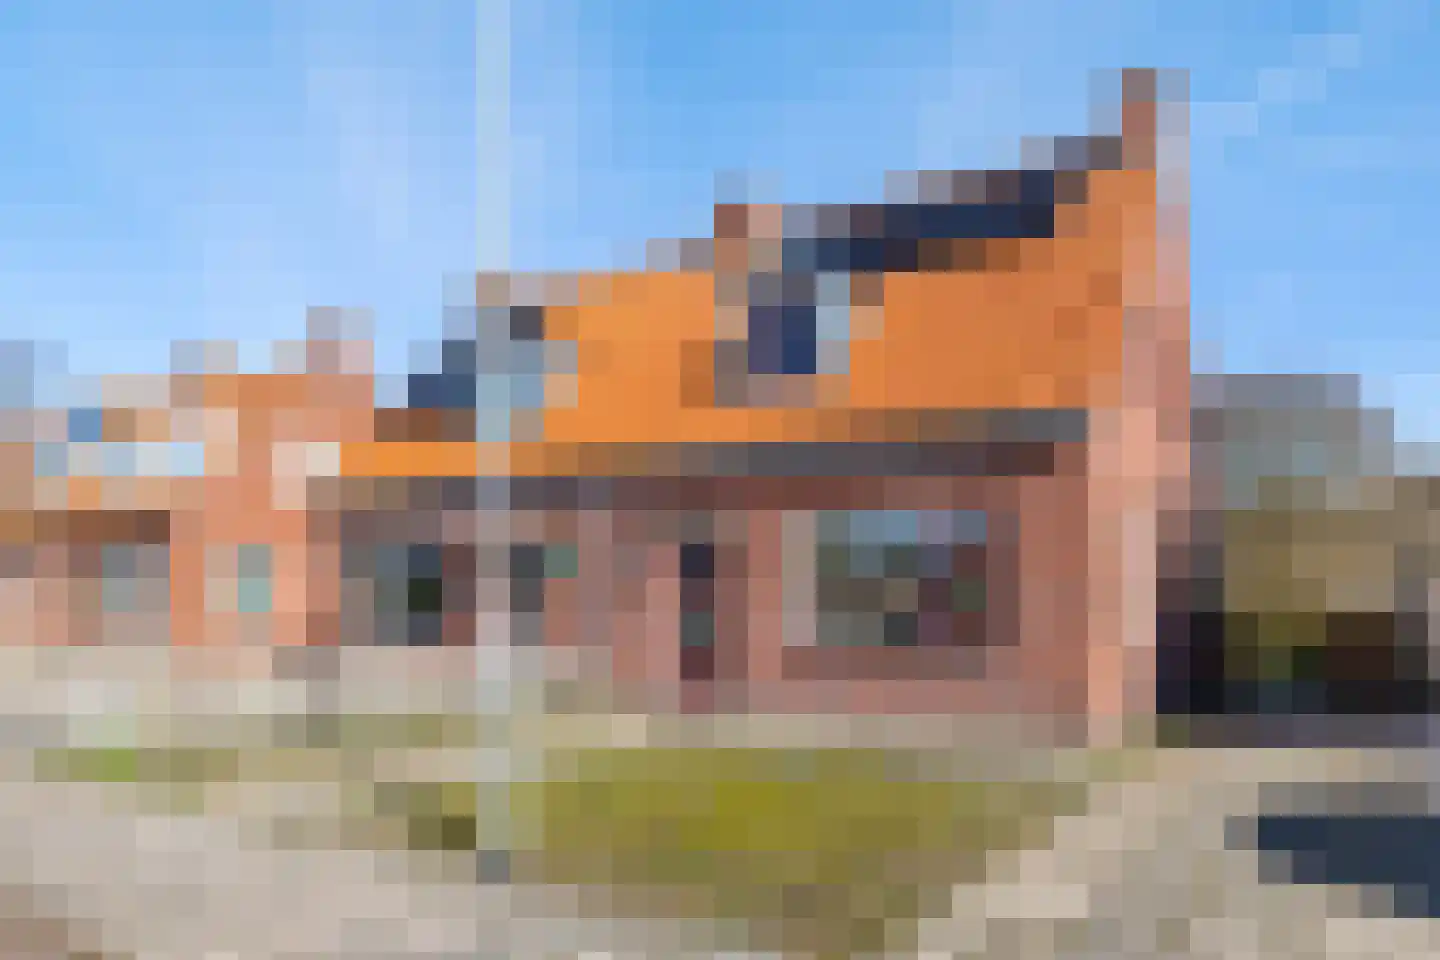
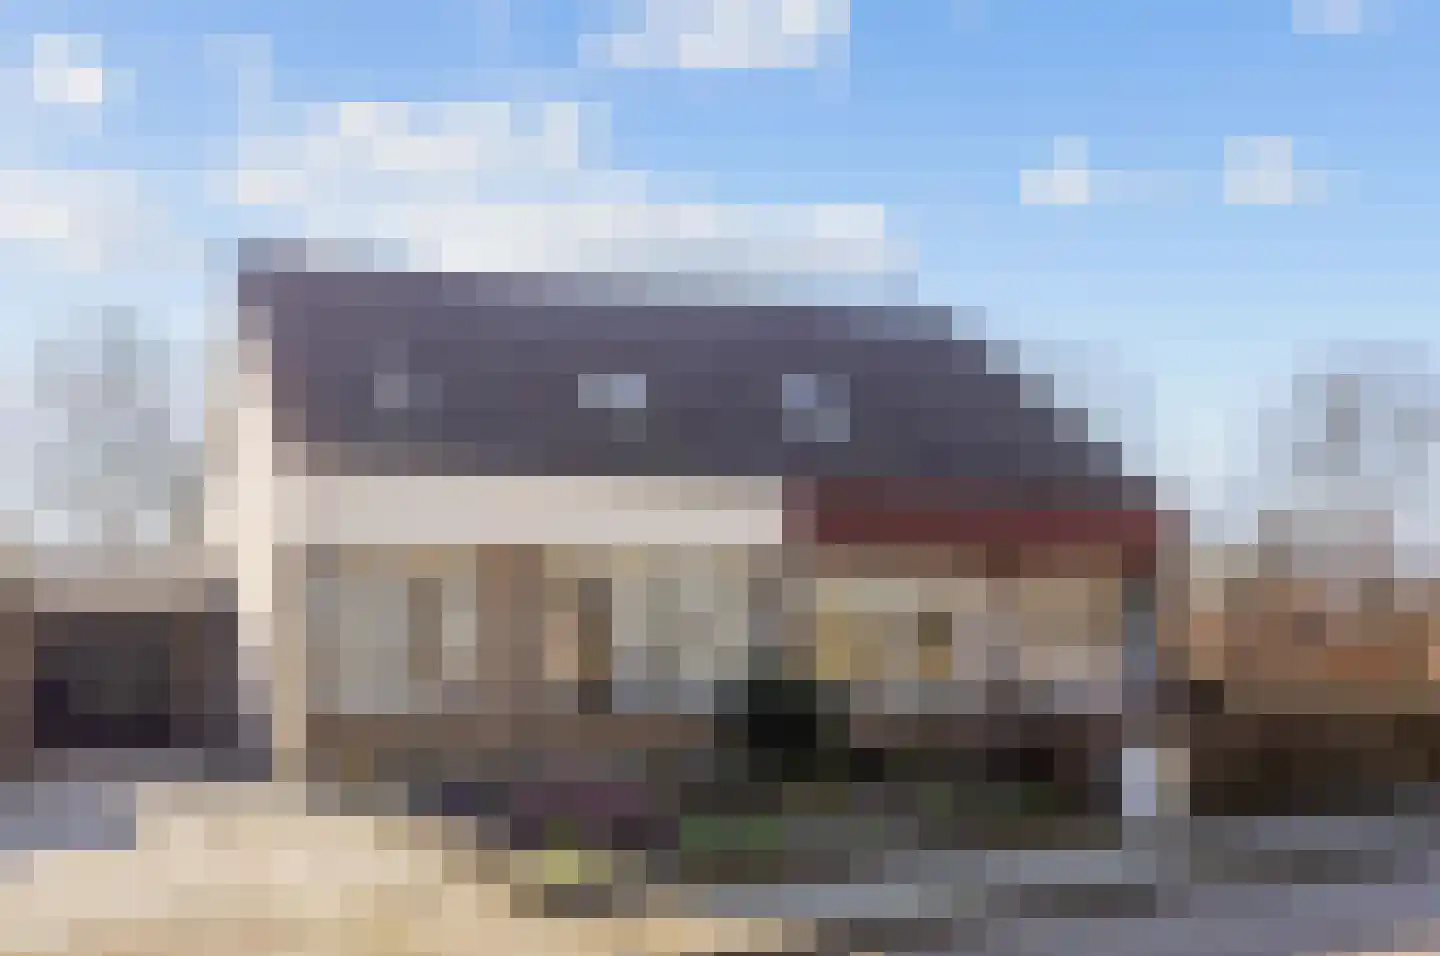
9971CC Ulrum • Groningen
€ 245.000 k.k.
Cost of copper (estimated): € 6.750
2% transfer tax (€ 4.900) + notary (€ 1.150) + valuation (€ 700)
Total incl. VAT: € 251.750
Purchase price /m²: € 2.025
Aan een rustige straat in het mooie Ulrum, met nagenoeg uitsluitend bestemmingsverkeer staat deze goed onderhouden helft van een dubbel woonhuis. Een woning die je bij binnenkomst direct verrast door de hoeveelheid licht en de royale uitbreiding aan de achterzijde. Hier is comfortabel wonen gecombineerd met praktische extra ruimte. Ideaal voor zowel gezinnen als thuiswerkers. De woning is aan de achterzijde fors uitgebouwd, wat heeft geresulteerd in een fraaie hobbykamer, een ruime bijkeuken en een lichte serre. Deze multifunctionele ruimtes bieden volop mogelijkheden om deze naar eigen wens verder te optimaliseren.. Denk aan een werkplek aan huis, een praktijkruimte of – met enkele aanpassingen – een levensloopbestendige indeling op de begane grond. Daartoe hoeft alleen nog een badkamer gerealiseerd te worden. De uitbreiding is bovendien voorzien van vloerverwarming, wat het comfort aanzienlijk verhoogt. De Z-vormige woonkamer is aangenaam licht en sfeervol, mede dankzij de grote raampartijen en de lichte afwerking. De houtkachel vormt een warm middelpunt en draagt bij aan een gezellige woonbeleving. De inrichting is verzorgd en uitgevoerd in neutrale, lichte kleurstellingen, waardoor de woning een rustige en toegankelijke uitstraling heeft. Op de verdieping bevinden zich drie ruime slaapkamers, waarmee deze woning zich uitstekend leent als gezinswoning. Daarnaast is de woning voorzien van een kunststof dakkapel en kunststof kozijnen met HR++ beglazing, wat bijdraagt aan zowel comfort als energiezuinigheid. Ook zijn er drie zonnecollectoren aanwezig. De tuin is een absoluut pluspunt: gelegen op het zuiden én westen, waardoor je vrijwel de hele dag van de zon kunt genieten. Tegelijkertijd is er direct achter de woning ook een fijne plek in de schaduw, ideaal voor warme zomerdagen. Verder biedt het perceel praktische bergruimte en zijn er mogelijkheden voor het houden van dieren (denk bijvoorbeeld aan kennelfaciliteiten), dankzij de aanwezige dierenverblijven. Parkeergelegenheid is op korte afstand aanwezig en de ligging in een rustige straat maakt het geheel bijzonder prettig voor wie comfortabel en ontspannen wil wonen. Ulrum is een zeer fijn dorp om te wonen. Met een gemêleerd inwonersbestand en een gemoedelijke no-nonsense cultuur, biedt Ulrum een aangenaam woonklimaat. De omgeving leent zich prima voor mooie fiets- en wandeltochten, tochten te paard en recreatieve mogelijkheden en watersport. Dit perceel is namelijk op fietsafstand gelegen van het prachtige Lauwersmeergebied. Een uitgestrekt natuurgebied van een fantastische schoonheid. Ulrum is ook aantrekkelijk voor de maritieme hobbyist. Via prachtig meanderende vaarwegen komt je uit op "het Reitdiep". Deze mondt via Zoutkamp en Lauwersoog in het Waddengebied uit. Indeling: Begane grond: Entree/hal, toilet, Z-vormige woonkamer (ca. 29m²) voorzien van een vaste kast en houtkachel, keuken (ca. 9m²) voorzien van een eenvoudige keukenopstelling met een vaatwasser, 4-pits gaskookplaat en wasemkap, fraaie tuinkamer (ca. 9m²) voorzien van openslaande deuren en dakkoepel, functionele bijkeuken (ca. 10m²) en hobbykamer (ca. 15m²); Eerste verdieping: Overloop, drie slaapkamers (resp. ca. 12m, 12m² voorzien van dakkapel en 5m²) en badkamer (ca. 5m²) voorzien van ligbad, douche en vaste wastafel; Vliering: Bergruimte met opstelplaats voor Atag HR combiketel (2017) en tevens te bereiken middels vlizotrap. Half houten berging (ca. 12m²) voorzien van elektra Overkapping (6,50 x 3,75mtr)
€ 245.000
Cost of copper (estimated): € 6.750
2% transfer tax (€ 4.900) + notary (€ 1.150) + valuation (€ 700)
Total purchase (incl. p.p.): € 251.750
3,07%
Yearly
€ 12.250
Direct available
Estimated mortgage
Indicative gross monthly cost
Based on annuity and 30 year term
Indicative net monthly cost
iDisclaimer: this mortgage calculation is a simplified indication based on general assumptions. No rights can be derived from the results shown. Calculated with 10-annual interest (met NHG), automatically determined based on the price limit € 470.000. Source: 10-jaars rente uit mortgage_rates (12-06-2026 03:45).
Douche, ligbad, en wastafel
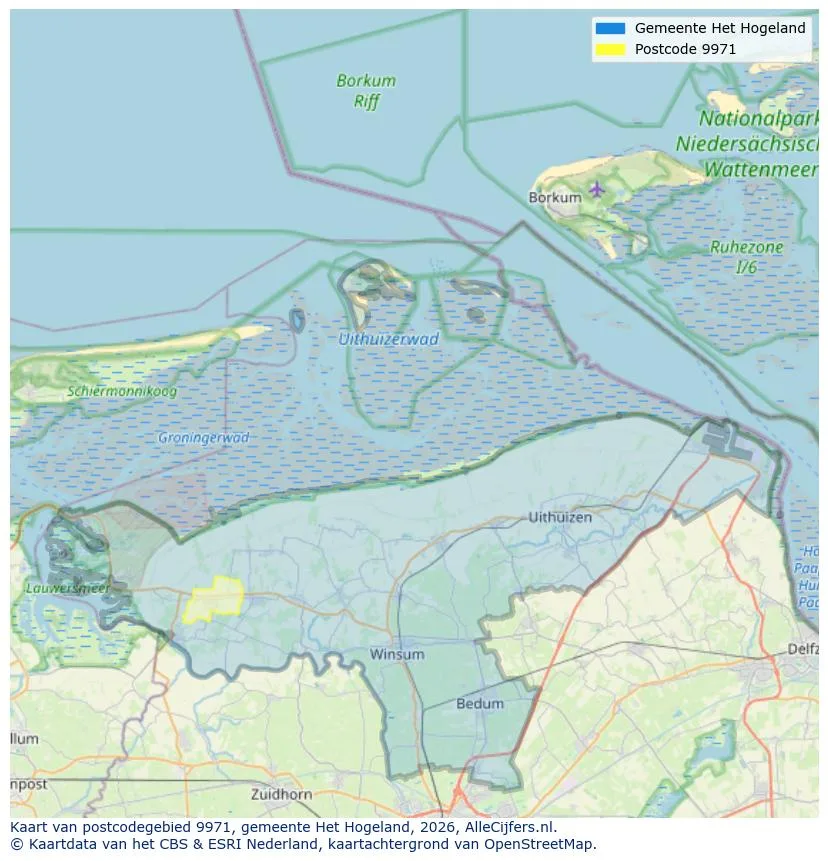
Geographic orientation and real estate agent density in Ulrum
View current location data on residents, WOZ development, housing stock, energy consumption, business activity and safety in Ulrum. In 2025 were there 1.310 residents. The average WOZ value in 2025 is EUR 205.000.
Residents
1.310
Last year: 2025
Average WOZ
EUR 205.000
Last year: 2025
Average income per person.
EUR 25.000
Source: AllNumbers
Crimes (current year)
33
Total registered
| Year | Residents |
|---|---|
| 2021 | 1.280 |
| 2022 | 1.300 |
| 2023 | 1.330 |
| 2024 | 1.315 |
| 2025 | 1.310 |
| Year | Average WOZ |
|---|---|
| 2021 | EUR 142.853 |
| 2022 | EUR 153.000 |
| 2023 | EUR 180.000 |
| 2024 | EUR 189.000 |
| 2025 | EUR 205.000 |
Hoger
150
Praktisch
330
Middelbaar
500
Europa
90
Nederland
1.145
Buiten Europa
75
Label C
196
Label G
178
Label B
80
Label D
73
Label A
67
Label F
58
Label E
33
Label A+
4
Label A+++
1
Label A++++
1
Label A++
0
Label A+++++
0
| Year | Gas (m3) | Electricity (kWh) |
|---|---|---|
| 2020 | 1.484 | 2.695 |
| 2021 | 1.703 | 2.755 |
| 2022 | 1.260 | 2.570 |
| 2023 | 1.090 | 2.480 |
| 2024 | 1.060 | 2.510 |
Hoekwoning
Gas: 990 • Electricity: 2.100
Huurwoning
Gas: 950 • Electricity: 2.030
Koopwoning
Gas: 1.170 • Electricity: 2.750
Appartement
Gas: 850 • Electricity: 1.710
Tussenwoning
Gas: 940 • Electricity: 2.070
Vrijstaande woning
Gas: 1.280 • Electricity: 3.060
Twee-onder-één-kap woning
Gas: 1.030 • Electricity: 2.350
Total number of company establishments: 140
| Period | Crimes |
|---|---|
| jan 2025 | 8 |
| jan 2026 | 1 |
| jul 2025 | 4 |
| jun 2025 | 1 |
| mei 2025 | 2 |
| mrt 2025 | 5 |
| nov 2024 | 3 |
| nov 2025 | 3 |
| okt 2024 | 1 |
| okt 2025 | 3 |
| sep 2024 | 1 |
| sep 2025 | 2 |
These figures give an indicative picture of safety trends in the living environment of Ulrum.
Short answers based on current local statistics, handy for a quick comparison of the living environment.
Ulrum telt in 2025 ongeveer 1.310 inwoners.
De gemiddelde WOZ-waarde in Ulrum is in 2025 circa € 205.000.
Het gemiddelde inkomen per inwoner in Ulrum ligt rond € 25.000 per jaar.
Voor het huidige jaar gaat het om ongeveer 33 geregistreerde misdrijven. Gebruik deze cijfers als indicatie en vergelijk trends per periode.
In Ulrum komt vooral "Vrijstaande woningen" veel voor, met ongeveer 266 woningen.
View more homes in this location.

9971CV Ulrum
€ 275.000 k.k.
€ 2.619/m²
9971BA Ulrum
€ 475.000 k.k.
€ 3.369/m²
9971AE Ulrum
€ 195.000 k.k.
€ 1.857/m²

9971CX Ulrum
€ 175.000 k.k.
€ 2.500/m²
9971AN Ulrum
€ 199.500 k.k.
€ 2.771/m²
9971AP Ulrum
€ 245.000 k.k.
€ 2.450/m²

9971AD Ulrum
€ 199.500 k.k.
€ 2.347/m²

9971CV Ulrum
€ 175.000 k.k.
€ 2.464/m²
