Residents
39.445
Last year: 2025
3443XA Woerden • Utrecht
€ 419.000 k.k.
Cost of copper (estimated): € 10.230
2% transfer tax (€ 8.380) + notary (€ 1.150) + valuation (€ 700)
Total incl. VAT: € 429.230
Purchase price /m²: € 4.872
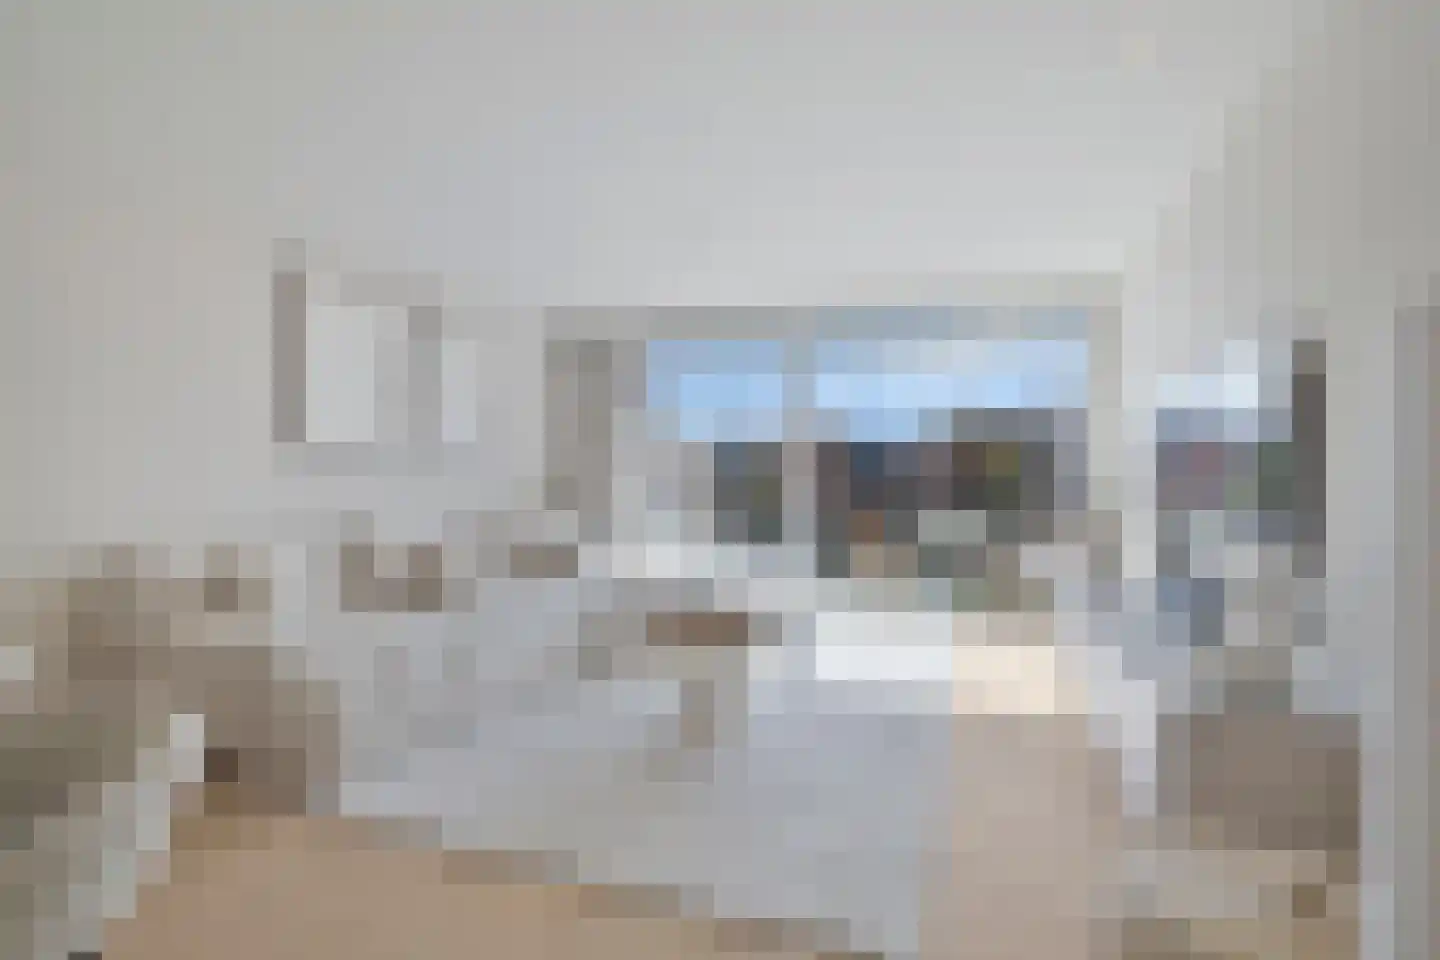
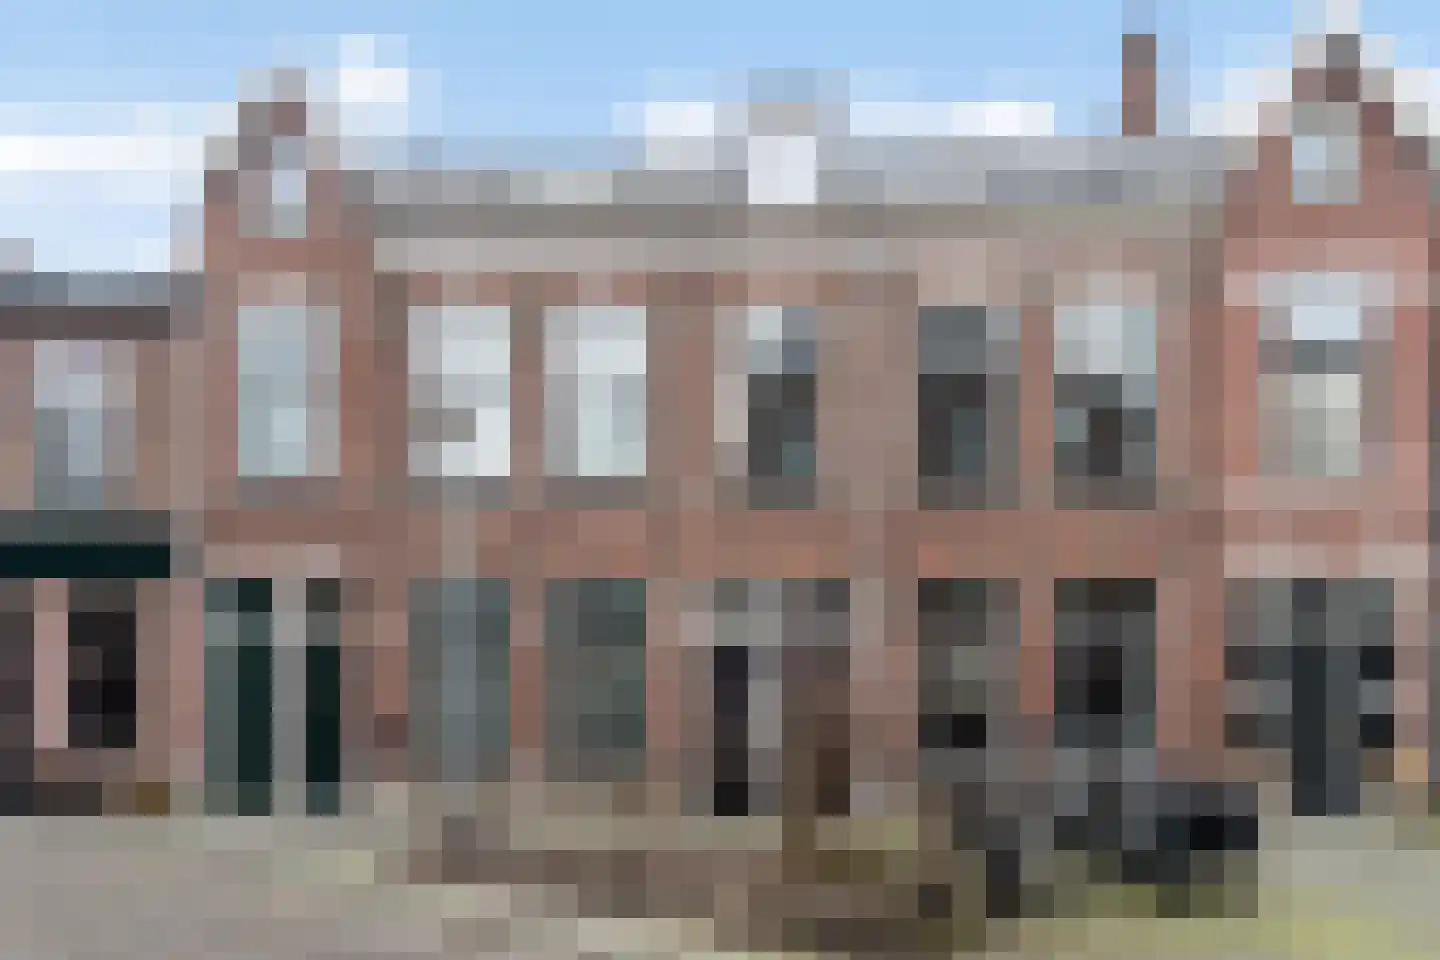
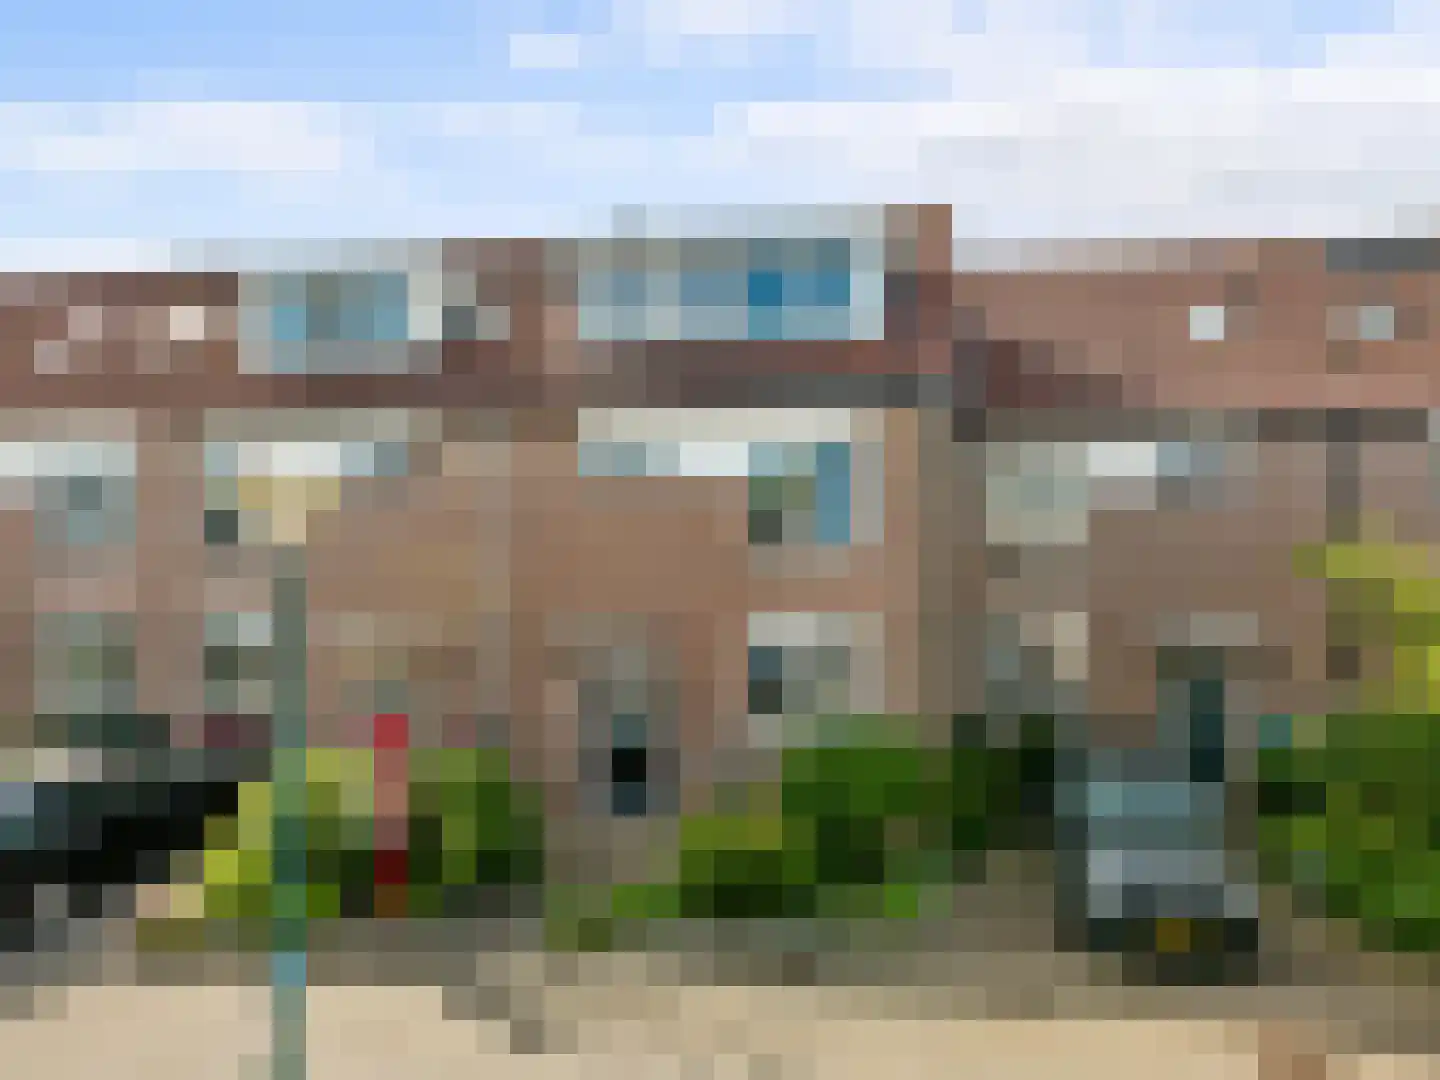
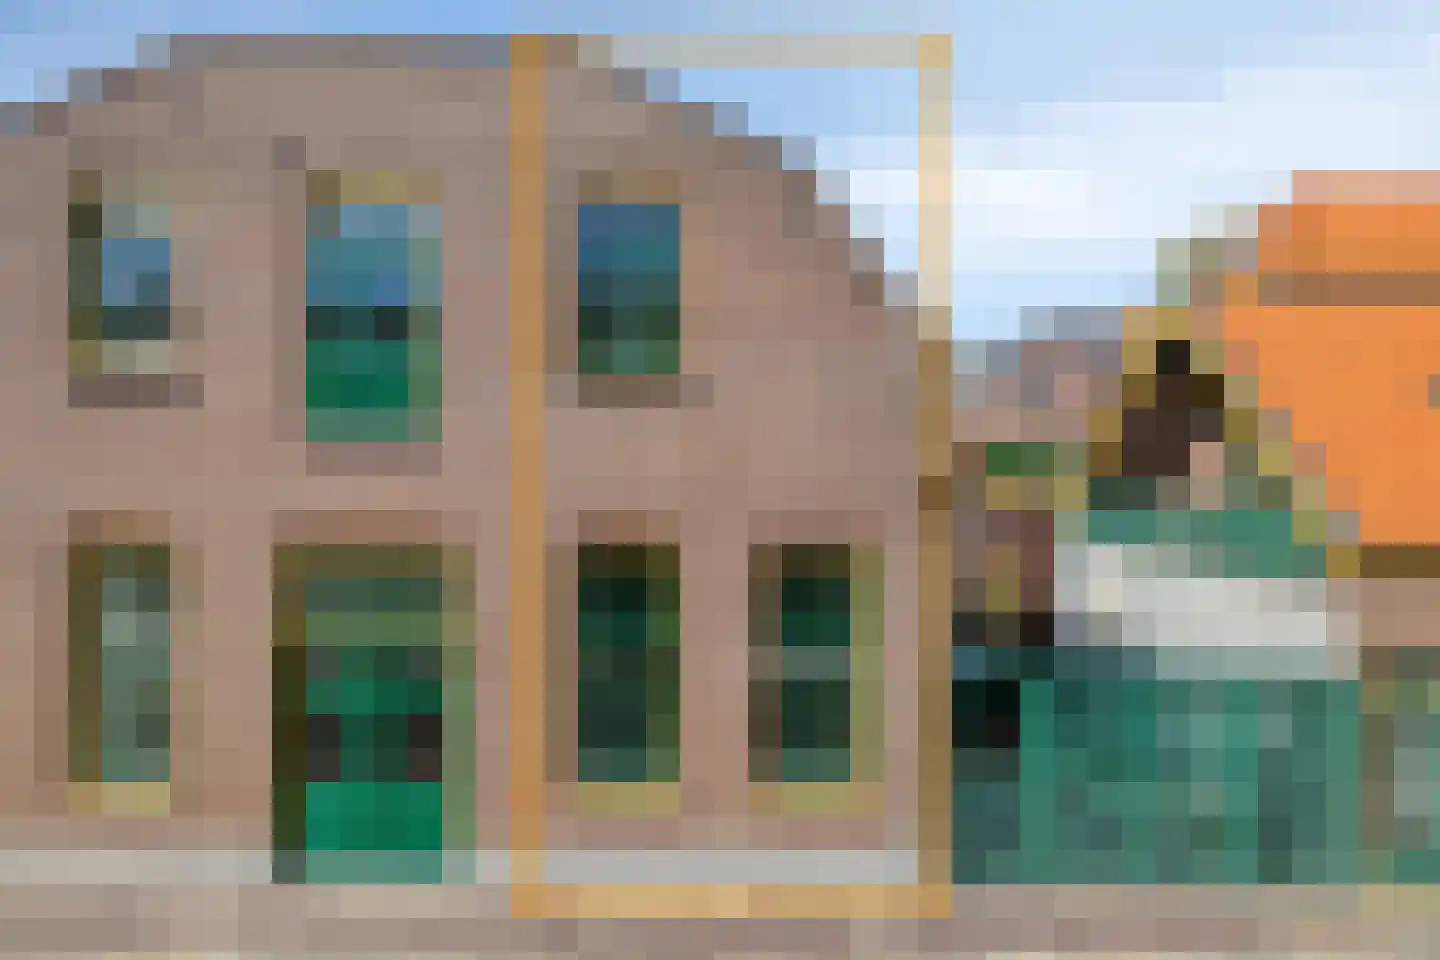
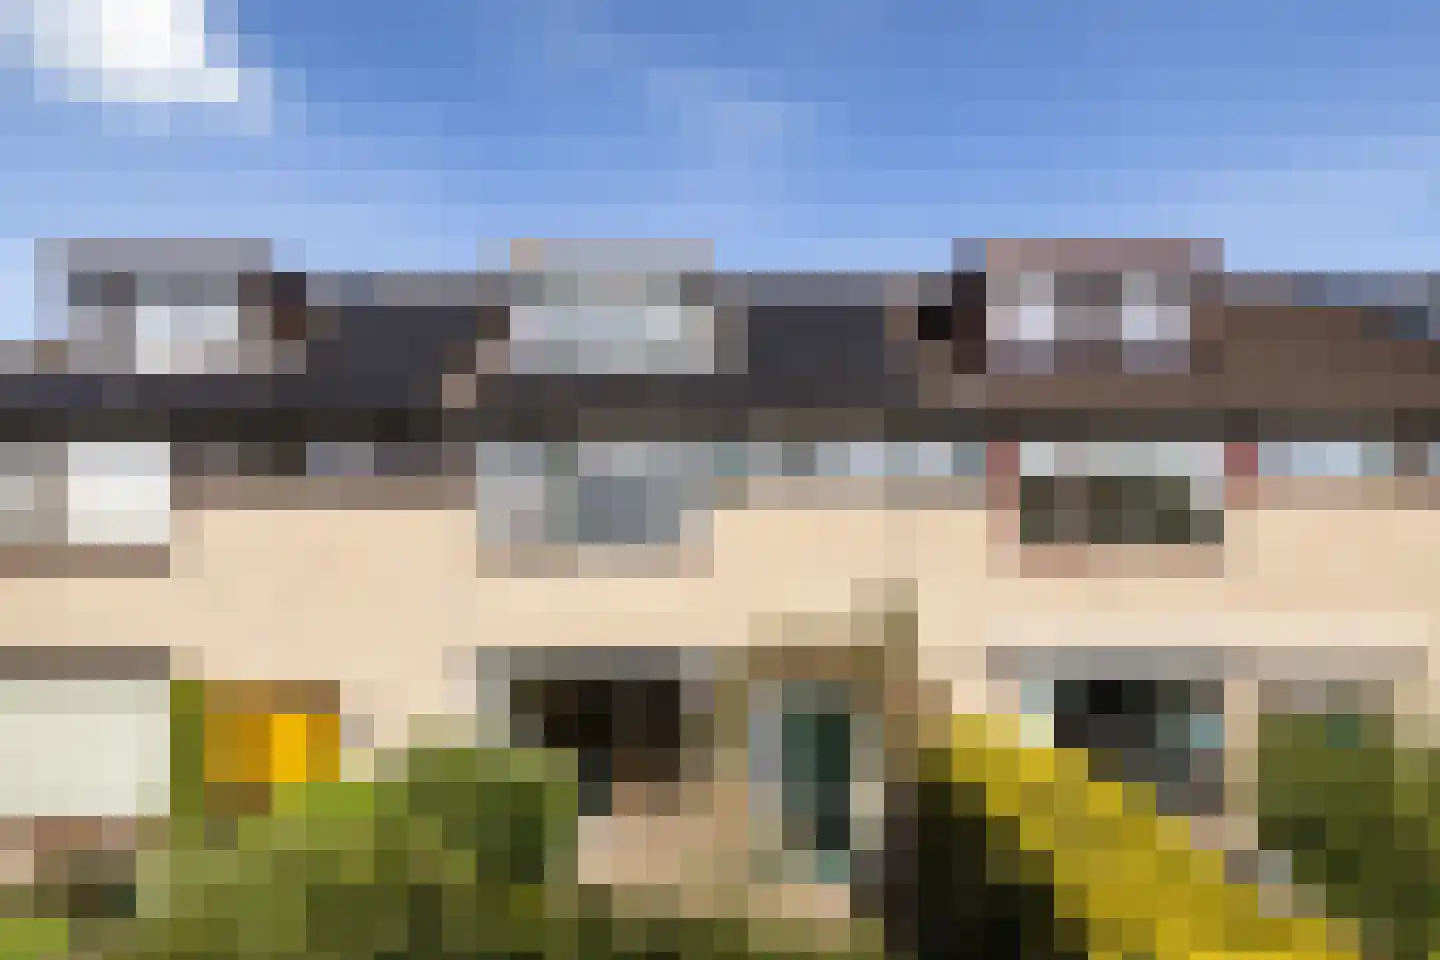
Wonen op een heerlijke plek langs de Oude Rijn, met een prachtig uitzicht! Deze sfeervolle en volledig modern afgewerkte maisonnette met zonnig dakterras ligt op een unieke locatie langs de Oude Rijn. De woning bevindt zich in een kleinschalig appartementencomplex en biedt een heerlijke woonbeleving, verdeeld over twee verdiepingen. De woning onderscheidt zich direct door de grote raampartijen, de eigentijdse afwerking en de royale buitenruimtes: zowel het balkon als het ruime dakterras liggen op het zuiden en bieden een vrij en weids uitzicht over de Oude Rijn. Daarnaast beschikt de woning over een eigen parkeerplaats op het naastgelegen terrein. In de omgeving zijn tevens oplaadmogelijkheden voor een elektrische auto aanwezig. De ligging aan Het Rietveld zorgt voor een goede verbinding richting Zegveld en Bodegraven, terwijl alle voorzieningen van Woerden op korte afstand bereikbaar zijn. Zo kunt u gemakkelijk naar de stad wandelen en naar het station fietsen om bijvoorbeeld de trein naar Utrecht te nemen. Indeling Begane grond Representatieve complexentree met toegang tot de berging en parkeergelegenheid op eigen terrein. Via de trap bereikt u de entree van de woning. Eerste verdieping Entree met toegang tot de toiletruimte met sanibroyeurtoilet en fontein. Hier bevindt zich ook de eerste slaapkamer, waar tevens aansluitingen aanwezig zijn voor een wasmachine en droger. Deze kamer beschikt verder over mooie inbouwkasten, die in het hele huis in dezelfde kleur zijn uitgevoerd. De lichte en sfeervolle woonkamer is aan de achterzijde gelegen en voorzien van een fraaie visgraatvloer. De woonkamer beschikt over airconditioning. Onder de trap bevindt zich een praktische trapkast. Via de schuifpui stapt u direct het balkon op aan de Rijnzijde, dat is voorzien van elektrische zonwering. De luxe keuken is eind 2023 vernieuwd en een echte eyecatcher. De keuken is volledig uitgerust met hoogwaardige Siemens-inbouwapparatuur, waaronder een koelkast, vriezer, wijnklimaatkast, Bora-kookplaat, vaatwasser en combi-oven. De apparatuur is bovendien op afstand te bedienen via een smartphone. Een stijlvolle bar maakt de keuken compleet als gezellige leefruimte. Ook de vernieuwde meterkast (2023) is hier gesitueerd. De gehele verdieping is voorzien van comfortabele vloerverwarming. Tweede verdieping Via de trap bereikt u de slaapkamer, badkamer en het riante dakterras. Het royale dakterras op het zuiden is een heerlijke plek om te ontspannen en te genieten van volledige privacy en een vrij uitzicht over de Oude Rijn. De slaapkamer is verzorgd afgewerkt met een pvc-vloer, gestucte wanden en een gestuct plafond en beschikt over een volledige wand met luxueuze inbouwkasten. Achter het bed bevindt zich bovendien een inloopkast. Daarnaast is de kamer voorzien van airconditioning, eveneens via smartphone te bedienen. De moderne badkamer is eind 2023 vernieuwd en luxe afgewerkt met een dubbele wastafel met meubel, een inloopdouche met hand- en regendouche, een wandcloset en een verwarmde spiegel. Het dakraam zorgt voor aangenaam daglicht en een ruimtelijk gevoel. Bijzonderheden - Instapklare en modern afgewerkte maisonnette - Balkon én riant dakterras op het zuiden - Prachtig vrij uitzicht over de Oude Rijn - Luxe keuken en badkamer (beide eind 2023 vernieuwd) - Voorzien van vloerverwarming (1e verdieping) - Voorzien van twee airconditioningunits voor koelen en verwarmen (boven en beneden) - Eigen parkeerplaats op het terrein - Energielabel A - HR++ beglazing - Intergas-cv-ketel (2023) - Daken vernieuwd in 2018 - Kunststof kozijnen (deels) - Servicekosten € 126,- per maand Een woning waar comfort, luxe en ligging perfect samenkomen. Hier woont u licht, modern en ontspannen, met elke dag een vrij uitzicht over het water.
€ 419.000
Cost of copper (estimated): € 10.230
2% transfer tax (€ 8.380) + notary (€ 1.150) + valuation (€ 700)
Total purchase (incl. p.p.): € 429.230
3,02%
Yearly
€ 20.950
Direct available
Estimated mortgage
Indicative gross monthly cost
Based on annuity and 30 year term
Indicative net monthly cost
iDisclaimer: this mortgage calculation is a simplified indication based on general assumptions. No rights can be derived from the results shown. Calculated with 10-annual interest (met NHG), automatically determined based on the price limit € 470.000. Source: 10-jaars rente uit mortgage_rates (07-06-2026 03:45).
Dubbele wastafel, inloopdouche, toilet, en wastafelmeubel
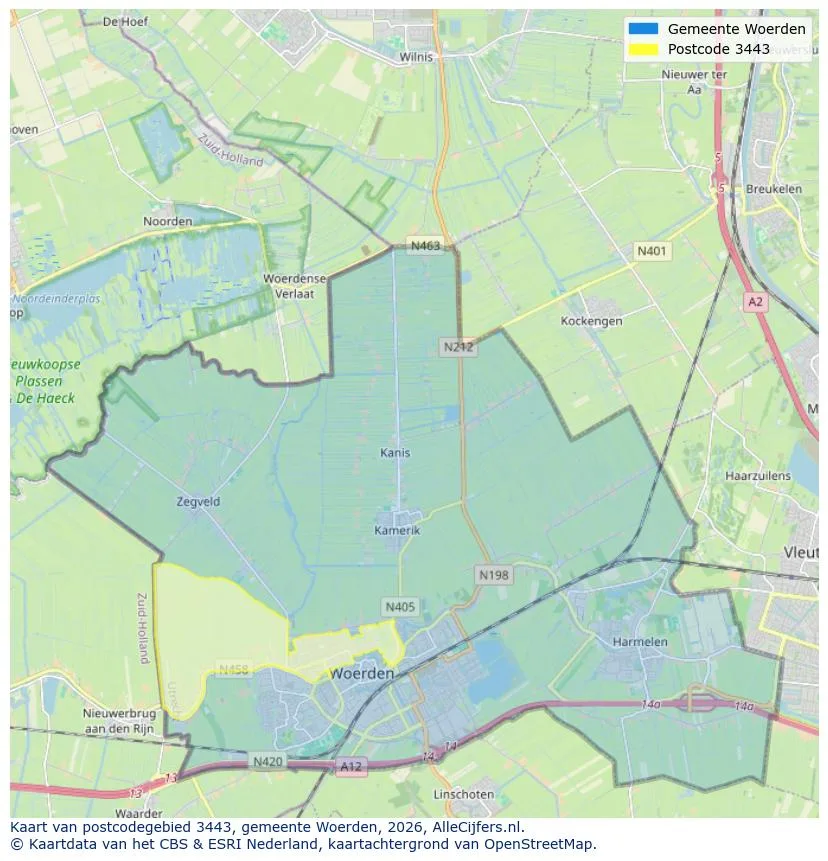
View the location and discover the brokers in this region
View current location data on residents, WOZ development, housing stock, energy consumption, business activity and safety in Woerden. In 2025 were there 39.445 residents. The average WOZ value in 2025 is EUR 426.601.
Residents
39.445
Last year: 2025
Average WOZ
EUR 426.601
Last year: 2025
Average income per person.
EUR 36.693
Source: AllNumbers
Crimes (current year)
1.620
Total registered
| Year | Residents |
|---|---|
| 2021 | 38.320 |
| 2022 | 38.490 |
| 2023 | 38.800 |
| 2024 | 39.325 |
| 2025 | 39.445 |
| Year | Average WOZ |
|---|---|
| 2021 | EUR 318.312 |
| 2022 | EUR 346.230 |
| 2023 | EUR 397.354 |
| 2024 | EUR 403.570 |
| 2025 | EUR 426.601 |
Hoger
11.370
Praktisch
6.700
Middelbaar
11.010
Europa
2.265
Nederland
30.655
Buiten Europa
6.500
Label A
5.571
Label C
4.448
Label B
3.352
Label D
1.125
Label G
865
Label F
780
Label A+++
666
Label E
605
Label A+
431
Label A++
287
Label A++++
21
Label A+++++
15
| Year | Gas (m3) | Electricity (kWh) |
|---|---|---|
| 2020 | 1.076 | 2.749 |
| 2021 | 1.203 | 2.801 |
| 2022 | 929 | 2.618 |
| 2023 | 802 | 2.464 |
| 2024 | 768 | 2.490 |
Hoekwoning
Gas: 953 • Electricity: 2.733
Huurwoning
Gas: 629 • Electricity: 1.914
Koopwoning
Gas: 902 • Electricity: 2.771
Appartement
Gas: 544 • Electricity: 1.785
Tussenwoning
Gas: 823 • Electricity: 2.554
Vrijstaande woning
Gas: 1.502 • Electricity: 4.167
Twee-onder-één-kap woning
Gas: 1.150 • Electricity: 3.141
Total number of company establishments: 5.980
| Period | Crimes |
|---|---|
| jan 2025 | 112 |
| jan 2026 | 149 |
| jul 2025 | 138 |
| jun 2025 | 128 |
| mei 2025 | 143 |
| mrt 2025 | 145 |
| nov 2024 | 155 |
| nov 2025 | 142 |
| okt 2024 | 146 |
| okt 2025 | 129 |
| sep 2024 | 113 |
| sep 2025 | 157 |
These figures give an indicative picture of safety trends in the living environment of Woerden.
Short answers based on current local statistics, handy for a quick comparison of the living environment.
Woerden telt in 2025 ongeveer 39.445 inwoners.
De gemiddelde WOZ-waarde in Woerden is in 2025 circa € 426.601.
Het gemiddelde inkomen per inwoner in Woerden ligt rond € 36.693 per jaar.
Voor het huidige jaar gaat het om ongeveer 1.620 geregistreerde misdrijven. Gebruik deze cijfers als indicatie en vergelijk trends per periode.
In Woerden komt vooral "Tussenwoningen" veel voor, met ongeveer 6.780 woningen.
View more homes in this location.
3443GZ Woerden
€ 2.850 p/m
€ 21/m²
3441XC Woerden
€ 915.000 k.k.
€ 4.197/m²
3441AR Woerden
€ 235.000 k.k.
€ 4.896/m²

3445BA Woerden
€ 3.450.000 k.k.
€ 6.425/m²

3446JK Woerden
€ 2.950 p/m
€ 18/m²
3448KP Woerden
€ 575.000 k.k.
€ 4.423/m²
3441EH Woerden
€ 385.000 k.k.
€ 6.754/m²
3442GP Woerden
€ 475.000 k.k.
€ 3.654/m²
