- Available
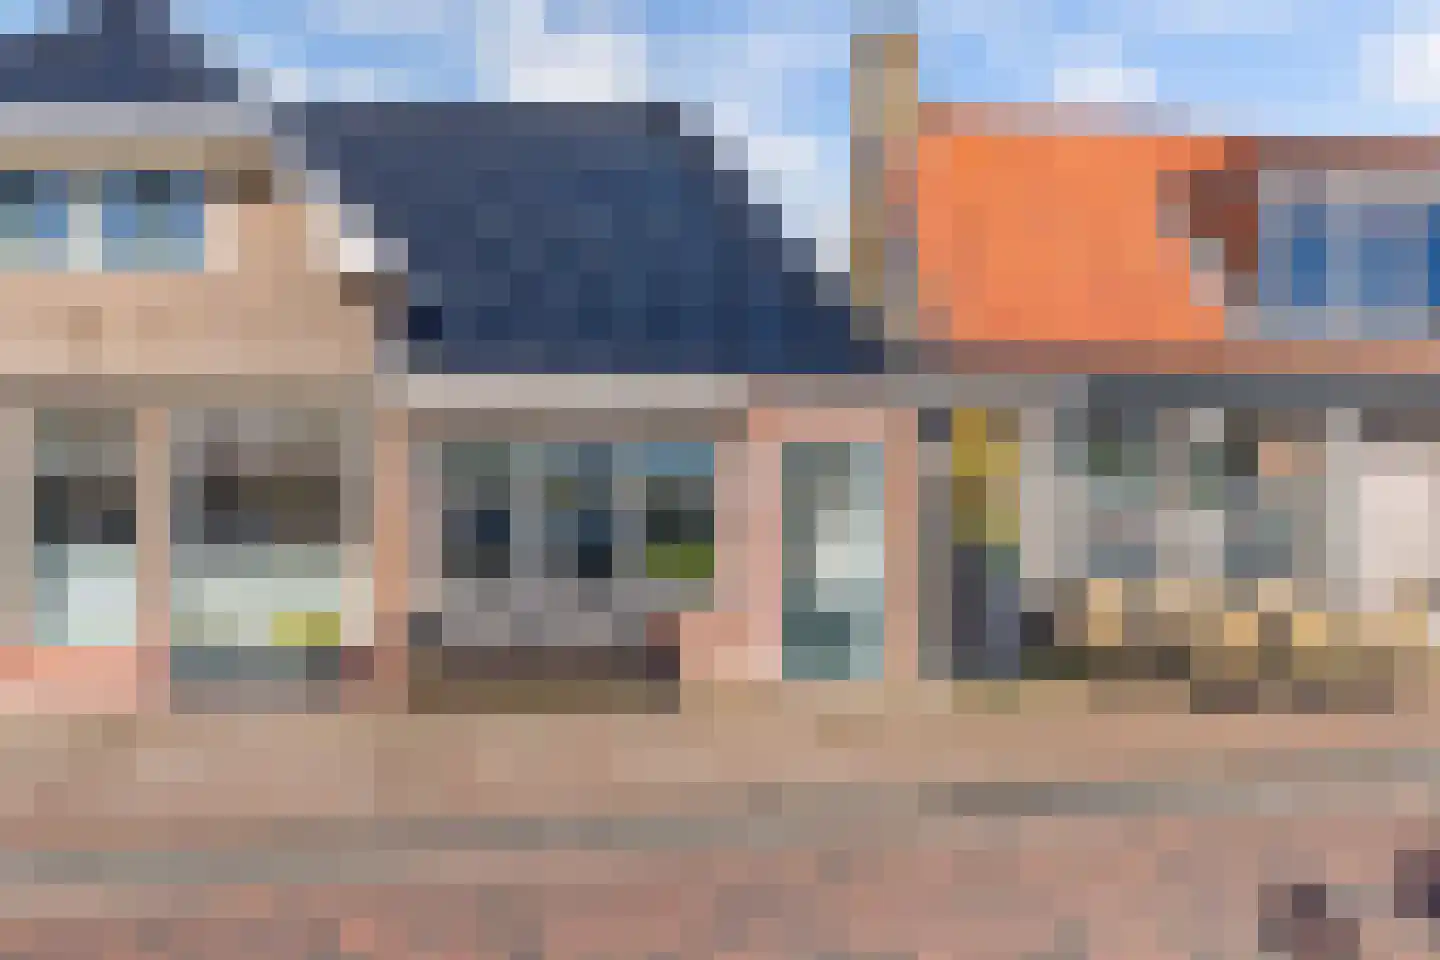
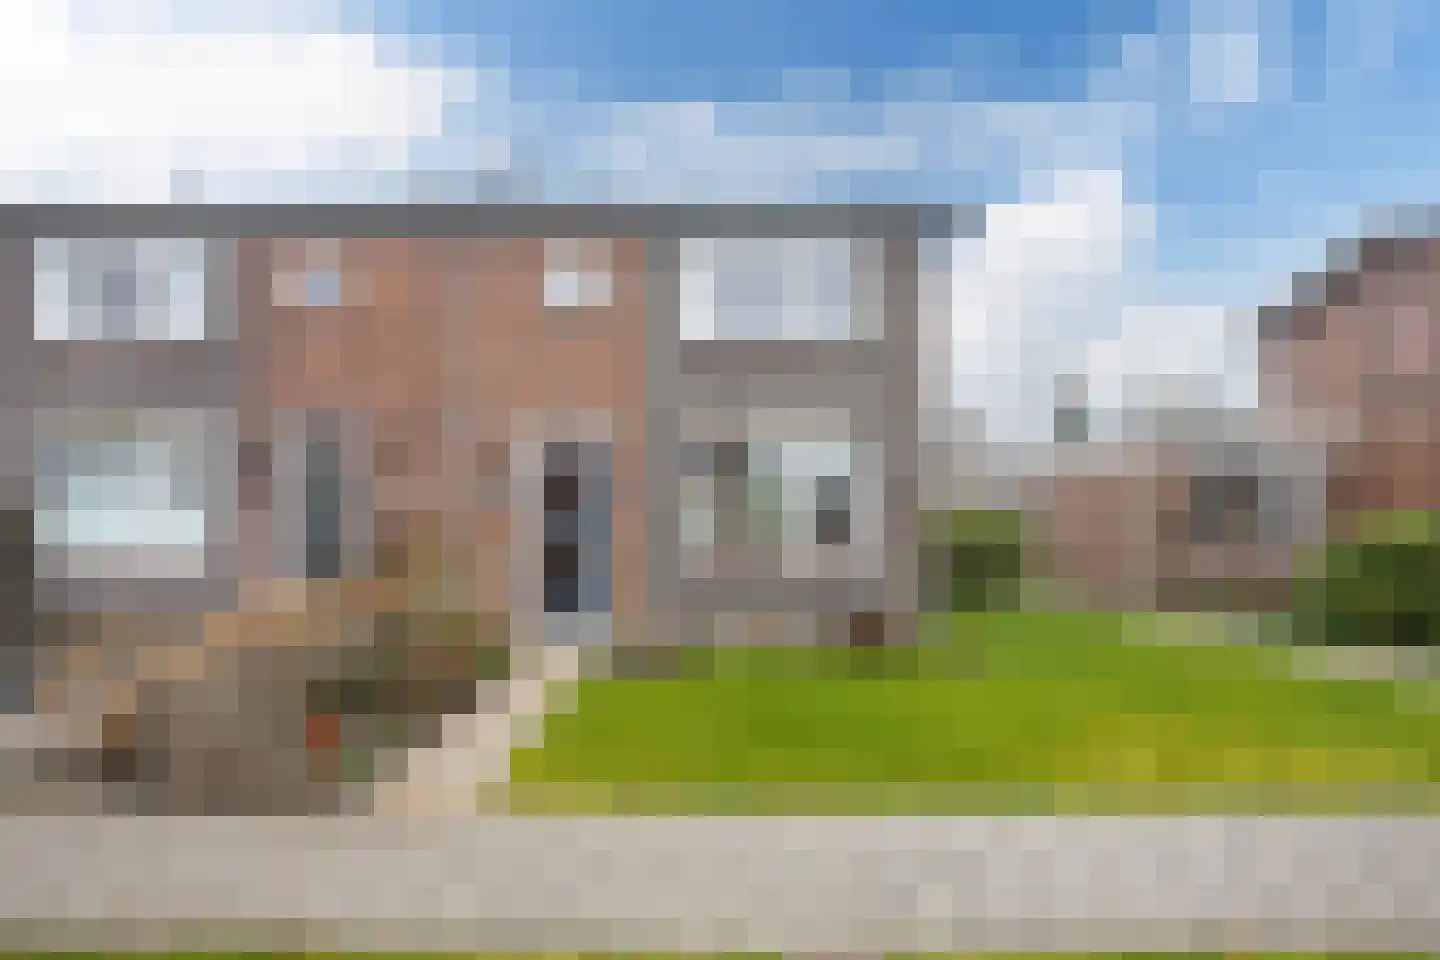
De Iisbaan 10 n
8731DW Wommels
€ 1.200.000 k.k.
€ 3.647/m²
A
Save as favorite
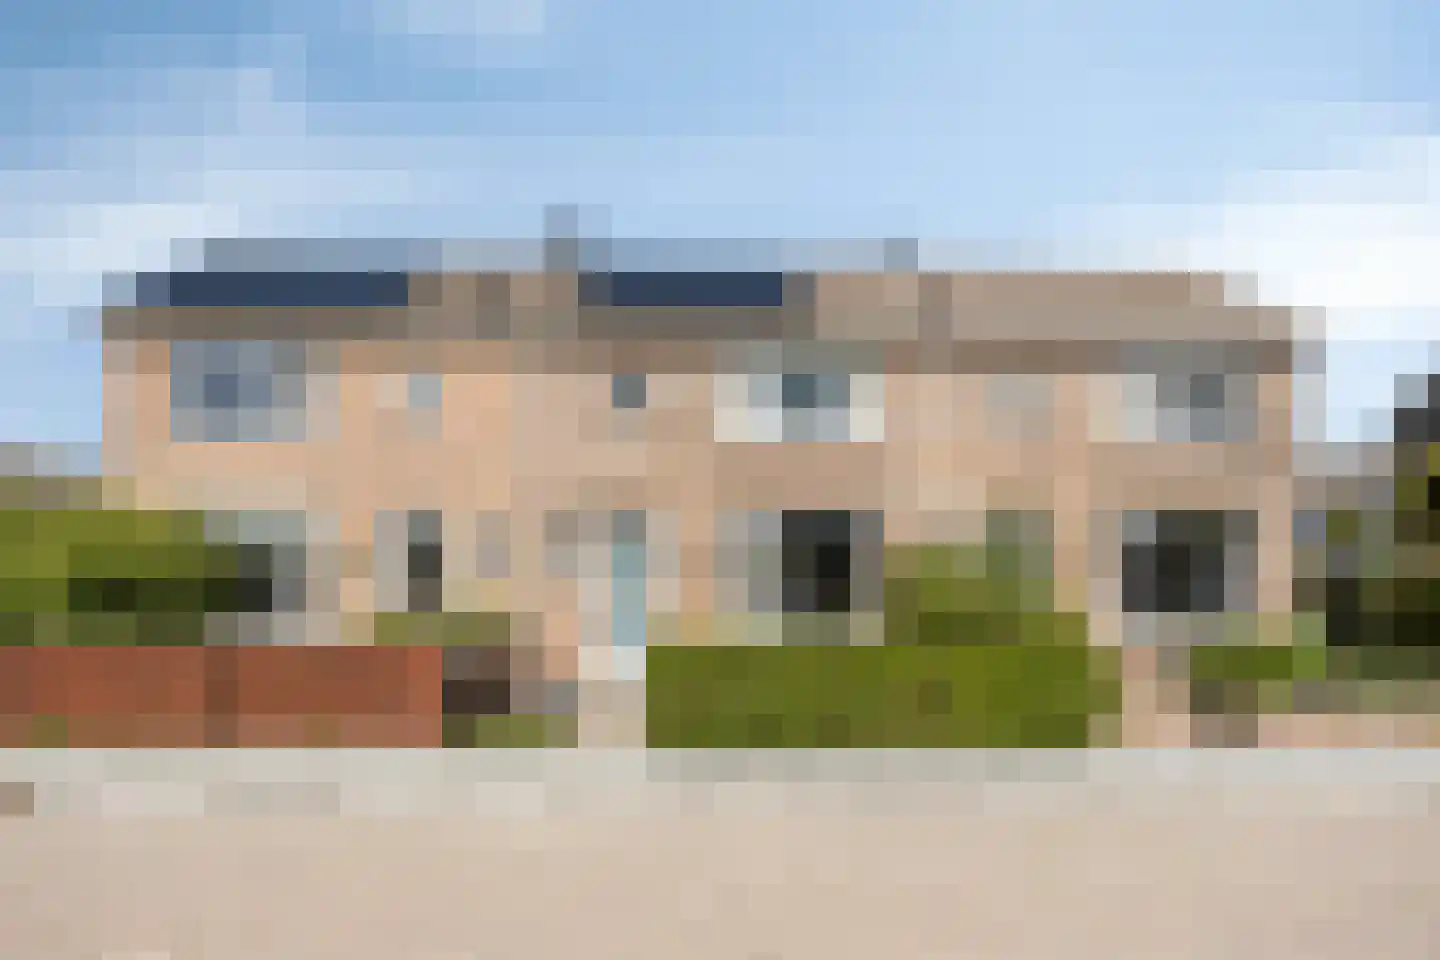
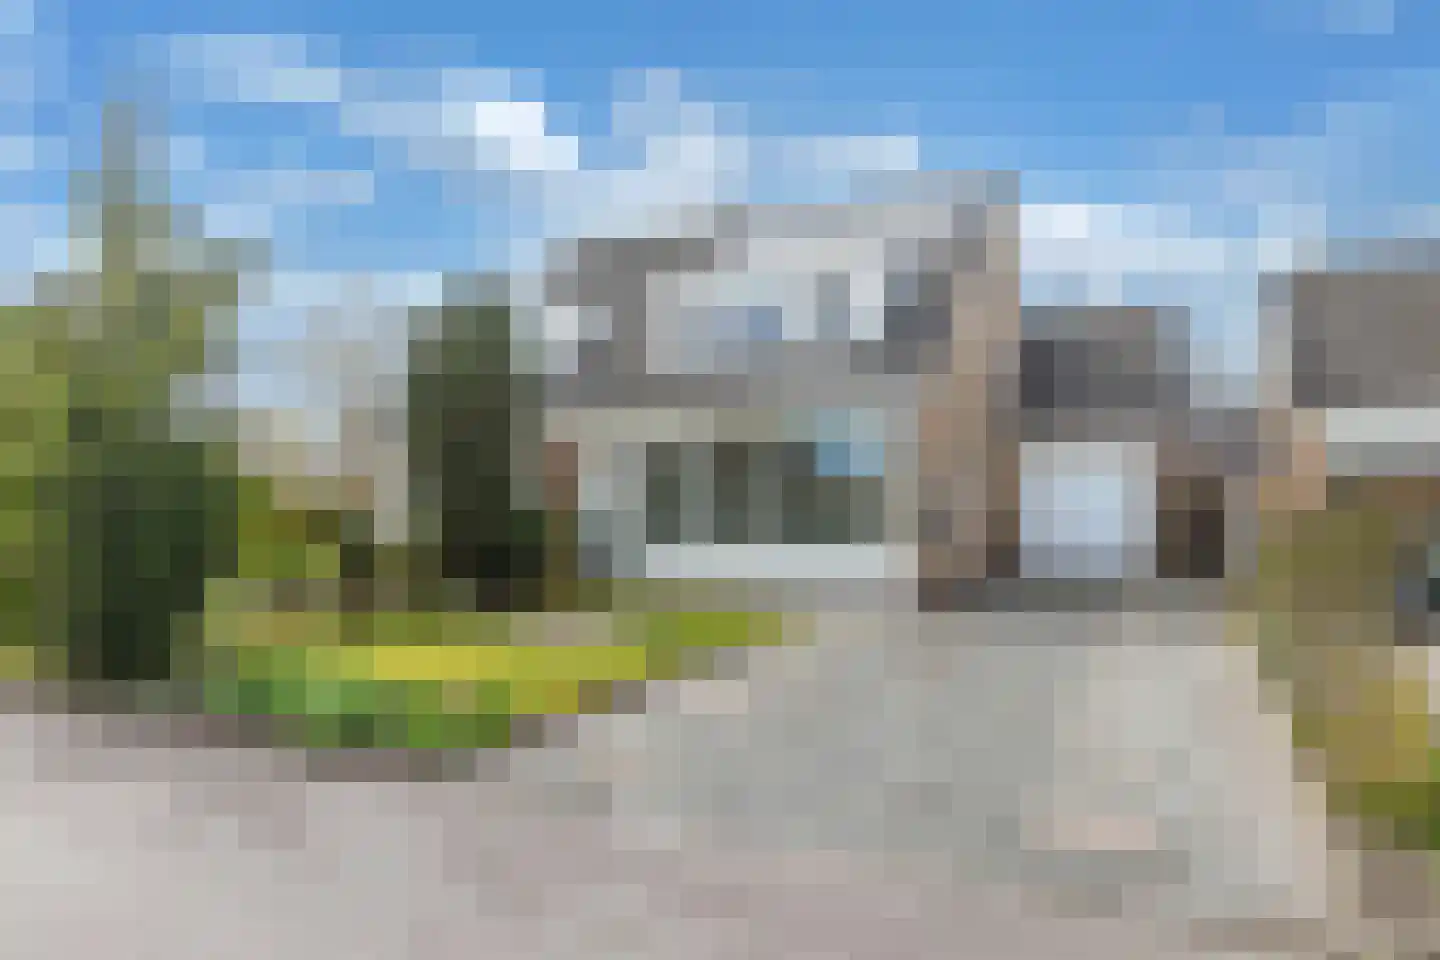
- Living area
- 329 m²
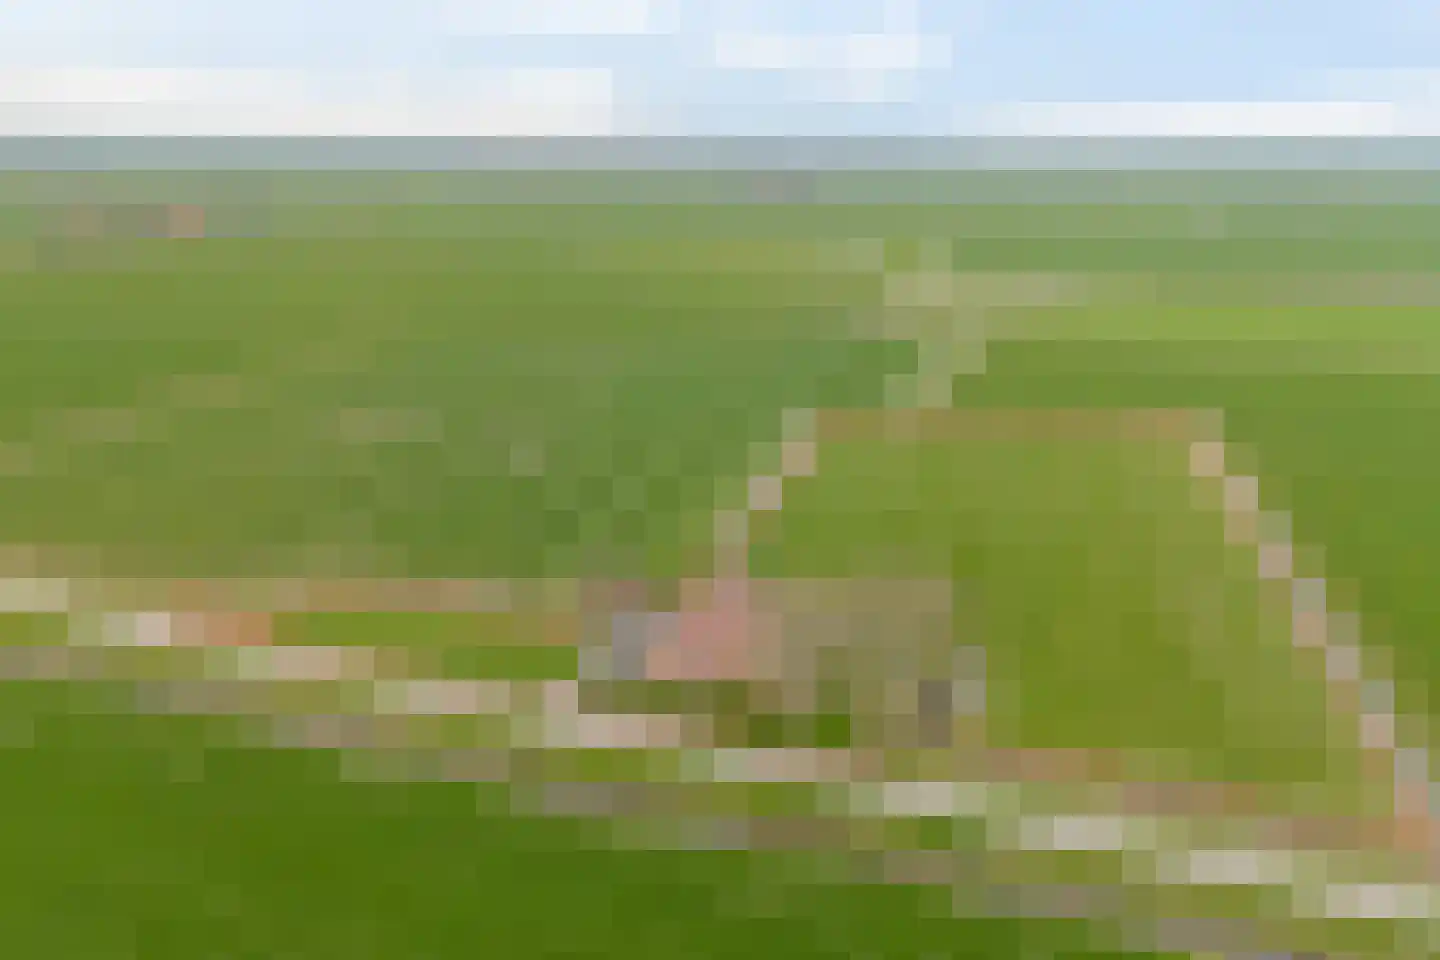
- Land area
- 2690 m²
- Bedrooms
- 3