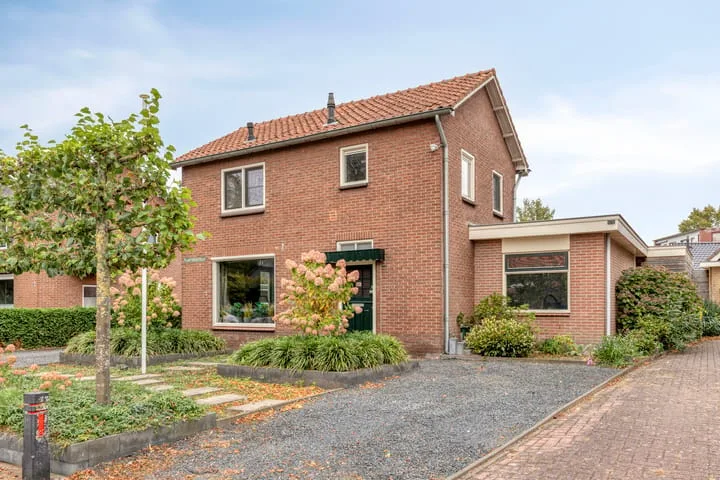
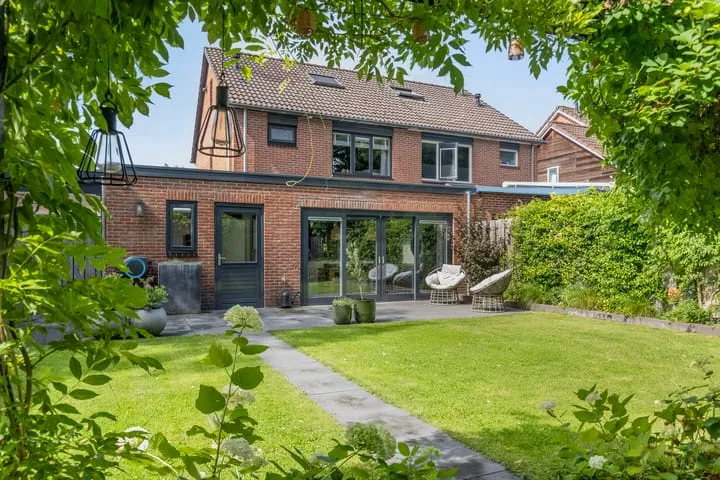
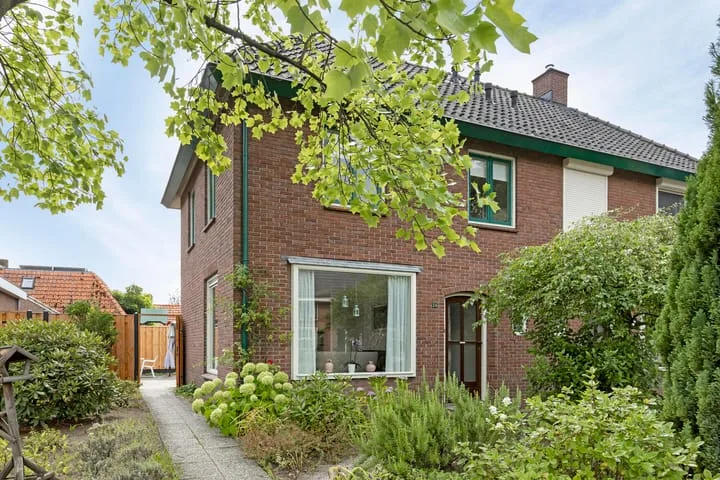
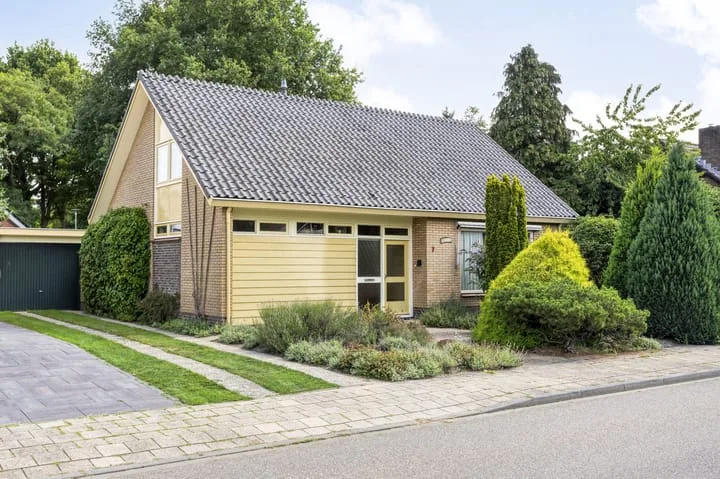
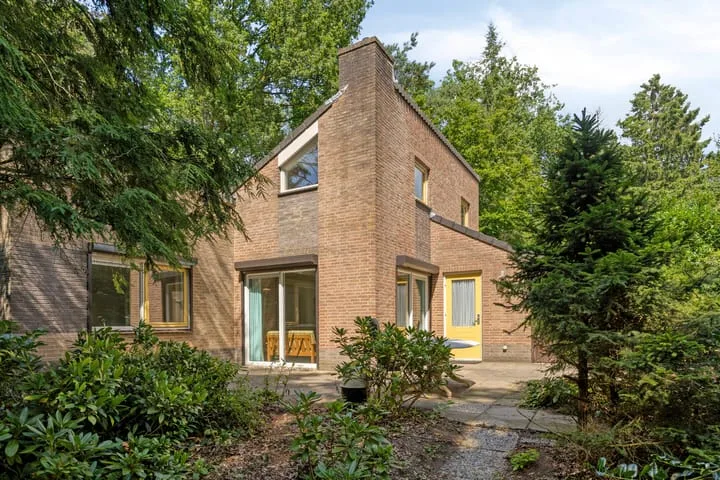
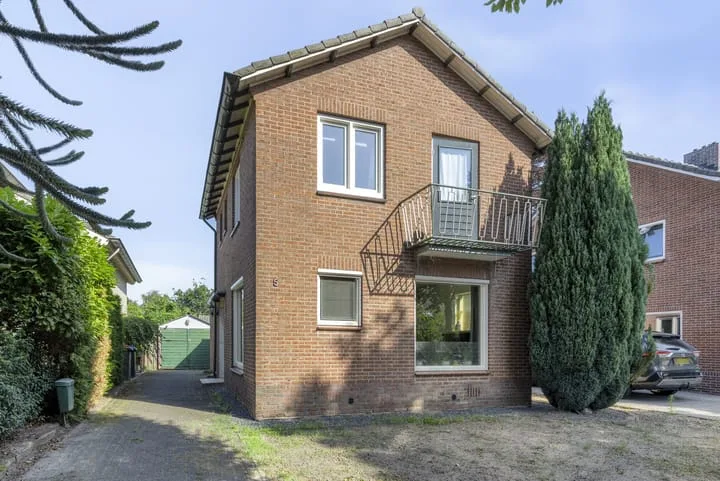
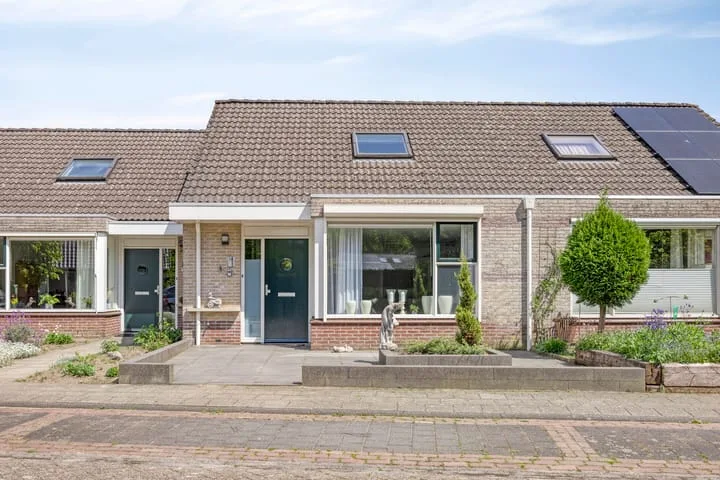
- Sold
de Breide 9
7021NK Zelhem
Price upon request
- Living area
- 146 m²
- Land area
- —
- Bedrooms
- 4
View 68 sold houses in Zelhem
Type to search. Use arrow down and arrow up to navigate through results and press Enter to open.
Hidden search suggestions.
Compare sold homes in Zelhem or view the current offering in this location directly.
On this page you will find recently sold homes in Zelhem. Use this overview to better estimate selling prices, popular neighborhoods, and the local housing supply before you choose a real estate agent. Also view the current housing supply with 87 houses in Zelhem.
7021NK Zelhem
Price upon request
7021RA Zelhem
€ 369.000 k.k.
€ 3.024/m²
7021ZZ Zelhem
€ 489.000 k.k.
€ 4.179/m²
7021ER Zelhem
€ 407.000 k.k.
€ 3.803/m²
7021MJ Zelhem
€ 649.000 k.k.
€ 5.363/m²
7021HB Zelhem
€ 629.000 k.k.
€ 5.330/m²
7021HB Zelhem
€ 235.000 k.k.
€ 3.012/m²
7021HK Zelhem
€ 885.000 k.k.
€ 5.784/m²
7021CX Zelhem
€ 719.000 k.k.
€ 3.440/m²
7021HA Zelhem
€ 649.000 k.k.
€ 4.056/m²
7021DG Zelhem
€ 475.000 k.k.
€ 3.417/m²
7021EZ Zelhem
€ 525.000 k.k.
€ 3.697/m²
7021BT Zelhem
€ 925.000 k.k.
€ 2.863/m²
7021HA Zelhem
€ 589.000 k.k.
€ 0/m²
7021AE Zelhem
€ 319.000 k.k.
€ 0/m²
7021HH Zelhem
€ 750.000 k.k.
€ 0/m²
7021ZS Zelhem
€ 419.000 k.k.
€ 0/m²
7021HB Zelhem
€ 249.000 k.k.
€ 0/m²
7021LP Zelhem
€ 449.000 k.k.
€ 0/m²
7021ND Zelhem
€ 675.000 k.k.
€ 3.792/m²
7021MJ Zelhem
€ 499.000 k.k.
€ 5.308/m²
7021HB Zelhem
€ 210.000 k.k.
€ 3.043/m²
7021AH Zelhem
€ 345.000 k.k.
€ 4.058/m²
7021EN Zelhem
€ 355.000 k.k.
€ 3.169/m²
7021ZM Zelhem
€ 389.000 k.k.
€ 3.851/m²
7021ER Zelhem
€ 379.000 k.k.
€ 4.258/m²
7021HT Zelhem
€ 965.000 k.k.
€ 8.539/m²
7021BJ Zelhem
€ 329.000 k.k.
€ 4.217/m²
Bekijk recente verkopen en ontvang gratis offertes van lokale verkoopmakelaars in Zelhem.
Zelf je woning verkopen in Zelhem? Vergelijk verkoopmakelaars in Zelhem of bekijk de beste verkoopmakelaars in Zelhem als referentie bij jouw keuze.
Makelaars maken scherpere voorstellen als ze weten dat je vergelijkt — vraag offertes aan voor verkoop of aankoop.
Short answers about housing prices, sold homes and comparing real estate agents in Zelhem.
The costs of a real estate agent in Zelhem vary per office, property type and sales approach. Therefore, compare multiple quotes and also look at the real estate agents in Zelhem to better compare rates, presentation and local experience.
On this page we currently show 68 sold houses in Zelhem from our selection. This helps you to better assess recent transactions and the local housing market.
Houses sold in Zelhem give insight into asking prices, house types and neighborhoods where recent transactions have taken place. Compare this also with the current housing stock in Zelhem to better understand the market.
You can use sold homes as a first market indication, but a local real estate agent can better take into account finishing, location, maintenance and current demand in Zelhem.
Vergelijk makelaars in Zelhem op lokale verkoopervaring, reviews, verwachte opbrengst, courtage en marketingaanpak. Bekijk verkoopmakelaars in Zelhem of de top 10 makelaars in Zelhem om snel sterke kantoren te ontdekken.
View current location data on residents, WOZ development, housing stock, energy consumption, business activity and safety in Zelhem. In 2026 were there 8.706 residents. The average WOZ value in 2025 is EUR 415.169.
These figures help to better assess and compare the housing stock in Zelhem with recent sold homes. Orient yourself then on suitable top real estate agents in Zelhem for sales advice in this region.
Residents
8.706
Last year: 2026
Average WOZ
EUR 415.169
Last year: 2025
Average income per person.
EUR 20.292
Source: AllNumbers
Crimes (current year)
131
Total registered
| Year | Residents |
|---|---|
| 2021 | 8.640 |
| 2022 | 8.675 |
| 2023 | 8.708 |
| 2024 | 8.708 |
| 2025 | 8.729 |
| 2026 | 8.706 |
| Year | Average WOZ |
|---|---|
| 2021 | EUR 287.954 |
| 2022 | EUR 327.404 |
| 2023 | EUR 392.561 |
| 2024 | EUR 411.879 |
| 2025 | EUR 415.169 |
Hoger
1.458
Praktisch
1.699
Middelbaar
3.148
Europa
284
Nederland
8.059
Buiten Europa
385
Label A
1.020
Label C
937
Label B
571
Label G
438
Label D
373
Label F
276
Label E
154
Label A+++
100
Label A+
92
Label A++
38
Label A++++
22
Label A+++++
0
| Year | Gas (m3) | Electricity (kWh) |
|---|---|---|
| 2020 | 1.437 | 3.232 |
| 2021 | 1.605 | 3.309 |
| 2022 | 1.270 | 3.134 |
| 2023 | 1.026 | 2.990 |
| 2024 | 979 | 3.067 |
Hoekwoning
Gas: 728 • Electricity: 2.345
Huurwoning
Gas: 871 • Electricity: 2.318
Koopwoning
Gas: 1.111 • Electricity: 3.290
Appartement
Gas: 821 • Electricity: 2.319
Tussenwoning
Gas: 691 • Electricity: 2.218
Vrijstaande woning
Gas: 1.304 • Electricity: 3.636
Twee-onder-één-kap woning
Gas: 1.103 • Electricity: 3.074
Total number of company establishments: 1.272
| Period | Crimes |
|---|---|
| jan 2026 | 4 |
| jul 2025 | 13 |
| jun 2025 | 11 |
| mei 2025 | 3 |
| mrt 2025 | 7 |
| mrt 2026 | 15 |
| nov 2024 | 15 |
| nov 2025 | 8 |
| okt 2024 | 10 |
| okt 2025 | 15 |
| sep 2024 | 11 |
| sep 2025 | 15 |
These figures give an indicative picture of safety trends in the living environment of Zelhem.
Short answers based on current local statistics, handy for a quick comparison of the living environment.
Zelhem telt in 2026 ongeveer 8.706 inwoners.
De gemiddelde WOZ-waarde in Zelhem is in 2025 circa € 415.169.
Het gemiddelde inkomen per inwoner in Zelhem ligt rond € 20.292 per jaar.
Voor het huidige jaar gaat het om ongeveer 131 geregistreerde misdrijven. Gebruik deze cijfers als indicatie en vergelijk trends per periode.
In Zelhem komt vooral "Vrijstaande woningen" veel voor, met ongeveer 1.242 woningen.