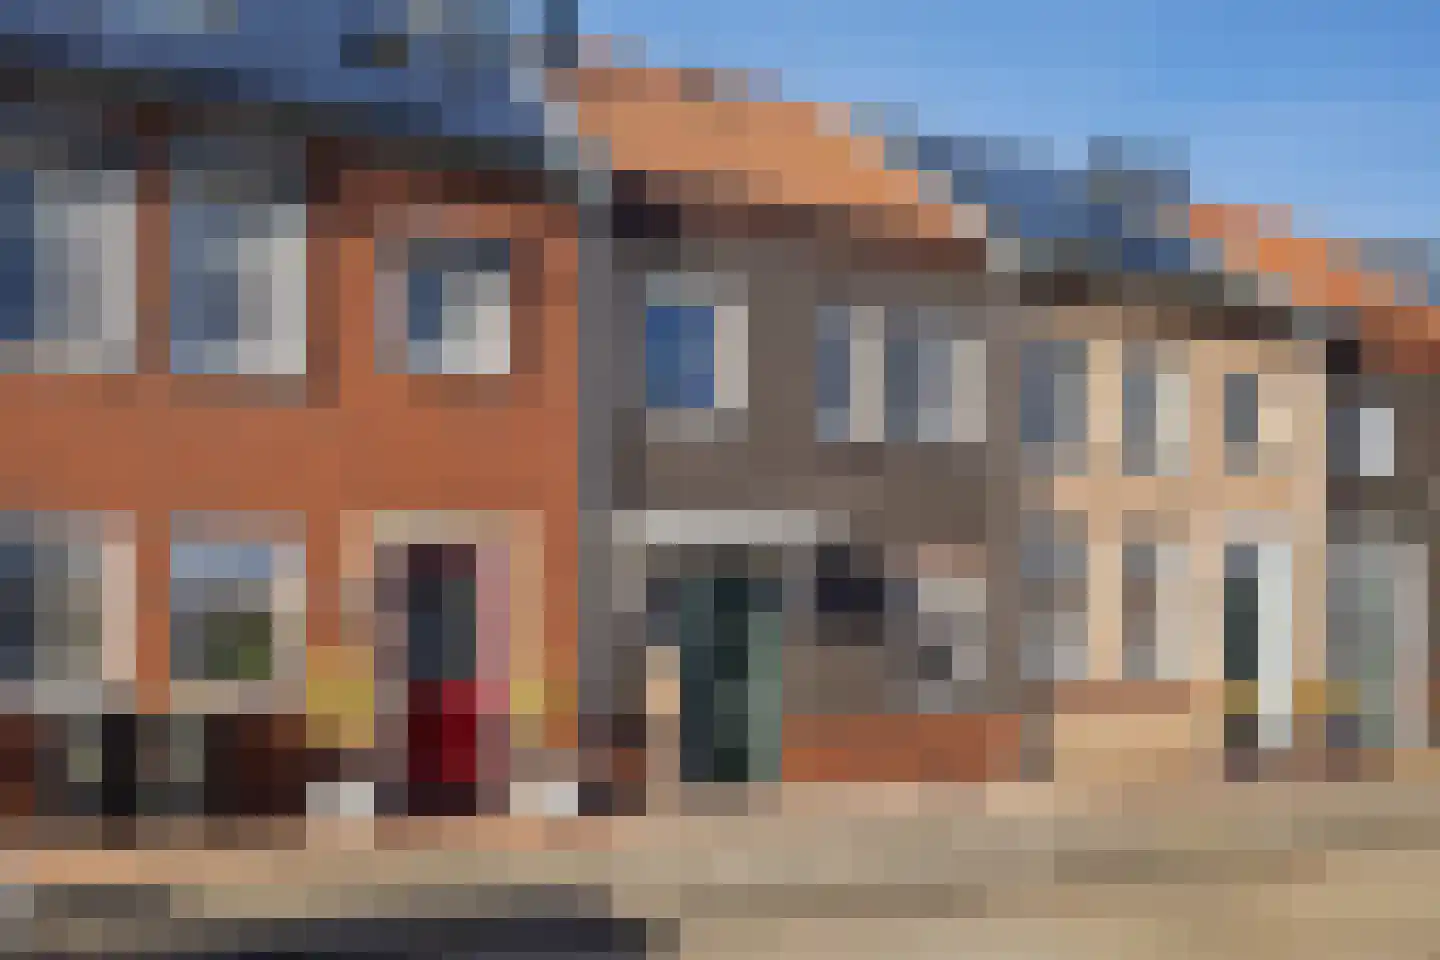
- Sold
Hoefijzer 15
1689VA Zwaag
€ 375.000 k.k.
€ 3.641/m²
- Living area
- 103 m²
- Land area
- 139 m²
- Bedrooms
- 4
View 218 sold houses in Zwaag
Type to search. Use arrow down and arrow up to navigate through results and press Enter to open.
Hidden search suggestions.
Compare sold homes in Zwaag or view the current offering in this location directly.
On this page you will find recently sold homes in Zwaag. Use this overview to better estimate selling prices, popular neighborhoods, and the local housing supply before you choose a real estate agent. Also view the current housing supply with 277 houses in Zwaag.
1689VA Zwaag
€ 375.000 k.k.
€ 3.641/m²
1689CP Zwaag
€ 289.000 k.k.
€ 6.720/m²
1689EE Zwaag
€ 450.000 k.k.
€ 3.947/m²
1689SH Zwaag
€ 375.000 k.k.
€ 3.178/m²
1689BX Zwaag
€ 420.000 k.k.
€ 3.414/m²
1689CM Zwaag
€ 475.000 k.k.
€ 4.481/m²
1689BE Zwaag
€ 400.000 k.k.
€ 3.508/m²
1689GR Zwaag
€ 350.000 k.k.
€ 4.216/m²
1689HN Zwaag
€ 360.000 k.k.
€ 2.927/m²
1689VL Zwaag
€ 350.000 k.k.
€ 3.535/m²
1689PG Zwaag
€ 379.500 k.k.
€ 4.744/m²
1689WD Zwaag
Price upon request
1689HR Zwaag
€ 450.000 k.k.
€ 3.488/m²
1689DD Zwaag
€ 350.000 k.k.
€ 3.211/m²
1689WD Zwaag
€ 625.000 k.k.
€ 4.432/m²
1689TE Zwaag
€ 369.000 k.k.
€ 3.181/m²
1689XN Zwaag
€ 519.000 k.k.
€ 3.992/m²
1689KG Zwaag
€ 300.000 k.k.
€ 3.896/m²
1689WH Zwaag
€ 700.000 k.k.
€ 4.268/m²
1689WL Zwaag
€ 500.000 k.k.
€ 3.846/m²
1689EV Zwaag
€ 750.000 k.k.
€ 4.934/m²
1689VB Zwaag
€ 335.000 k.k.
€ 3.252/m²
1689GW Zwaag
€ 350.000 k.k.
€ 2.892/m²
1689RH Zwaag
€ 350.000 k.k.
€ 3.571/m²
1689RZ Zwaag
€ 210.000 k.k.
€ 3.559/m²
1689VC Zwaag
€ 350.000 k.k.
€ 3.465/m²
1689RK Zwaag
€ 325.000 k.k.
€ 4.333/m²
1689WD Zwaag
€ 595.000 k.k.
€ 4.131/m²
Bekijk recente verkopen en ontvang gratis offertes van lokale makelaars. Vergelijk meer dan 42 makelaars in Zwaag.
Zelf je woning verkopen in Zwaag? Vergelijk verkoopmakelaars in Zwaag of bekijk de beste verkoopmakelaars in Zwaag als referentie bij jouw keuze.
Makelaars maken scherpere voorstellen als ze weten dat je vergelijkt — vraag offertes aan voor verkoop of aankoop.
Short answers about housing prices, sold homes and comparing real estate agents in Zwaag.
De kosten van een makelaar in Zwaag verschillen per kantoor, woningtype en verkoopaanpak. In Zwaag kun je 42 real estate agents vergelijken; bekijk daarom ook de makelaars in Zwaag om tarieven, presentatie en lokale ervaring beter naast elkaar te zetten.
On this page we currently show 218 sold houses in Zwaag from our selection. This helps you to better assess recent transactions and the local housing market.
Houses sold in Zwaag give insight into asking prices, house types and neighborhoods where recent transactions have taken place. Compare this also with the current housing stock in Zwaag to better understand the market.
You can use sold homes as a first market indication, but a local real estate agent can better take into account finishing, location, maintenance and current demand in Zwaag.
Vergelijk de 42 real estate agents in Zwaag op lokale verkoopervaring, reviews, verwachte opbrengst, courtage en marketingaanpak. Bekijk verkoopmakelaars in Zwaag of de top 10 makelaars in Zwaag om snel sterke kantoren te ontdekken.
View current location data on residents, WOZ development, housing stock, energy consumption, business activity and safety in Zwaag. In 2025 were there 17.525 residents. The average WOZ value in 2025 is EUR 378.787.
These figures help to better assess and compare the housing stock in Zwaag with recent sold homes. Orient yourself then on suitable top real estate agents in Zwaag for sales advice in this region.
Residents
17.525
Last year: 2025
Average WOZ
EUR 378.787
Last year: 2025
Average income per person.
EUR 30.265
Source: AllNumbers
Crimes (current year)
589
Total registered
| Year | Residents |
|---|---|
| 2021 | 17.465 |
| 2022 | 17.480 |
| 2023 | 17.510 |
| 2024 | 17.485 |
| 2025 | 17.525 |
| Year | Average WOZ |
|---|---|
| 2021 | EUR 260.973 |
| 2022 | EUR 292.734 |
| 2023 | EUR 343.713 |
| 2024 | EUR 363.589 |
| 2025 | EUR 378.787 |
Hoger
3.300
Praktisch
3.350
Middelbaar
5.650
Europa
1.435
Nederland
13.140
Buiten Europa
2.965
Label C
3.136
Label A
3.049
Label B
964
Label D
255
Label A+++
114
Label A+
113
Label G
103
Label F
74
Label E
61
Label A++
50
Label A++++
26
Label A+++++
12
| Year | Gas (m3) | Electricity (kWh) |
|---|---|---|
| 2020 | 1.071 | 2.878 |
| 2021 | 1.206 | 2.920 |
| 2022 | 959 | 2.746 |
| 2023 | 830 | 2.596 |
| 2024 | 815 | 2.643 |
Hoekwoning
Gas: 895 • Electricity: 2.673
Huurwoning
Gas: 708 • Electricity: 2.021
Koopwoning
Gas: 872 • Electricity: 2.803
Appartement
Gas: 548 • Electricity: 1.662
Tussenwoning
Gas: 791 • Electricity: 2.461
Vrijstaande woning
Gas: 1.071 • Electricity: 3.674
Twee-onder-één-kap woning
Gas: 743 • Electricity: 2.339
Total number of company establishments: 2.510
| Period | Crimes |
|---|---|
| jan 2025 | 32 |
| jan 2026 | 66 |
| jul 2025 | 59 |
| jun 2025 | 67 |
| mei 2025 | 53 |
| mrt 2025 | 55 |
| nov 2024 | 57 |
| nov 2025 | 33 |
| okt 2024 | 63 |
| okt 2025 | 51 |
| sep 2024 | 40 |
| sep 2025 | 61 |
These figures give an indicative picture of safety trends in the living environment of Zwaag.
Short answers based on current local statistics, handy for a quick comparison of the living environment.
Zwaag telt in 2025 ongeveer 17.525 inwoners.
De gemiddelde WOZ-waarde in Zwaag is in 2025 circa € 378.787.
Het gemiddelde inkomen per inwoner in Zwaag ligt rond € 30.265 per jaar.
Voor het huidige jaar gaat het om ongeveer 589 geregistreerde misdrijven. Gebruik deze cijfers als indicatie en vergelijk trends per periode.
In Zwaag komt vooral "Tussenwoningen" veel voor, met ongeveer 3.435 woningen.