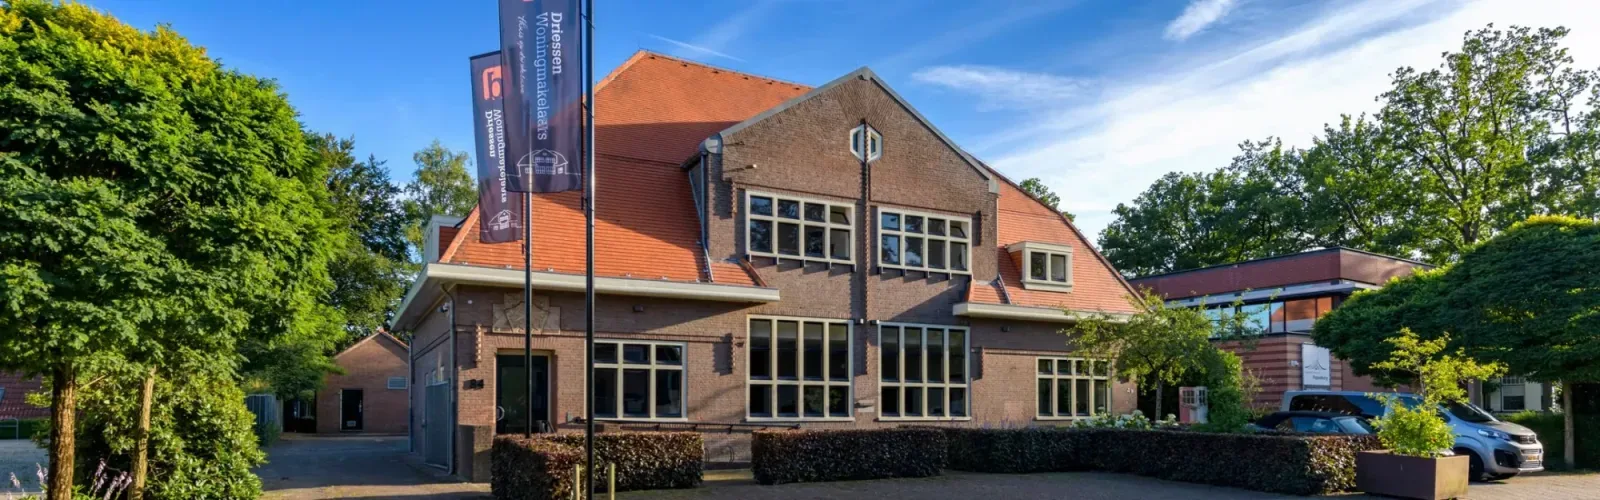

Driessen Woningmakelaars staat al meer dan 15 jaar voor betrouwbare en persoonlijke service op de Veluwe. Wij begrijpen dat het kopen of verkopen van een woning een belangrijk moment is in je leven. Daarom geven wij aandacht aan jouw wensen en behoeften, zodat je de juiste keuzes kunt maken. Onze ervaring in de huizenmarkt van Apeldoorn en omgeving zorgt voor een gerichte benadering, of het nu gaat om de verkoop van je huidige woning of...
Current housing stock
-

- Available
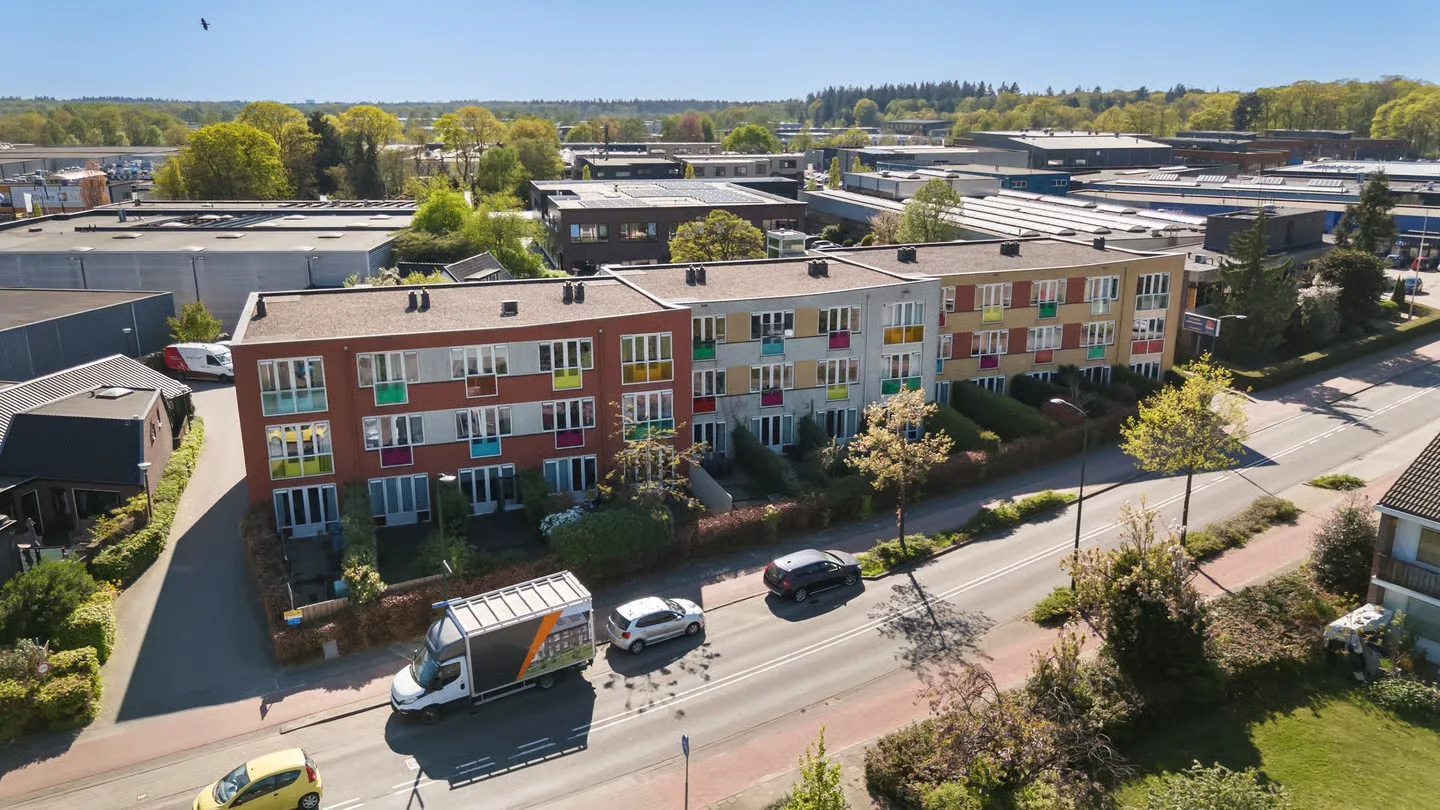
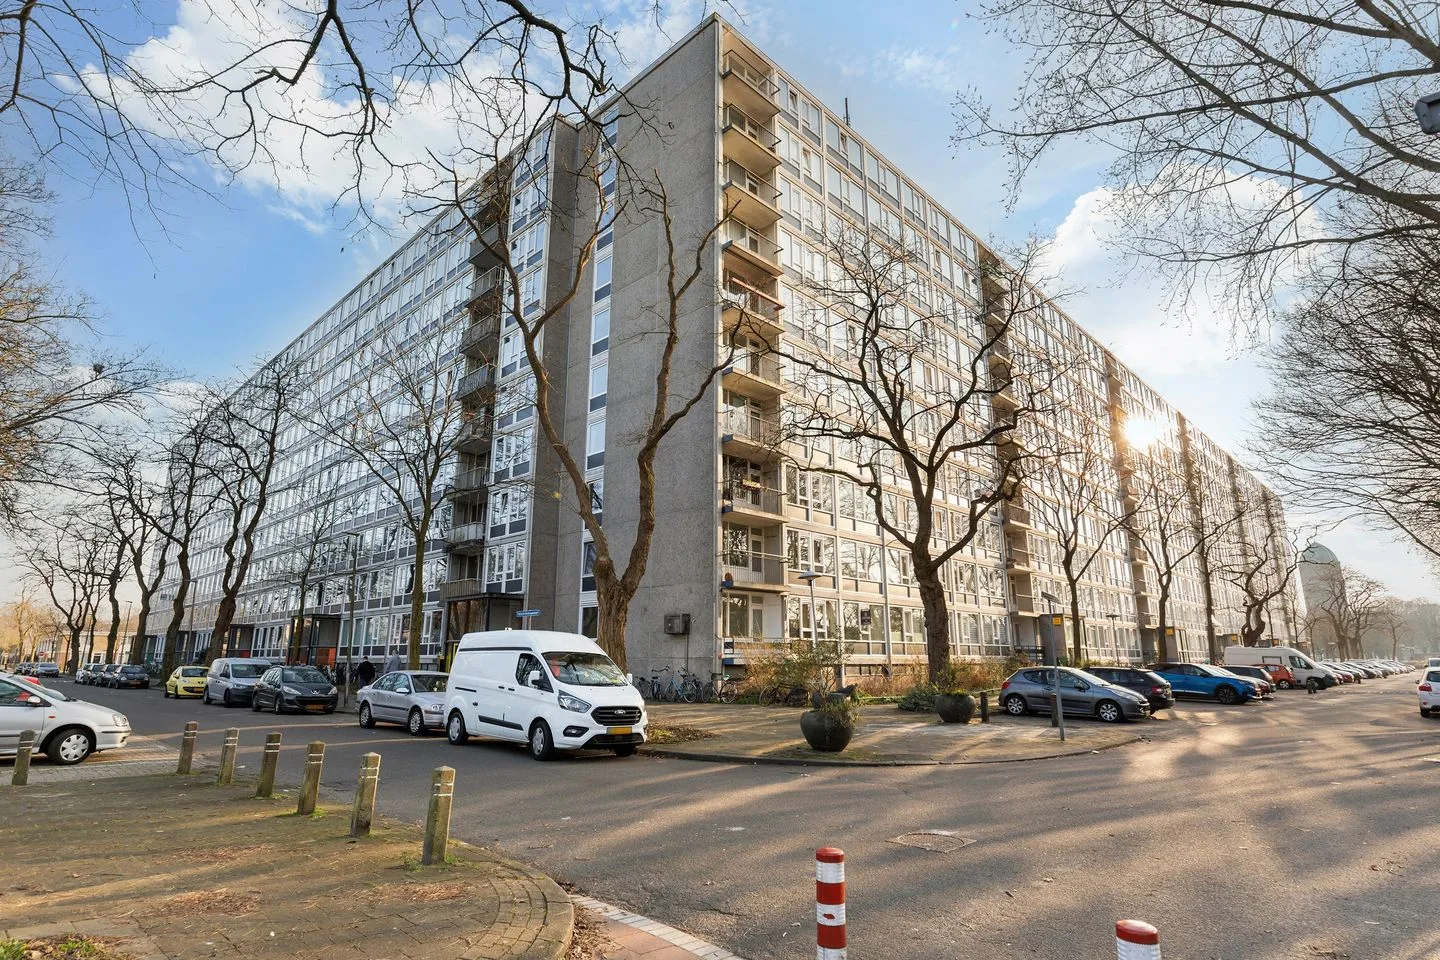
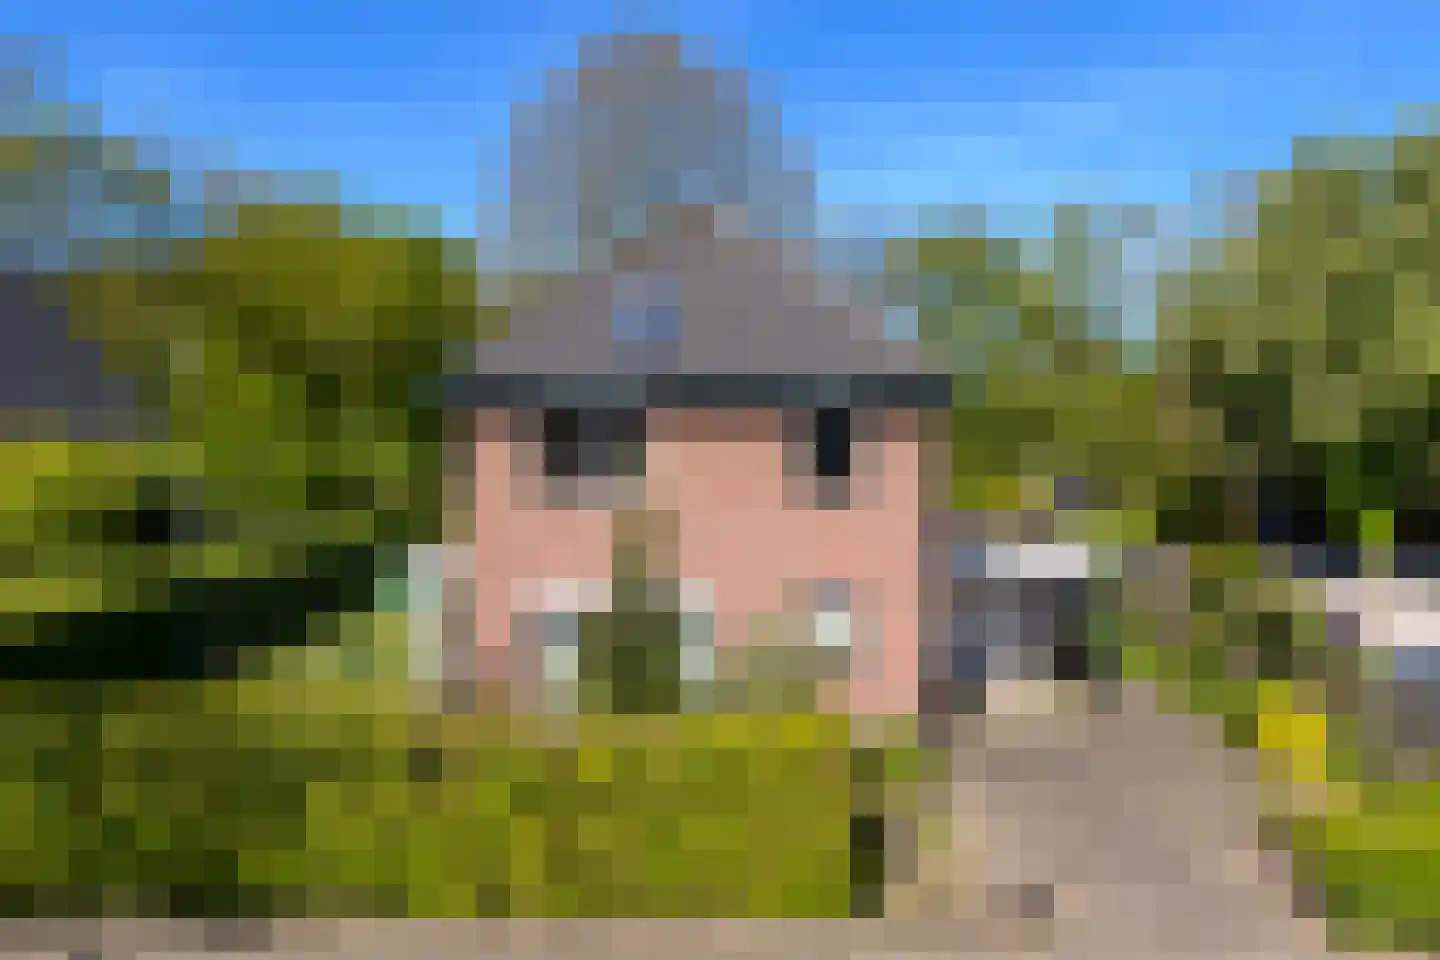
Arnhemseweg 247
7333NA Apeldoorn
€ 35.000 k.k.
Save as favorite- Living area
- —
- Land area
- —
- Bedrooms
- —
-

- Available
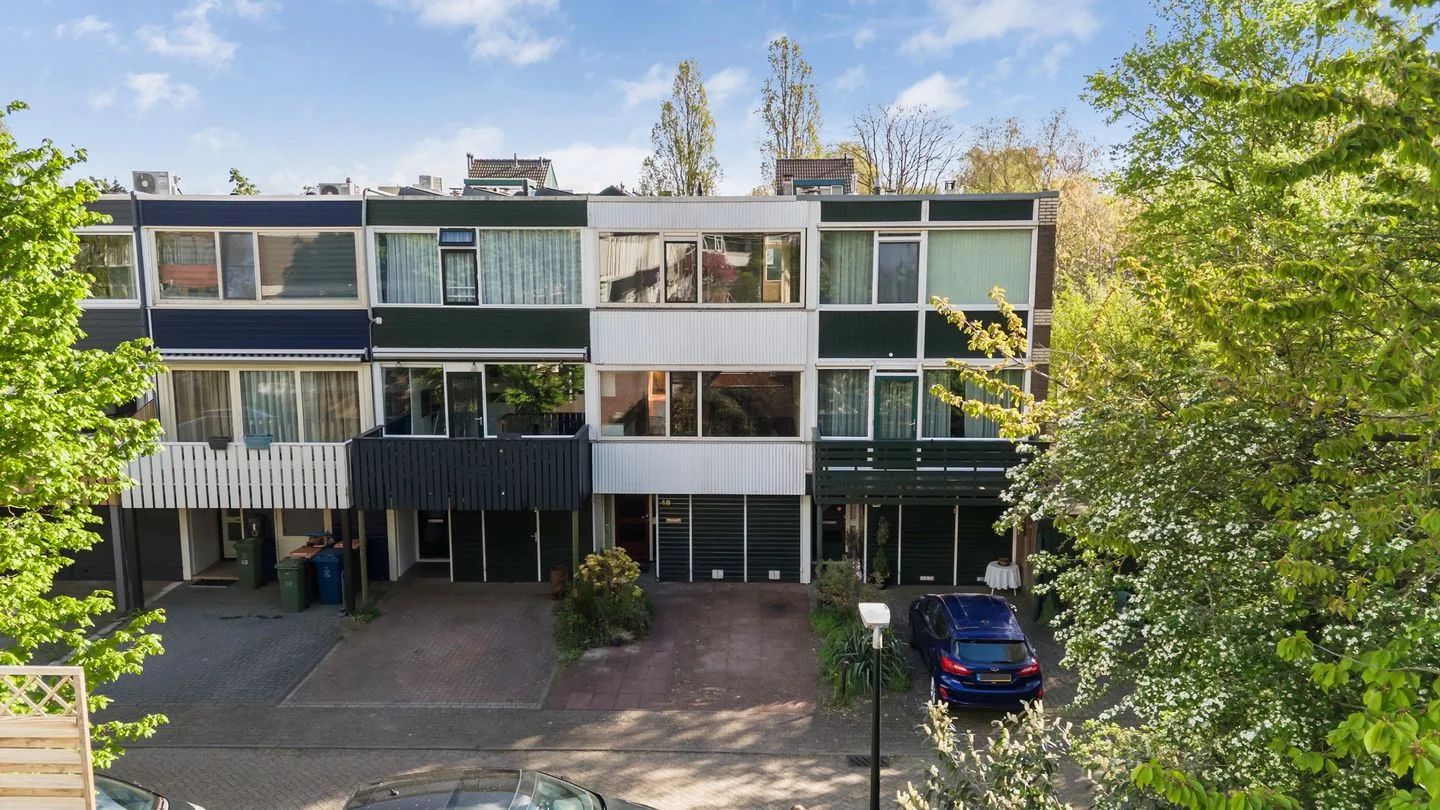
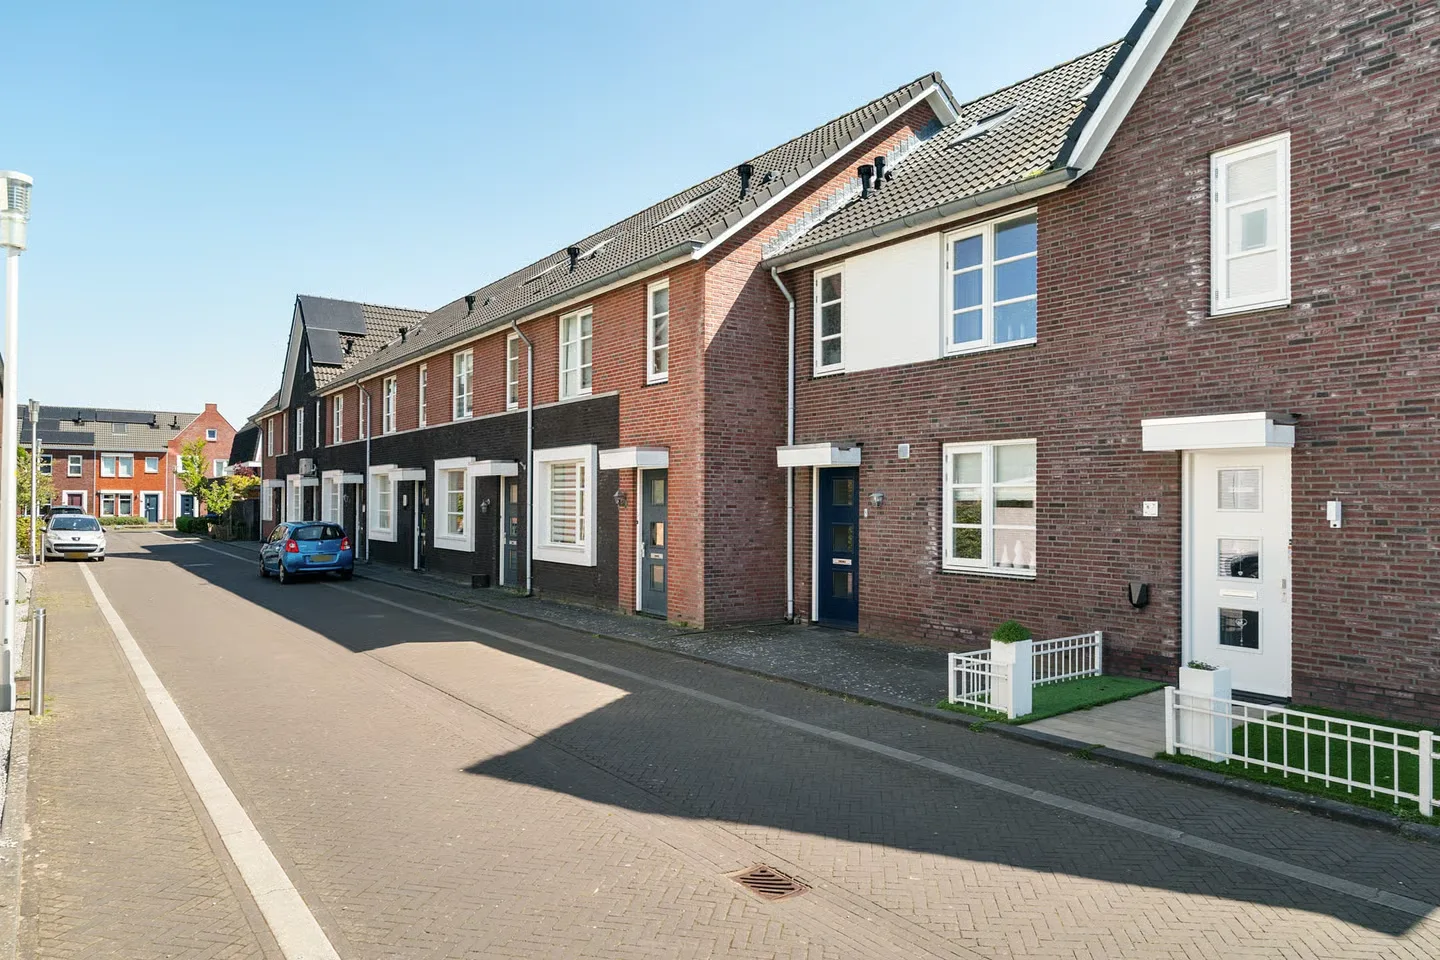
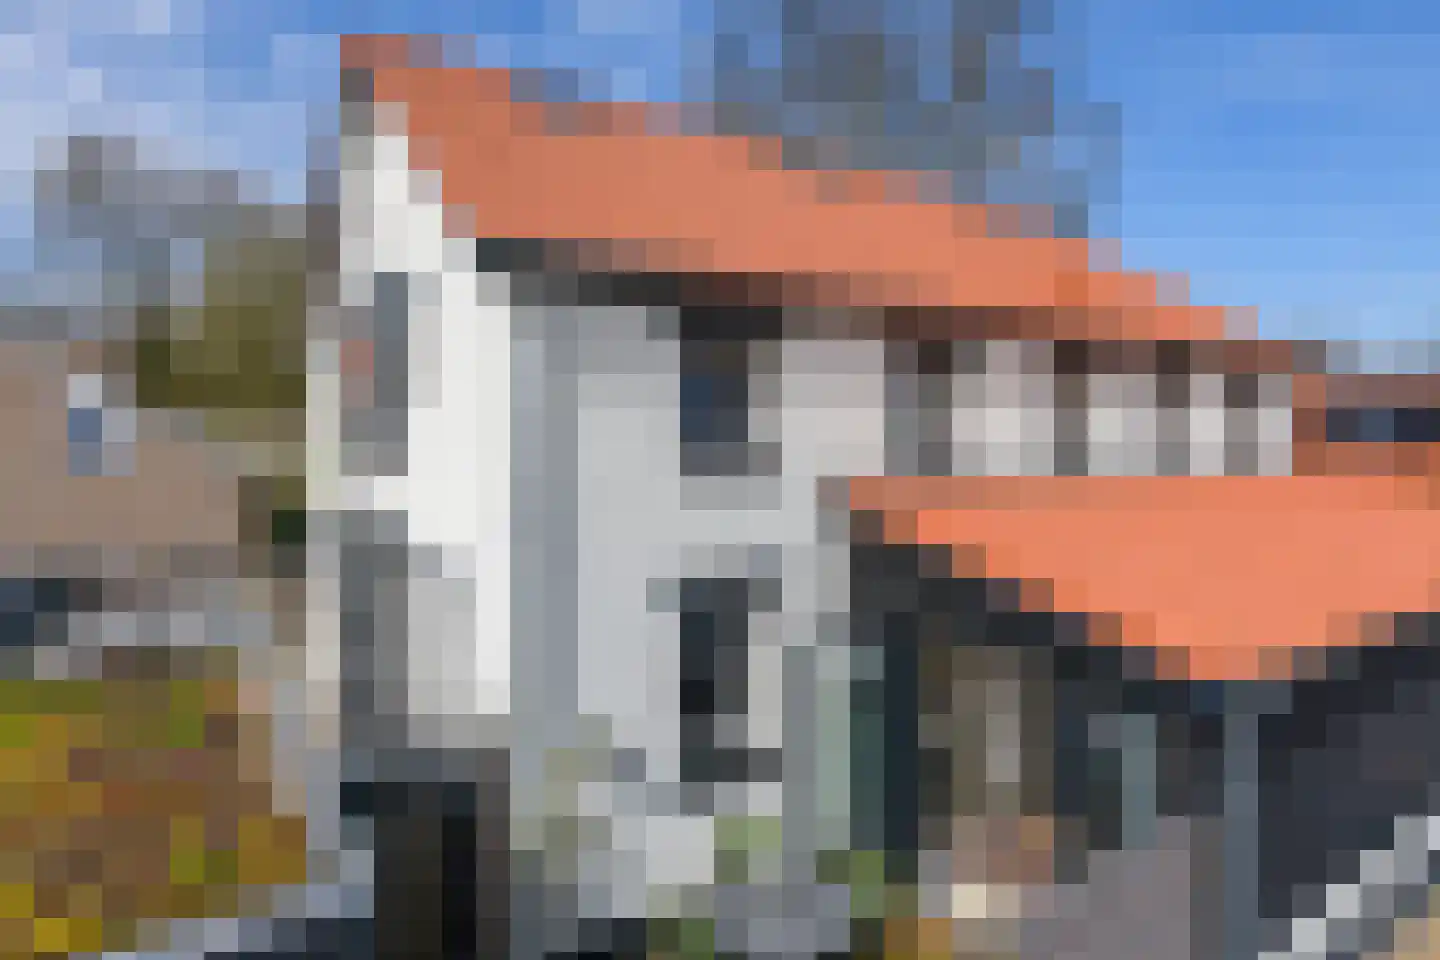
Lage Bergweg 31 Q14
7361GT Beekbergen
€ 449.500 k.k.
ASave as favorite- Living area
- 143 m²
- Land area
- 515 m²
- Bedrooms
- 4
-
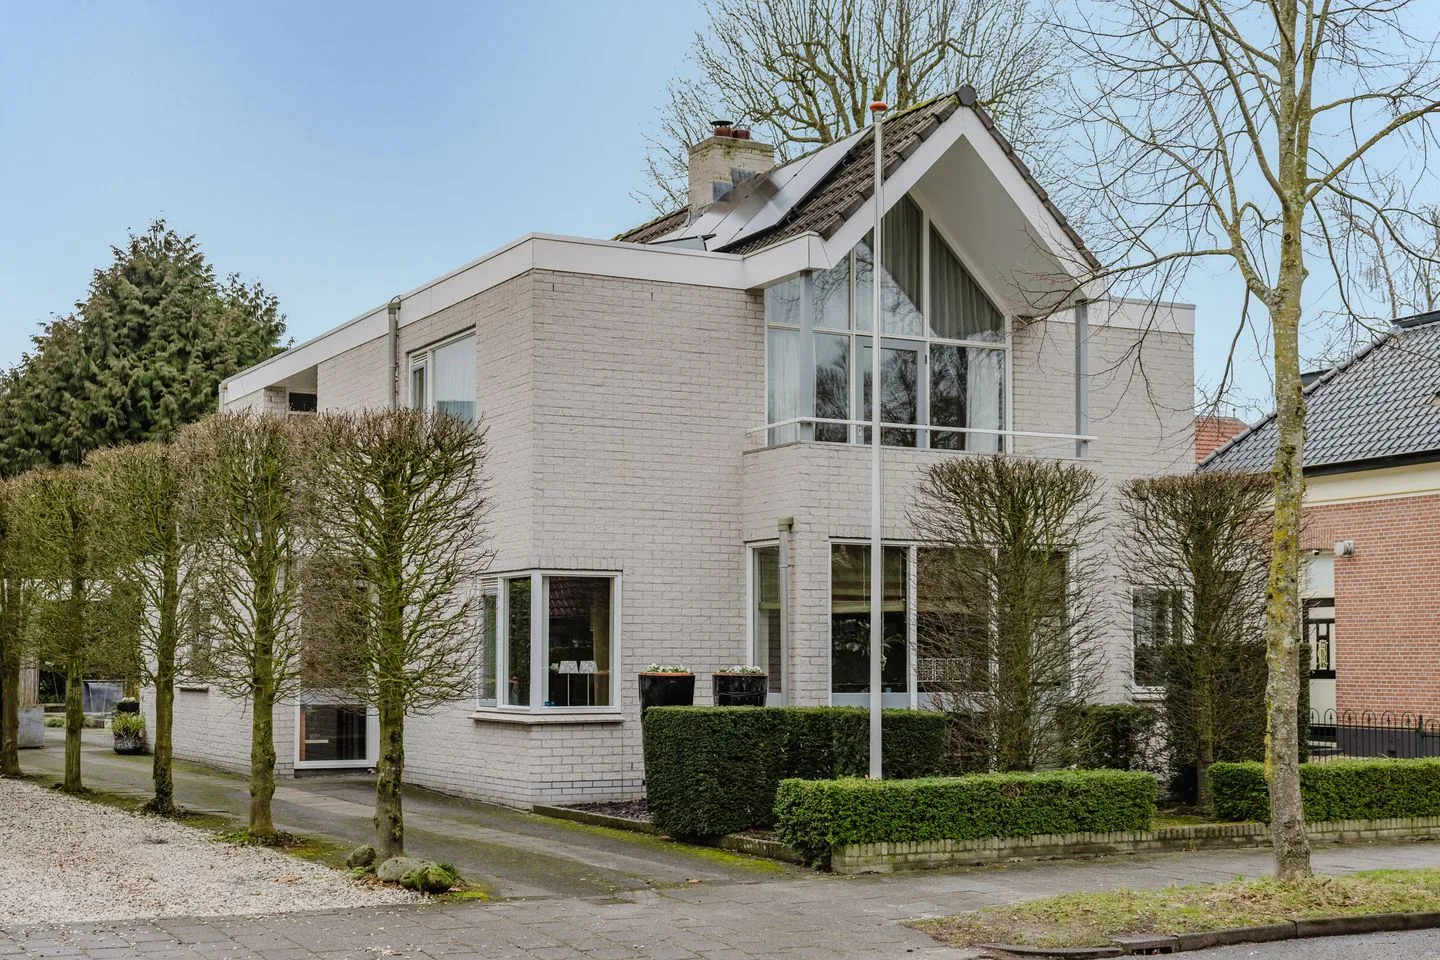
- Available
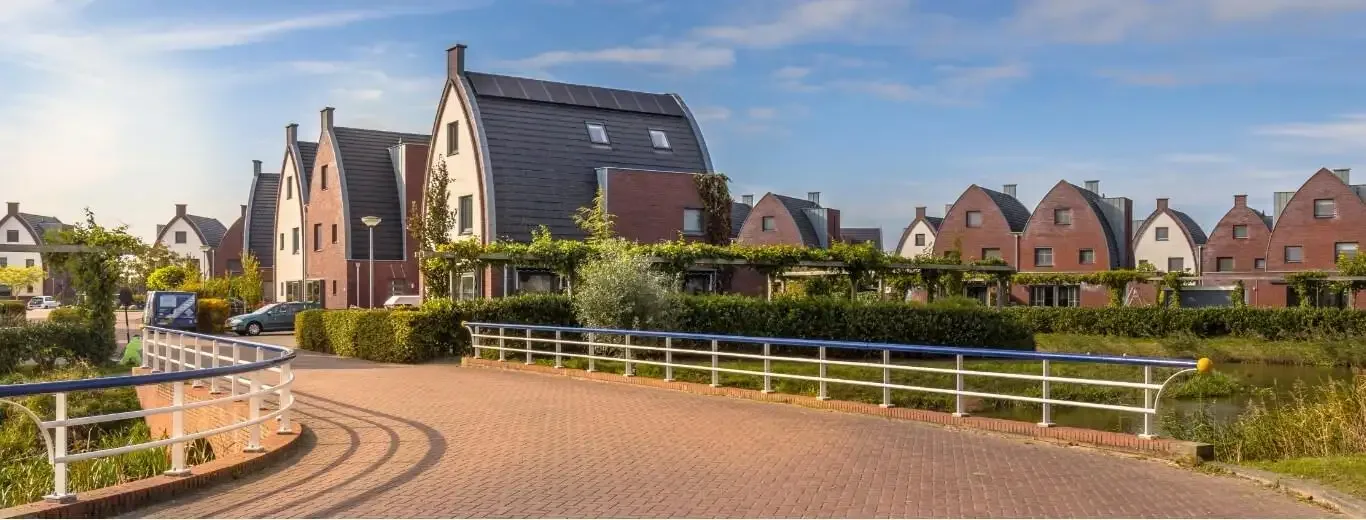
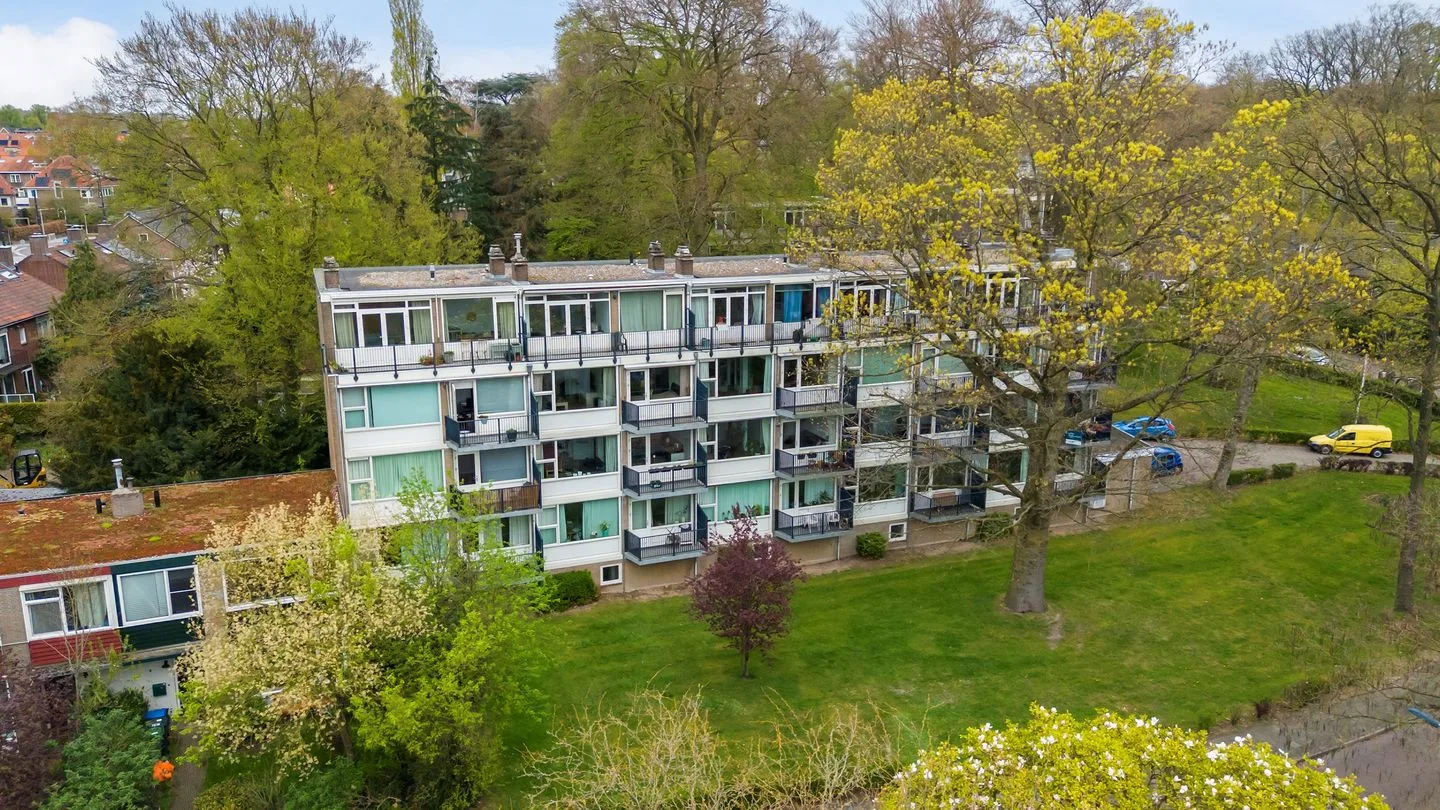
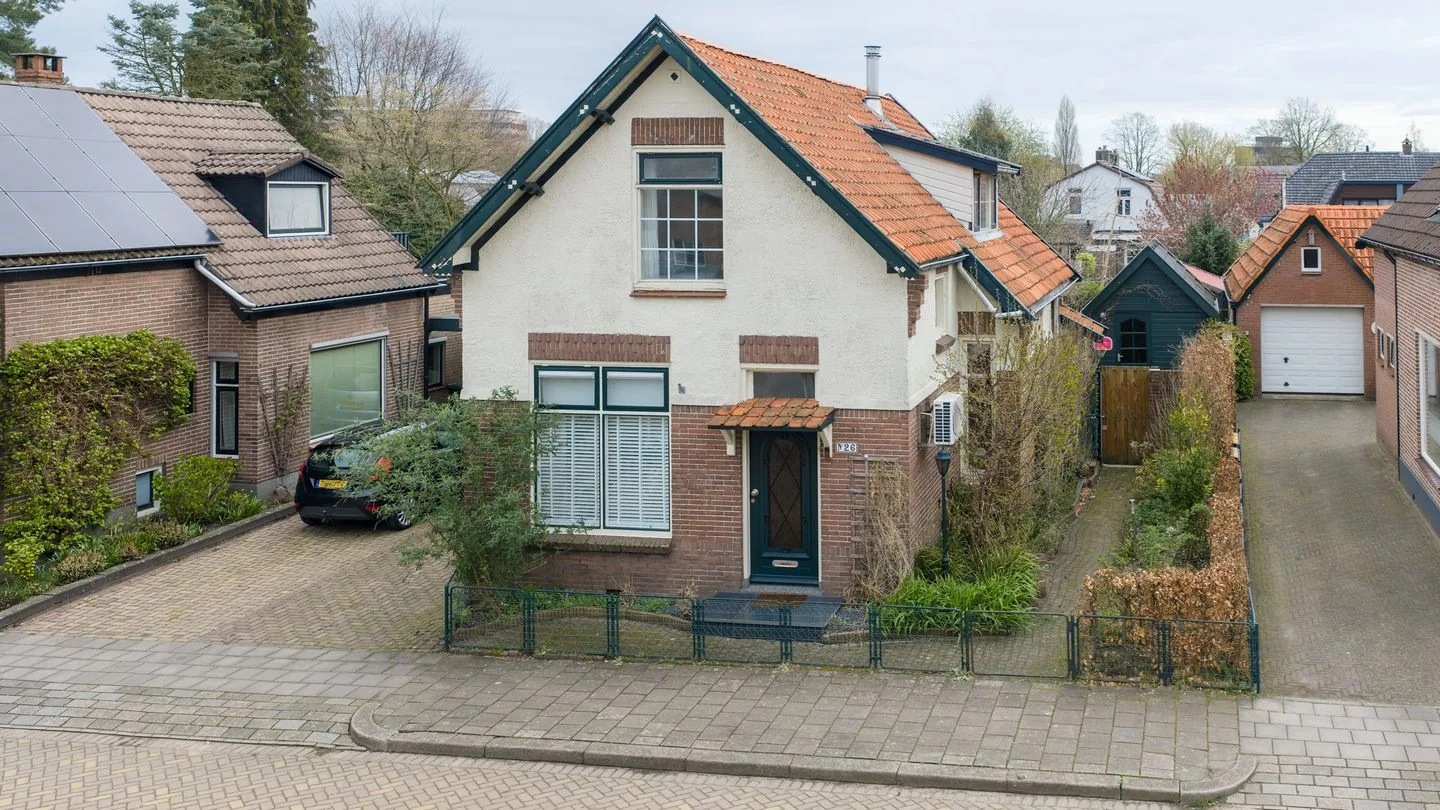
Arnhemseweg 526
7361CN Beekbergen
€ 739.000 k.k.
ASave as favorite- Living area
- 137 m²
- Land area
- 686 m²
- Bedrooms
- 3
-

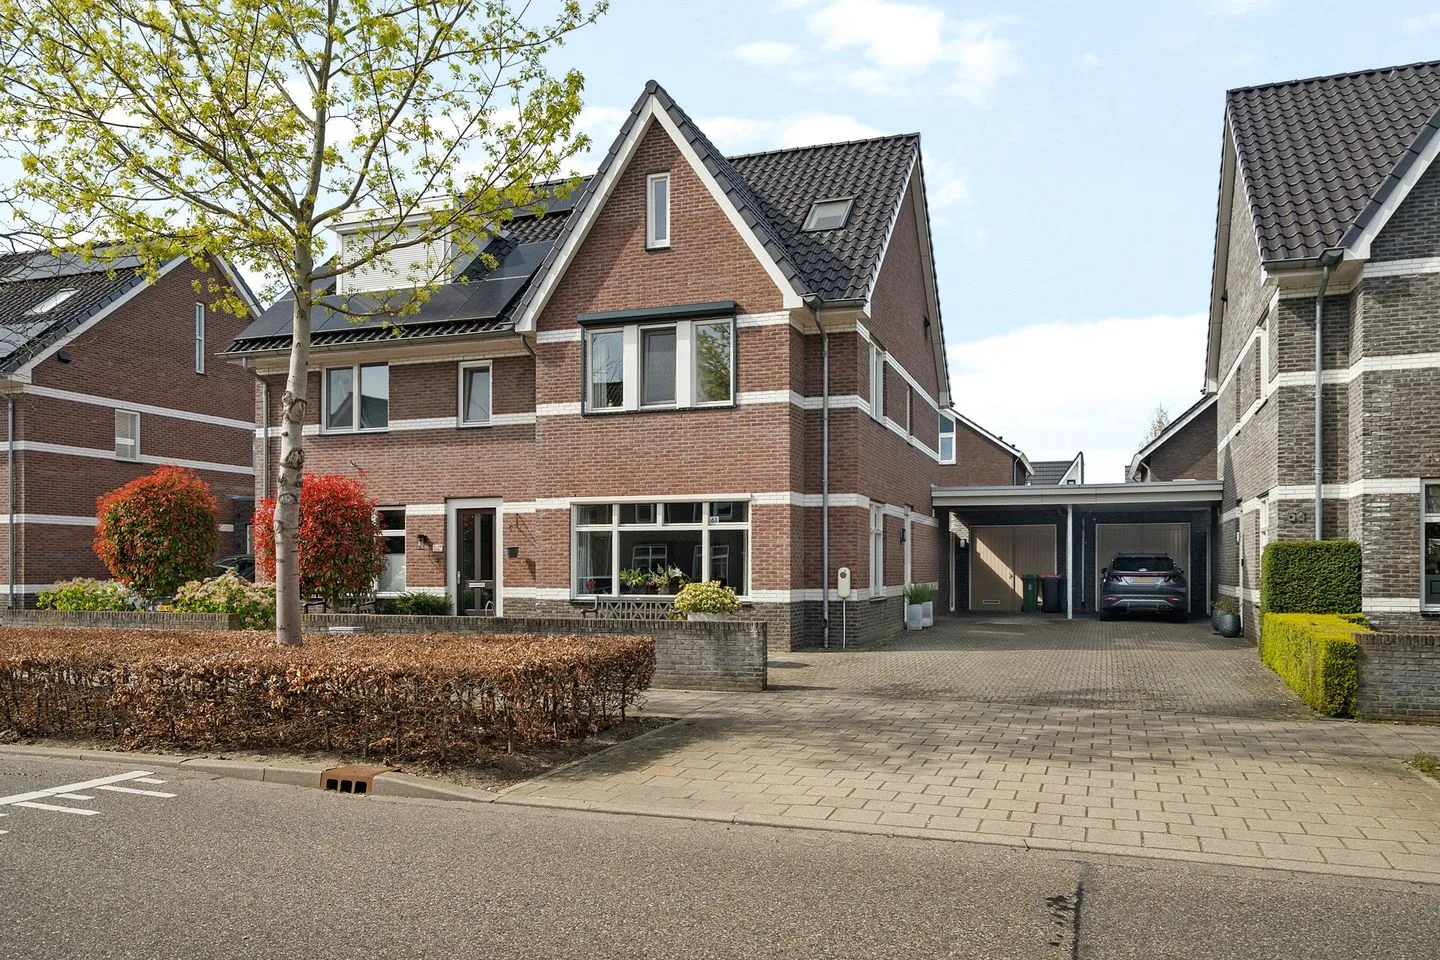
- Available
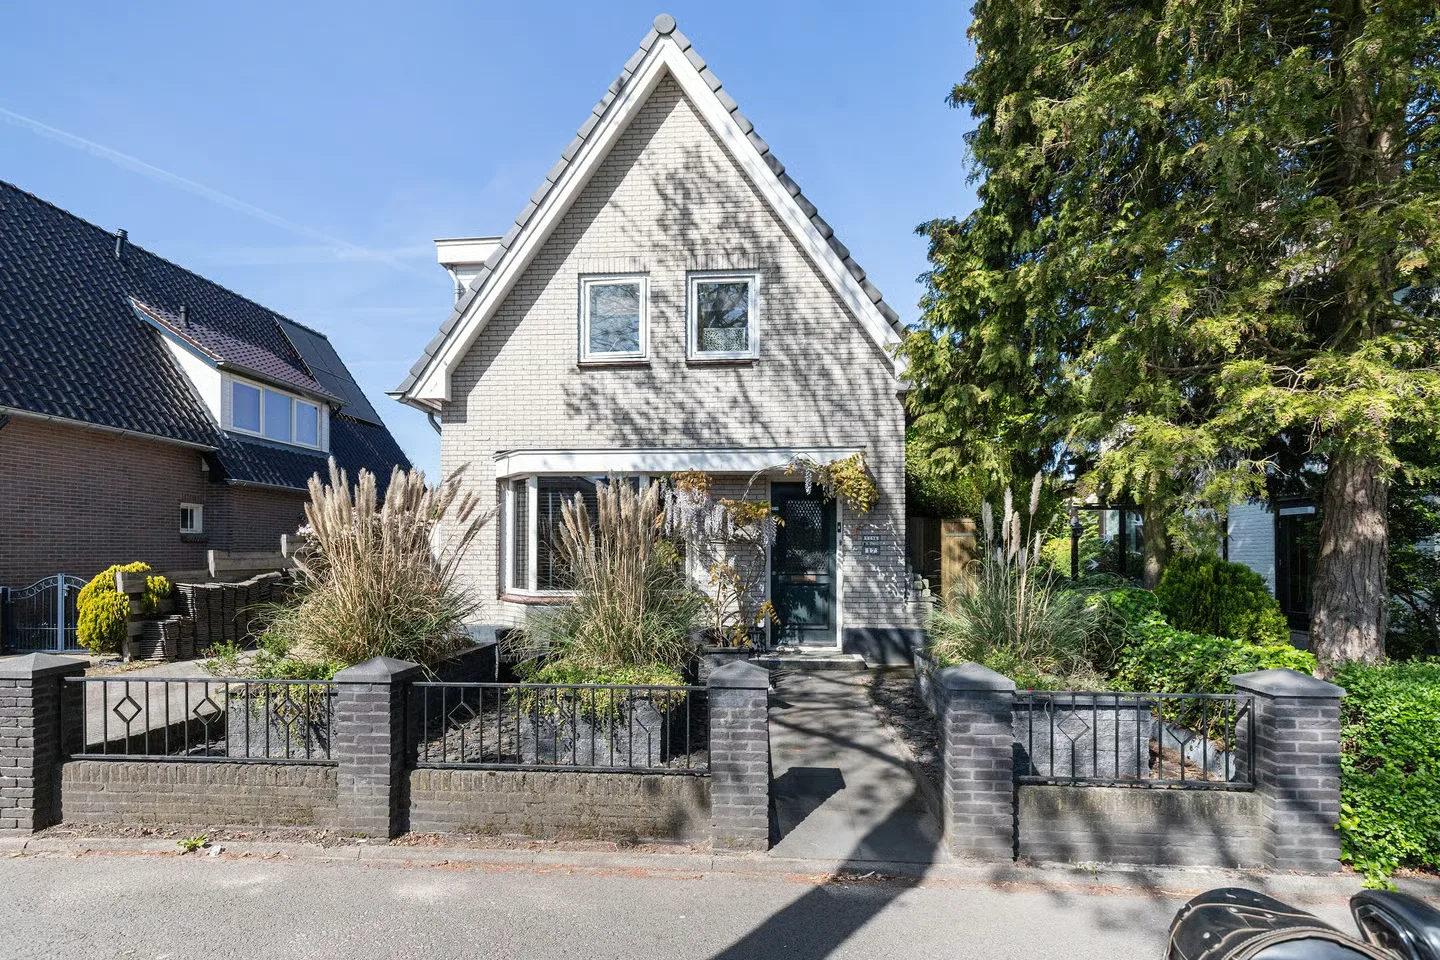
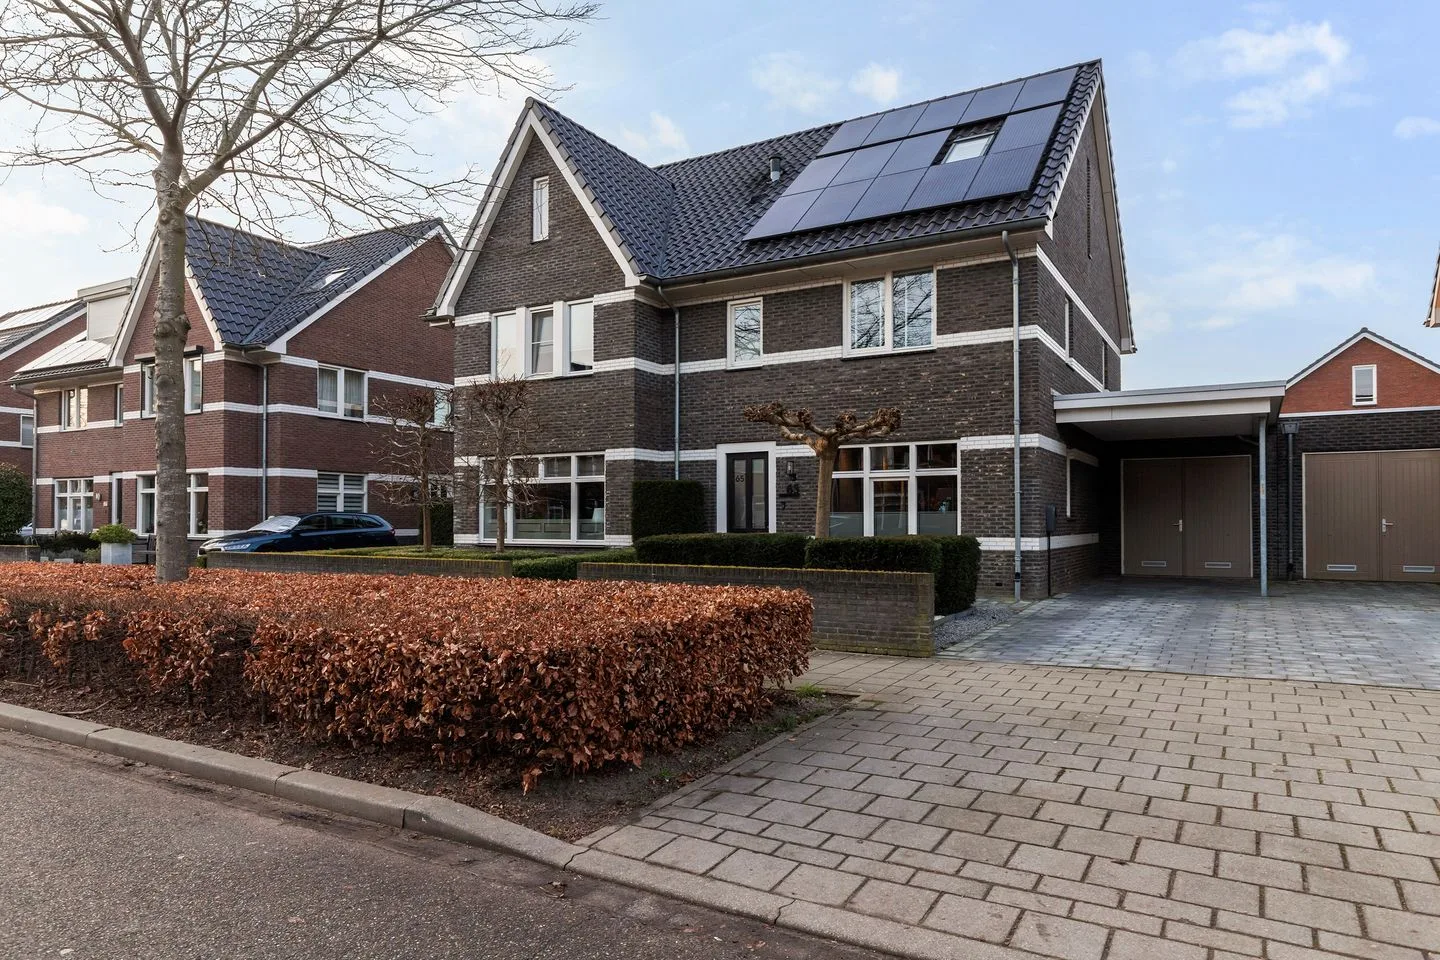
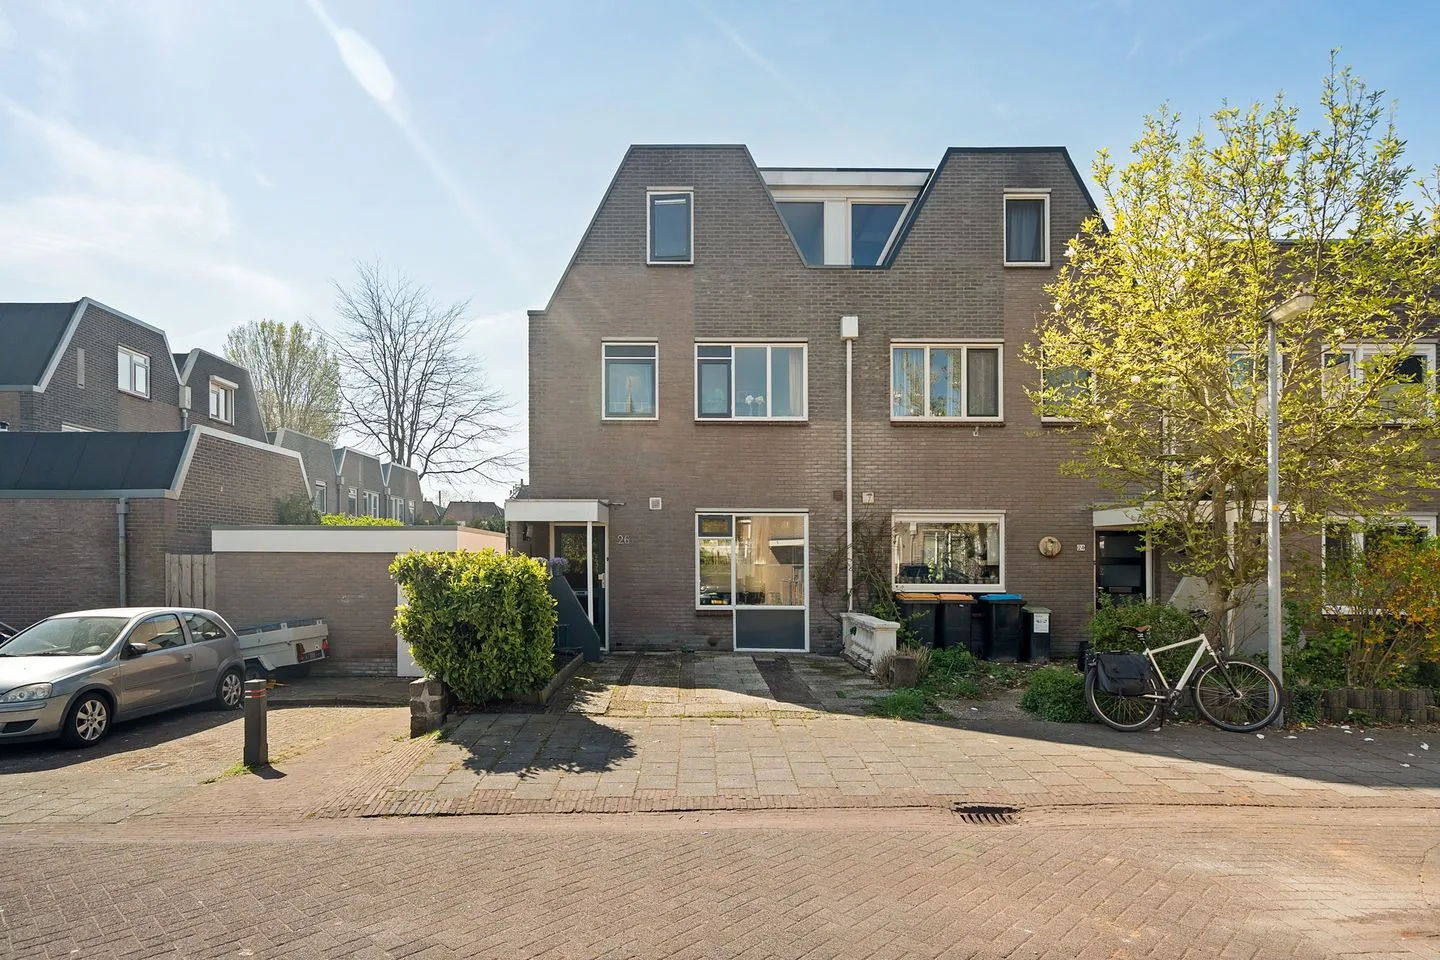
David Goskerstraat 2
7334DH Apeldoorn
€ 949.000 k.k.
€ 5.362/m²
ASave as favorite- Living area
- 177 m²
- Land area
- 402 m²
- Bedrooms
- 6
-
- Available
Dorpstraat 55 C
7361AS Beekbergen
€ 319.000 k.k.
€ 7.419/m²
BSave as favorite- Living area
- 43 m²
- Land area
- —
- Bedrooms
- 1
-

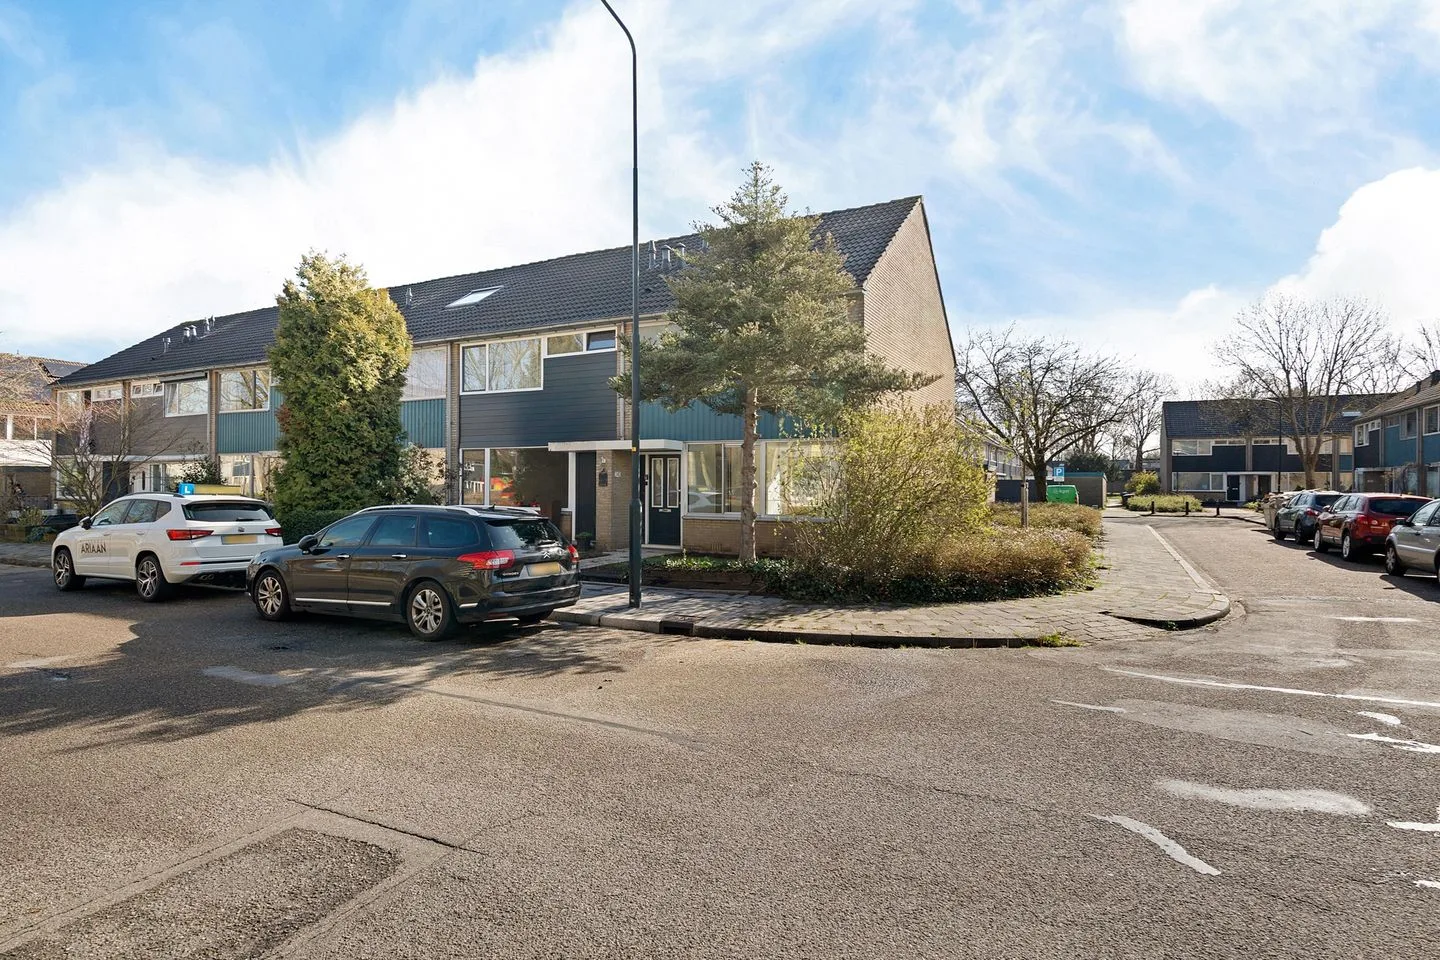
- Available
Houtsnijdershorst 141
7328VR Apeldoorn
€ 299.000 k.k.
€ 3.883/m²
BSave as favorite- Living area
- 77 m²
- Land area
- —
- Bedrooms
- 2
Reviews (84)
Review platforms
BronscoresTotal score
84 total reviews

Funda
72 reviews on Funda

12 reviews on Google
-
Webstudio Brigitte
10Al voor de tweede keer in goede handen Wij werken inmiddels voor de tweede keer samen met deze makelaar en dat is geen toeval. Ze hebben ons eerste huis perfect verkocht, daarna hebben we via hen ons huidige huis gekocht, en nu heeft de verkoop van ons tweede huis zich opnieuw vlekkeloos voltrokken. Wat ons elke keer weer opvalt is de combinatie van warmte, deskundigheid en professionaliteit. Je voelt je echt gehoord en goed begeleid, zonder dat je ooit het gevoel hebt dat je er alleen voor staat. Alle afspraken worden nagekomen, de communicatie is helder en prettig, en ze weten precies hoe ze een woning op de juiste manier in de markt zetten. Het resultaat mag er zijn maar minstens zo fijn is het proces ernaartoe. Wij bevelen deze makelaar van harte aan aan iedereen die zijn of haar woning wil verkopen of kopen. Je bent in uitstekende handen.
-
Twijndersdonk 105
10Al voor de tweede keer in goede handen Wij werken inmiddels voor de tweede keer samen met deze makelaar en dat is geen toeval. Ze hebben ons eerste huis perfect verkocht, daarna hebben we via hen ons huidige huis gekocht, en nu heeft de verkoop van ons tweede huis zich opnieuw vlekkeloos voltrokken. Wat ons elke keer weer opvalt is de combinatie van warmte, deskundigheid en professionaliteit. Je voelt je echt gehoord en goed begeleid, zonder dat je ooit het gevoel hebt dat je e…
-
Musicalstraat 132
8We zijn zeer tevreden over de verkoop van ons huis. De makelaar bracht ons telkens op de hoogte als er ontwikkelingen waren. Dit hebben we als prettig ervaren.
-
Houtsnijdershorst 151
10Top makelaar, precies wat je verwacht van een makelaar, aanrader. Houd je goed op de hoogte en denkt met je mee
-
Zanderijweg 173
8We zijn zeer tevreden over de service en betrokkenheid van de makelaar. Het kantoorteam werkt ook adequaat en komt afspraken na.
-
Dokter J. van Heuvenweg 3
10Heel fijn contact met André. Hij kent de markt en heeft veel contacten waardoor de verkoop snel verliep.
-
De Els 20
9Fijn en goed geholpen door André en Mireille bij de verkoop van onze woning. Alles is in goed overleg gebeurt
-
Hietveldweg 1
10goed en prettig geholpen door alle medewerkers klasse veel wardering voor Driessen beekbergen gr.
-
Dokter J. van Heuvenweg 32
10Een enthousiaste makelaar met kennis van zaken! Zeker aan te bevelen, fijn contact en goede begeleiding bij de verkoop van onze woning.
-
Klein Canada 27
10Alles is goed verlopen.. Fijne Makelaar die ons ook goed heeft begeleid met alles. Kortom een aanrader.
-
Dokter J. van Heuvenweg 20
10Op een prettige en goede wijze het verkooptraject gedaan voor ons met goede adviezen die gegeven zijn.
-
Het Sparrenbos 44
10Zeer tevreden, deskundig, prettig in de communicatie en resultaatgericht. Mijn huis is snel en goed verkocht. Absoluut een aanrader!
-
Krimweg 32
7Tevreden met het eindresultaat en de afwikkeling van het huis was goed geregeld de nieuwe eigenaar was ook tevreden.
-
Parkweg 3
8Translated by AIExpert real estate agent, well-informed about the local market. The whole team is pleasant to contact and easy to reach. Everything went as desired.
-
Imkersdreef 321
10Translated by AIEverything went smoothly and Mireille kept us informed of everything, we were pleasantly and professionally assisted.
-
Hoofdweg 15 A
9Translated by AIFor the sale of our parental home we have chosen Driessen because of their familiarity with the villages around Beekbergen and knowledge of matters regarding inheritance boundaries etc. Everything went smoothly!
-
Engeland 33
10Translated by AIPrettige samenwerking en gemoedelijk
-
Kruizemuntstraat 985
10Translated by AIVery satisfied from start to key handover. Always available for advice and my questions were answered properly, top
-
Miggelenbergweg 2
9Translated by AINice to work with, very accessible, clear language. We definitely recommend this real estate agent..!!
-
Evert Jan Boksweg 18
10Translated by AIDespite the tight schedule, everything went very smoothly and quickly! We were able to purchase our dream house.