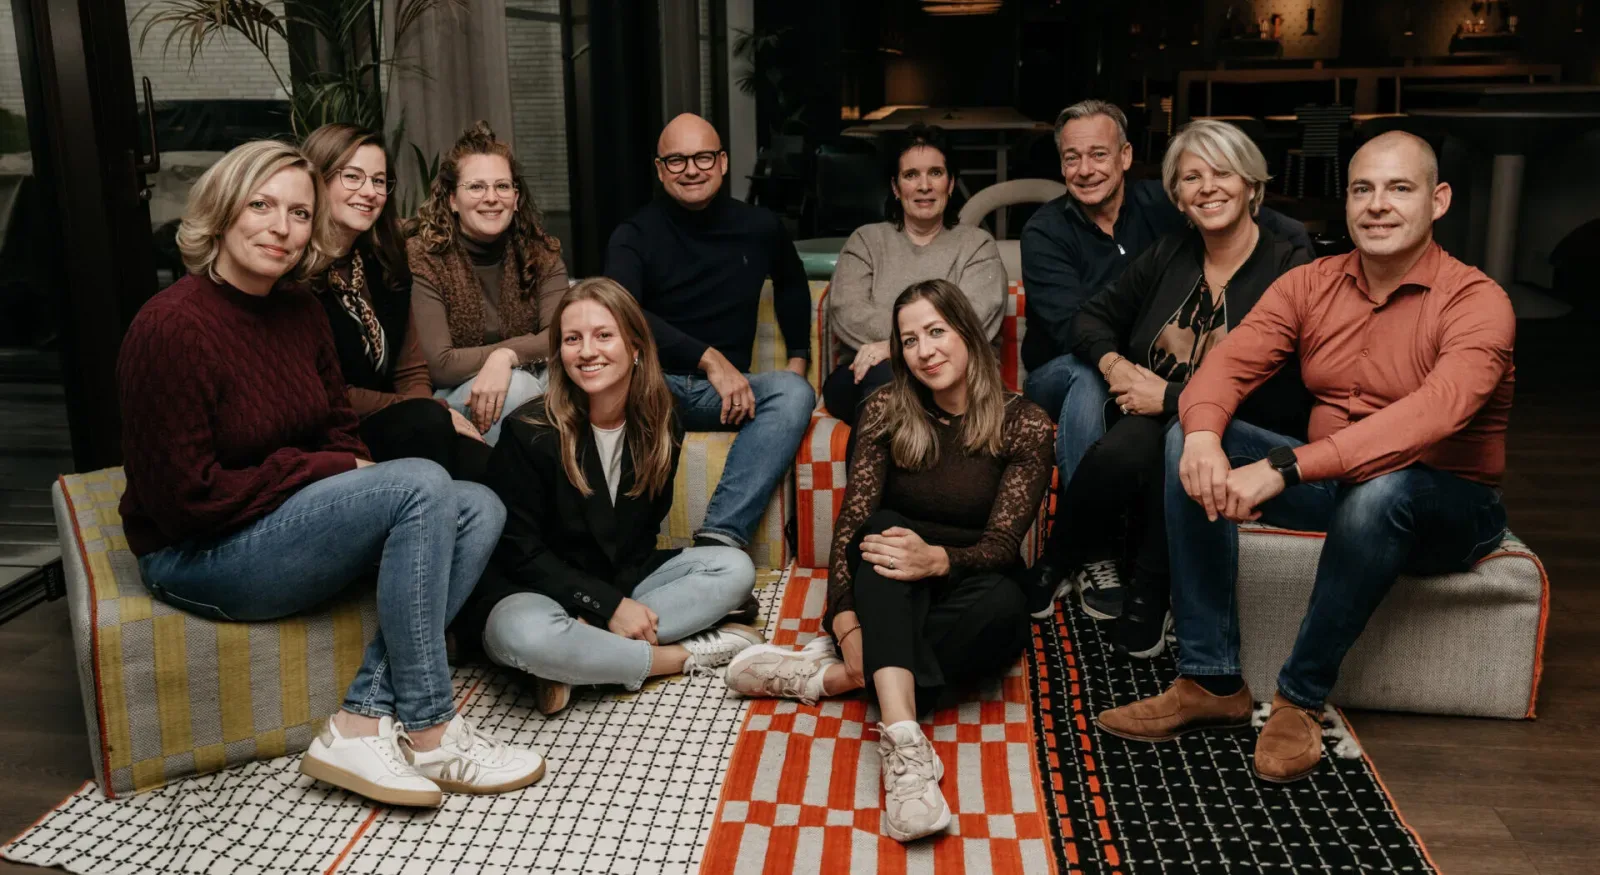
All brokers in Colijnsplaat

In Colijnsplaat are 21 real estate agents active

Connected to: Vastgoed Nederland NVM Makelaars

Uitgelichte makelaars in Colijnsplaat

Een korte selectie uit de lokale vergelijking. Bekijk de volledige lijst hieronder of vergelijk direct offertes.

Compare all brokers in Colijnsplaat

21 real estate agents in Colijnsplaat average a 8.9 out of 663 ratings! Bekijk de top 10 beste makelaars in Colijnsplaat

Welke lokale makelaar past bij jou in Colijnsplaat?

Gratis makelaarsoffertes vergelijken in Colijnsplaat

  • Quotes in Colijnsplaat
  • Non-binding
  • Personal
  • Compare free rates
  • Gratis & vrijblijvend
  • Verkoop & aankoop
  • 21 real estate agents
  • 8,9 uit 663 reviews

Ontvang gerichte offertes: makelaars in Colijnsplaat maken scherpere voorstellen als ze weten dat ze worden vergeleken. Op basis van een paar korte vragen over jouw situatie ontvang je vrijblijvend offertes van een verkoopmakelaar of aankoopmakelaar. Komt jouw woning op Funda? Dan ontvang je daarbij gratis een speciale woningwebsite.

What does a real estate agent cost in Colijnsplaat?

Compare brokers in Colijnsplaat

Comparing brokers in Colijnsplaat will help you find the right specialist for your home. In a high-end housing market like Colijnsplaat, the right real estate agent is essential for optimal sales or purchase results. Due to the large competition between brokers in Colijnsplaat, attractive rates can be found. Start requesting quotes today and find the ideal real estate agent who fits your specific situation.

Broker fees in Colijnsplaat

With an average property value of €527.223 in Colijnsplaat, real estate agent fees for sale or purchase are usually between €3.800,- and €12.500,-. The fee structure for a buyer's agent or selling agent varies: some work with a combination of startup costs and commission (1-2% of the sale price), while others charge a fixed rate. By comparing different quotes, you will find the agent who offers the best price-quality ratio for your specific situation.

Business activity in Colijnsplaat

The activity in Colijnsplaat shows a broad and varied local economy, with room for both established entrepreneurs and new initiatives. With 8 NVM real estate agents in Colijnsplaat, the real estate market is professionally organized and active. In combination with the population structure and education levels, this gives a practical picture of the economic dynamics in the area.

Market information Noord-Beveland

Recent developments in the housing market of Noord-Beveland

Average house prices in Colijnsplaat

Average house price last month

€527.223,-

In Colijnsplaat the housing market is currently very dynamic with prices well above the national average. Relevant for those who want to sell or buy a house. Based on 94 recent transactions with a high number of recent transactions in the region.

These averages are indicative and help with orientation when buying or selling a house.

Apartments

€384.873,-

Average price

Terraced houses

€543.040,-

Average price

Corner houses

€474.501,-

Average price

Bungalow

€764.473,-

Average price

two-under-one-roof

€711.751,-

Average price

Detached

€753.929,-

Average price

Comparison of brokerage fees in Colijnsplaat

Rates are based on the average house price of €527.223 in Colijnsplaat.

Agent type Startup costs Brokerage Total price
FSBO (self selling)
€0,- 0% €0,-
Internet broker
€1.595,- 0% €1.595,-
Freelance broker
€0,- 1,00% €5.272,-
Vastgoed NL real estate agent
€495,- 1,20% €6.822,-
NVM real estate agent
€695,- 1,35% €7.813,-

An online real estate agent does everything except viewings; you do those yourself.

The above prices are indicative and may vary by broker. Always request multiple quotes for an accurate price comparison.

All amounts are inclusive of 21% VAT.

Market information for sales & purchase brokers in Colijnsplaat

Current statistics for when you want to buy or sell a house and information about purchase & sale brokers in Colijnsplaat

How is the housing market in Colijnsplaat?

How much competition is there in Colijnsplaat?

How many brokers are active in Colijnsplaat?

In Colijnsplaat there are 21 active brokers available to help you as a buyer's agent or seller's agent with buying or selling a house. Finding the right broker can be a challenge, but by comparing brokers in Colijnsplaat on expertise, price and reviews, you can make an informed choice. Our platform provides an overview of all brokers in Colijnsplaat.

How many brokers are located in Colijnsplaat?

There are no brokers located in Colijnsplaat. These brokers often have extensive knowledge of the housing market in your region. Whether you want to sell or buy a house, a sales or purchase broker in Colijnsplaat can guide you through every step of the process. Easily compare brokers and receive quotes to see which broker best suits your needs.

What is the average rating of brokers in Colijnsplaat?

Real estate agents in Colijnsplaat average a score of 8.9 out of 663 reviews. These high scores provide insight into the satisfaction of previous clients. When choosing a real estate agent, however, it is also important to pay attention to their specializations, experience and rates. On our platform you can compare real estate agents in Colijnsplaat and make the ideal choice based on your personal preferences.

What is the average asking price in Colijnsplaat?

The average asking price in Colijnsplaat is €527.223,- based on april data from 94 registered properties. This price is an indication of current trends in the housing market in Colijnsplaat. Whether you want to buy or sell a house, a purchasing or selling broker in Colijnsplaat can help you make the most of this market and achieve your goals.

How many NVM real estate agents are there in Colijnsplaat?

In Colijnsplaat there are 8 NVM real estate agents active. These agents offer a guarantee of quality and professionalism because they are bound by strict guidelines. By choosing an NVM agent, you benefit from extensive knowledge and experience in the housing market of Colijnsplaat. View and compare NVM agents on our platform to find your ideal match.

How many Real Estate Netherlands agents are there in Colijnsplaat?

There are 4 Real Estate Netherlands brokers active in Colijnsplaat. Real Estate Netherlands brokers are known for their flexible services and customer-focused approach. They offer expert advice and guide you through the entire process of buying, selling or renting. Discover which Real Estate NL broker in Colijnsplaat best suits your needs.

Frequently asked questions about agents in Colijnsplaat

Nuttige informatie voor het selecteren van een passende makelaar in Colijnsplaat

Colijnsplaat on the map

Geographic orientation and real estate agent density in Colijnsplaat

Residential and neighborhood statistics in Colijnsplaat

View current location data on residents, WOZ development, housing stock, energy consumption, business activity and safety in Colijnsplaat. In 2025 were there 1.595 residents. The average WOZ value in 2025 is EUR 237.000.

Residents

1.595

Last year: 2025

Average WOZ

EUR 237.000

Last year: 2025

Average income per person.

EUR 30.700

Source: AllNumbers

Crimes (current year)

48

Total registered

Demographics and WOZ development

Inhabitants per year

Inhabitants per year in Colijnsplaat
Year Residents
2021 1.590
2022 1.590
2023 1.590
2024 1.575
2025 1.595

Annual WOZ value

WOZ value per year in Colijnsplaat
Year Average WOZ
2021 EUR 186.000
2022 EUR 202.000
2023 EUR 221.000
2024 EUR 222.000
2025 EUR 237.000

Composition of residents

Age build-up

65+: 470 0-15: 160 15-25: 145 25-45: 330 45-65: 480

Education level

Hoger

260

Praktisch

300

Middelbaar

620

Origin of residents (2025)

Europa

140

Nederland

1.330

Buiten Europa

120

Housing stock and construction periods

Types of homes

Hoekwoningen 180
Appartementen 135
Tussenwoningen 405
Vrijstaande woningen 182
Twee-onder-één-kap woningen 108

Construction period of buildings

Voor 1700 3
1700 tot 1900 115
1900 tot 1925 172
1925 tot 1950 161
1950 tot 1970 185
1970 tot 1980 77
1980 tot 1990 72
1990 tot 2000 87
2000 tot 2010 45
2010 tot 2020 132
2020 en later 80

Energy and sustainability

Energy label distribution

Label B

210

Label A

202

Label F

194

Label C

175

Label G

144

Label D

96

Label E

38

Label A++++

21

Label A+++

17

Label A+

11

Label A++

8

Label A+++++

0

Average energy consumption per year

Average energy consumption per year in Colijnsplaat
Year Gas (m3) Electricity (kWh)
2020 1.070 2.330
2021 1.220 2.480
2022 960 2.400
2023 820 2.280
2024 790 2.300

Consumption per house type

Hoekwoning

Gas: 780 • Electricity: 2.010

Huurwoning

Gas: 710 • Electricity: 1.890

Koopwoning

Gas: 880 • Electricity: 2.550

Appartement

Gas: 550 • Electricity: 1.740

Tussenwoning

Gas: 770 • Electricity: 2.040

Vrijstaande woning

Gas: 1.110 • Electricity: 3.270

Twee-onder-één-kap woning

Gas: 910 • Electricity: 2.770

Business activity in Colijnsplaat (2025)

Handel en HORECA 40
Nijverheid en energie 45
Zakelijke dienstverlening 40
Overheid, onderwijs en zorg 35
Landbouw, bosbouw en visserij 30
Vervoer, informatie en communicatie 15
Financiele diensten en onroerendgoed 10
Cultuur, recreatie en overige diensten 25

Total number of company establishments: 235

Recent crime statistics

Recent crime statistics in Colijnsplaat
Period Crimes
jan 2026 2
jul 2025 2
jun 2025 6
mei 2025 5
mrt 2025 5
mrt 2026 0
nov 2024 2
nov 2025 3
okt 2024 5
okt 2025 2
sep 2024 3
sep 2025 1

These figures give an indicative picture of safety trends in the living environment of Colijnsplaat.

Frequently asked questions about living in Colijnsplaat

Short answers based on current local statistics, handy for a quick comparison of the living environment.

Hoeveel inwoners heeft Colijnsplaat?

Colijnsplaat telt in 2025 ongeveer 1.595 inwoners.

Wat is de gemiddelde WOZ-waarde in Colijnsplaat?

De gemiddelde WOZ-waarde in Colijnsplaat is in 2025 circa € 237.000.

Wat is het gemiddelde inkomen per inwoner in Colijnsplaat?

Het gemiddelde inkomen per inwoner in Colijnsplaat ligt rond € 30.700 per jaar.

Hoe veilig is wonen in Colijnsplaat?

Voor het huidige jaar gaat het om ongeveer 48 geregistreerde misdrijven. Gebruik deze cijfers als indicatie en vergelijk trends per periode.

Welke woningtypen komen het meest voor in Colijnsplaat?

In Colijnsplaat komt vooral "Tussenwoningen" veel voor, met ongeveer 405 woningen.

Current knowledge articles

Discover everything about real estate agents and the housing market

Receive free, non-binding quotes

Compare multiple real estate agents and choose the best match.