
Steendijk Makelaars has been providing personal attention in real estate mediation for thirty years. With expertise in luxury housing projects and a solid knowledge of construction, we ensure a unique approach to every housing wish. Whether it's about simple or luxurious living, we help you tailored to your needs. Our small-scale office offers space for every wish and ensures that your home is presented in the best light. At Steendijk M...
Current housing stock
-
- Available
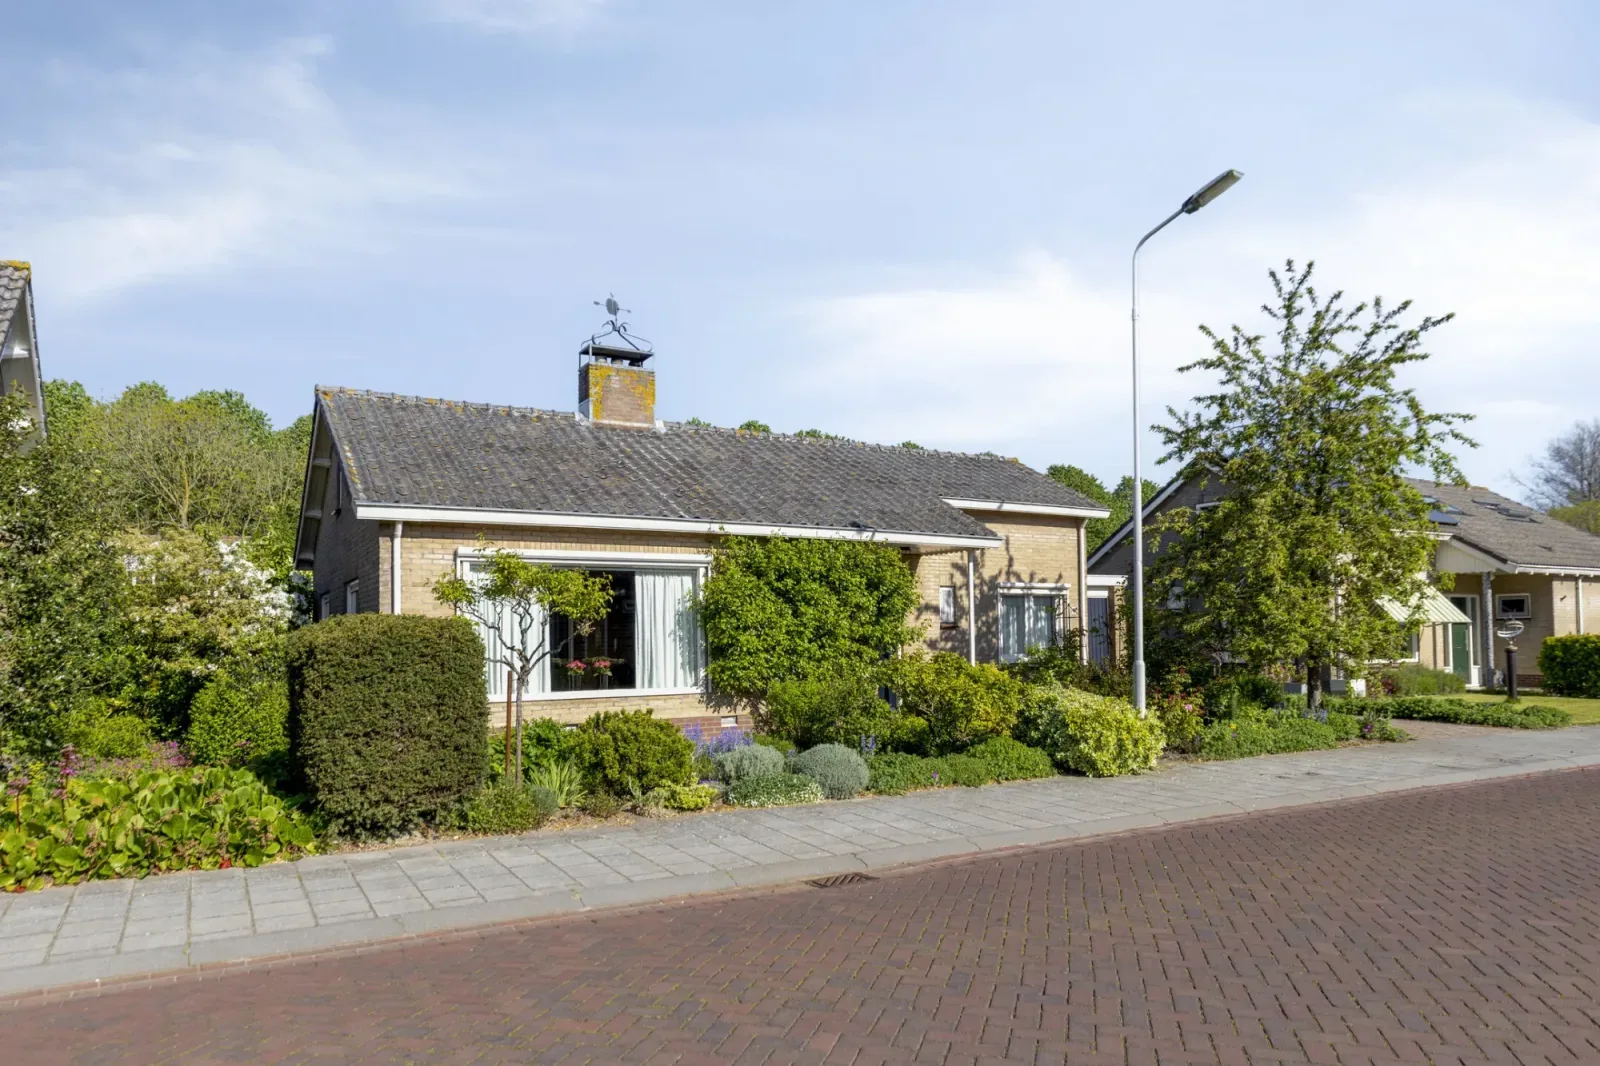
van Cittersstraat 16
4451BK Heinkenszand
€ 259.000 k.k.
€ 3.700/m²
CSave as favorite- Living area
- 70 m²
- Land area
- 169 m²
- Bedrooms
- 3
-

- Available
Langhors 12
4421TK Kapelle
€ 595.000 k.k.
ASave as favorite- Living area
- 167 m²
- Land area
- 292 m²
- Bedrooms
- 5
-

- Available
van de Plasschestraat 10
4444AG 's-Heer Abtskerke
€ 619.000 k.k.
€ 1.784/m²
CSave as favorite- Living area
- 347 m²
- Land area
- 1997 m²
- Bedrooms
- 3
-

- Available
Etty Hillesumlaan 7
4481DE Kloetinge
€ 425.000 k.k.
€ 4.167/m²
ASave as favorite- Living area
- 102 m²
- Land area
- 281 m²
- Bedrooms
- 4
-
- Available
Zuidvlietstraat 82
4461HA Goes
€ 325.000 k.k.
€ 3.779/m²
DSave as favorite- Living area
- 86 m²
- Land area
- 170 m²
- Bedrooms
- 3
-

- Available
Oosthavendijk 49
4475AB Wilhelminadorp
€ 695.000 k.k.
€ 4.633/m²
ASave as favorite- Living area
- 150 m²
- Land area
- 1204 m²
- Bedrooms
- 4
Reviews (154)
Review platforms
BronscoresTotal score
154 total reviews

Funda
80 reviews on Funda

74 reviews on Google
-
Jan Wolkerslaan 15
10Zeer tevreden over kennis en kunde en fijne en persoonlijke afstemming over de te kiezen verkoopstrategie.
-
's-Heer Elsdorpweg 17
10Het contact was super zijn heel goed geholpen door Wilbert en Martijn. Hebben ons overal bij betrokken in het proces. We zijn heel tevreden.
-
Duizendbladstraat 23
10Erg prettig contact met Ad en Martijn. Alles was snel geregeld en duidelijke afspraken. Huis binnen no-time verkocht. Zeker aan te bevelen.
-
Gardenierhof 21
9Translated by AIContact with Martijn went very well. Got a lot of tips and information, good referral to financial expert.
-
Hemstraat 26
9Translated by AISteendijk has a good local market knowledge and is expert in what they do. We also appreciate that our wishes regarding the property advertisement were heard.
-
Jeroen Koeman
8 -
Wim Hendrikse
10Translated by AIFine and transparent real estate agents, they have helped us well and guided us with the purchase of our new and the sale of our old home. Short lines and easy to reach.
-
Cort van der Lindenstraat 214
10Translated by AIFine and transparent real estate agents, they have helped us well and guided us with the purchase of our new and the sale of our old home. Short lines and easy to reach.
-
Acht Gemeten 9
10Translated by AIWe are extremely satisfied with Wilbert! He has helped us super well and has a lot of knowledge about both the neighborhood and the housing market. That gave us a lot of confidence throughout the entire process. Martijn has also worked extremely hard in the background and clearly answered all our questions. Thank you for this nice and professional guidance!
-
leo van iwaarden
10Translated by AIGood communication with Wilbert and Martin. Received good advice and sold quickly.
-
Jan-Marien Nijsse
10Translated by AIPersonal and professional service! Very happy with the smooth sale of my house.
-
Valckeslotlaan 11
10Translated by AIFine personal contact with Wilbert and Martijn. Together, the good timing was sought and found. Afterwards, a smooth and careful sale.
-
Dwarsewei 7
9Translated by AINeatly helped and good advice received during the sale process of the house Clear and fast communication during the sales process
-
Annet
10Translated by AIVery nice real estate office that actively thinks along with you. We sold our house through them and also bought another house with their help. Wilbert and Martijn are knowledgeable, considerate and you can always call them with questions. They don't let things run their course so that you quickly know where you stand. It was a very pleasant cooperation.
-
Middelmeet 10
10Translated by AIOur experience with Steendijk Makelaars was positive. Their expertise and quick response, even during holiday periods, was very pleasant. The communication also went very smoothly. A real recommendation.
-
Simone Veilhof 26
9Translated by AIExcellent advice. Fast and clear communication. Well-administered file and handy support via website.
-
esther burkhardt
10 -
Stephan van der Velden
10Translated by AISteendijk Makelaars has given us professional advice step by step and helped us sell our house. Always room for questions, no question is too silly. We recommend Steendijk if you are looking for a reliable real estate agent to sell your home.
-
Ketelkade 139
10Translated by AIfrom the first moment we came into contact with the real estate agent, it was clear that they are good at what they need to do, putting the client at ease with trust. they do this step by step and are always available for thorough explanations. we look back on a nice collaboration.
-
J.J. Boeijesweg 5 0011
10Translated by AIAn amazing real estate agent and team who guide you from A to Z in the sale, thoughtful and professional, an absolute recommendation!