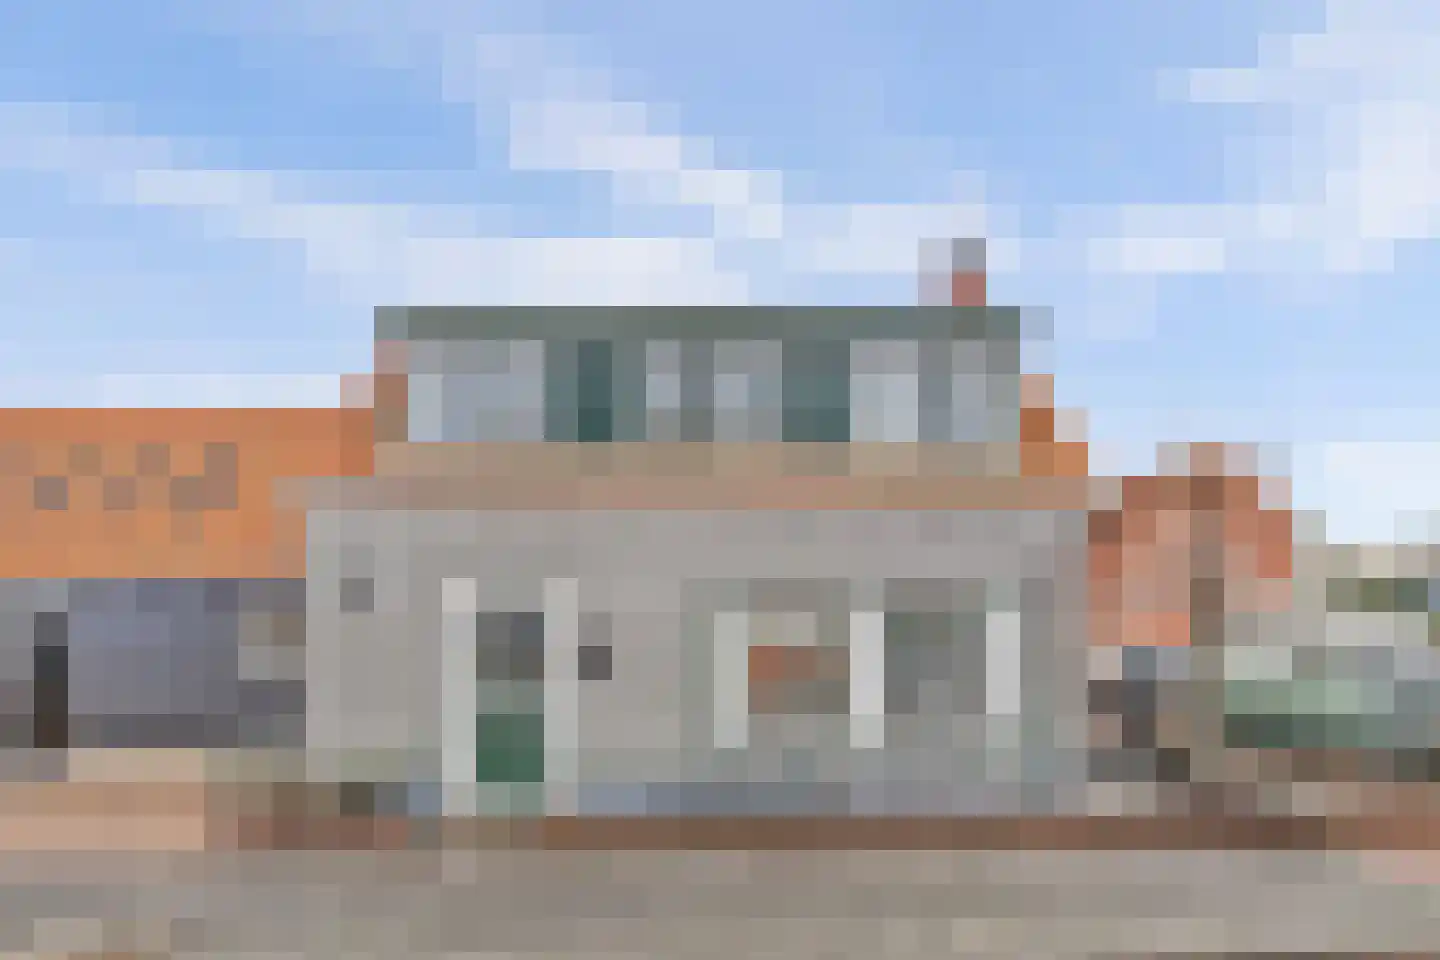
- Available
Kruisstraat 5 c
4486AS Colijnsplaat
€ 199.000 k.k.
€ 4.523/m²
- Living area
- 44 m²
- Land area
- —
- Bedrooms
- 1
Searching in 23 houses in Colijnsplaat
Type to search. Use arrow down and arrow up to navigate through results and press Enter to open.
Hidden search suggestions.
View current properties in Colijnsplaat or search targeted on street, postal code and property characteristics.
View the current housing stock in Colijnsplaat and quickly filter by price, living area, rooms and more. There are currently 23 houses in this place within our selection. View also 13 sold houses in Colijnsplaat for extra insight into the local housing market.
4486AS Colijnsplaat
€ 199.000 k.k.
€ 4.523/m²
4486BB Colijnsplaat
€ 299.000 k.k.
€ 3.181/m²
4486DZ Colijnsplaat
€ 499.000 k.k.
€ 5.253/m²
4486AG Colijnsplaat
€ 569.000 k.k.
€ 1.962/m²
4486BE Colijnsplaat
€ 575.000 k.k.
€ 3.230/m²
4486AR Colijnsplaat
€ 775.000 k.k.
€ 2.969/m²
4486PL Colijnsplaat
€ 599.000 k.k.
€ 4.753/m²
4486BM Colijnsplaat
€ 395.000 k.k.
€ 3.038/m²
4486AB Colijnsplaat
€ 175.000 k.k.
€ 2.160/m²
4486BP Colijnsplaat
€ 225.000 k.k.
€ 4.412/m²
4486BK Colijnsplaat
€ 365.000 k.k.
€ 2.897/m²
4486AC Colijnsplaat
€ 165.000 k.k.
€ 2.200/m²
4486CA Colijnsplaat
€ 585.000 k.k.
€ 5.043/m²
4486BE Colijnsplaat
€ 239.000 k.k.
€ 2.950/m²
4486AS Colijnsplaat
€ 189.000 k.k.
€ 5.108/m²
4486BP Colijnsplaat
€ 219.000 k.k.
€ 3.369/m²
4486BB Colijnsplaat
€ 239.500 k.k.
€ 2.348/m²
4486PV Colijnsplaat
€ 850.000 k.k.
€ 0/m²
4486BR Colijnsplaat
€ 375.000 k.k.
€ 2.083/m²
4486AB Colijnsplaat
€ 209.000 k.k.
€ 3.073/m²
4486AZ Colijnsplaat
€ 259.000 k.k.
€ 4.111/m²
4486AE Colijnsplaat
€ 345.500
€ 4.163/m²
4486AE Colijnsplaat
€ 302.500
€ 3.689/m²
Get free quotes from real estate agents with local market knowledge. Compare more than 21 real estate agents in Colijnsplaat.
Selling a home in Colijnsplaat? Compare all real estate agents in Colijnsplaat or view the top 10 real estate agents in Colijnsplaat for extra context for your choice.
Real estate agents make sharper offers when they know you're comparing — ask for quotes for sale or purchase.
Practical answers about housing supply, sales and comparing real estate agents in Colijnsplaat.
The costs of a real estate agent in Colijnsplaat depend on commission, setup costs, property presentation and the chosen service. Compare the 21 real estate agents in Colijnsplaat via the real estate agent page and request multiple quotes to compare rates and approach well.
Within our selection, we are currently showing 23 houses in Colijnsplaat. View also the sold houses in Colijnsplaat to compare the current offering with recent transactions.
Take into account not only price and living area but also maintenance, energy label, location, outdoor space and sales status. This way you compare houses in Colijnsplaat on more than just the asking price.
A local real estate agent knows the neighborhoods, recent transactions and demand in Colijnsplaat. By comparing 21 real estate agents in the region you get a better insight into prices, sales strategy and expected yield; the top 10 in Colijnsplaat provides a useful starting point.
Yes, when making a sales plan, a valuation in Colijnsplaat is wise. You gain insight into a realistic asking price and can then compare offers from real estate agents specifically.
View current location data on residents, WOZ development, housing stock, energy consumption, business activity and safety in Colijnsplaat. In 2025 were there 1.595 residents. The average WOZ value in 2025 is EUR 237.000.
These figures help to better assess and compare the housing stock in Colijnsplaat with recent sold homes. Orient yourself then on suitable top real estate agents in Colijnsplaat for sales advice in this region.
Residents
1.595
Last year: 2025
Average WOZ
EUR 237.000
Last year: 2025
Average income per person.
EUR 30.700
Source: AllNumbers
Crimes (current year)
48
Total registered
| Year | Residents |
|---|---|
| 2021 | 1.590 |
| 2022 | 1.590 |
| 2023 | 1.590 |
| 2024 | 1.575 |
| 2025 | 1.595 |
| Year | Average WOZ |
|---|---|
| 2021 | EUR 186.000 |
| 2022 | EUR 202.000 |
| 2023 | EUR 221.000 |
| 2024 | EUR 222.000 |
| 2025 | EUR 237.000 |
Hoger
260
Praktisch
300
Middelbaar
620
Europa
140
Nederland
1.330
Buiten Europa
120
Label B
210
Label A
202
Label F
194
Label C
175
Label G
144
Label D
96
Label E
38
Label A++++
21
Label A+++
17
Label A+
11
Label A++
8
Label A+++++
0
| Year | Gas (m3) | Electricity (kWh) |
|---|---|---|
| 2020 | 1.070 | 2.330 |
| 2021 | 1.220 | 2.480 |
| 2022 | 960 | 2.400 |
| 2023 | 820 | 2.280 |
| 2024 | 790 | 2.300 |
Hoekwoning
Gas: 780 • Electricity: 2.010
Huurwoning
Gas: 710 • Electricity: 1.890
Koopwoning
Gas: 880 • Electricity: 2.550
Appartement
Gas: 550 • Electricity: 1.740
Tussenwoning
Gas: 770 • Electricity: 2.040
Vrijstaande woning
Gas: 1.110 • Electricity: 3.270
Twee-onder-één-kap woning
Gas: 910 • Electricity: 2.770
Total number of company establishments: 235
| Period | Crimes |
|---|---|
| jan 2026 | 2 |
| jul 2025 | 2 |
| jun 2025 | 6 |
| mei 2025 | 5 |
| mrt 2025 | 5 |
| mrt 2026 | 0 |
| nov 2024 | 2 |
| nov 2025 | 3 |
| okt 2024 | 5 |
| okt 2025 | 2 |
| sep 2024 | 3 |
| sep 2025 | 1 |
These figures give an indicative picture of safety trends in the living environment of Colijnsplaat.
Short answers based on current local statistics, handy for a quick comparison of the living environment.
Colijnsplaat telt in 2025 ongeveer 1.595 inwoners.
De gemiddelde WOZ-waarde in Colijnsplaat is in 2025 circa € 237.000.
Het gemiddelde inkomen per inwoner in Colijnsplaat ligt rond € 30.700 per jaar.
Voor het huidige jaar gaat het om ongeveer 48 geregistreerde misdrijven. Gebruik deze cijfers als indicatie en vergelijk trends per periode.
In Colijnsplaat komt vooral "Tussenwoningen" veel voor, met ongeveer 405 woningen.