Uwtweedehuismakelaar staat voor betrouwbare en gedetailleerde bemiddeling in de aankoop en verkoop van chalets en vakantiehuisjes op recreatieparken in Nederland. Met een sterke focus op de regio Amersfoort en omgeving, helpen we u graag bij het vinden van uw ideale tweede huis. Wij combineren passie voor recreatiewoningen met professionele expertise om u te begeleiden vanaf de eerste stap tot het sluiten van de deal. Onze dienstverleni...
Current housing stock
-
- Available
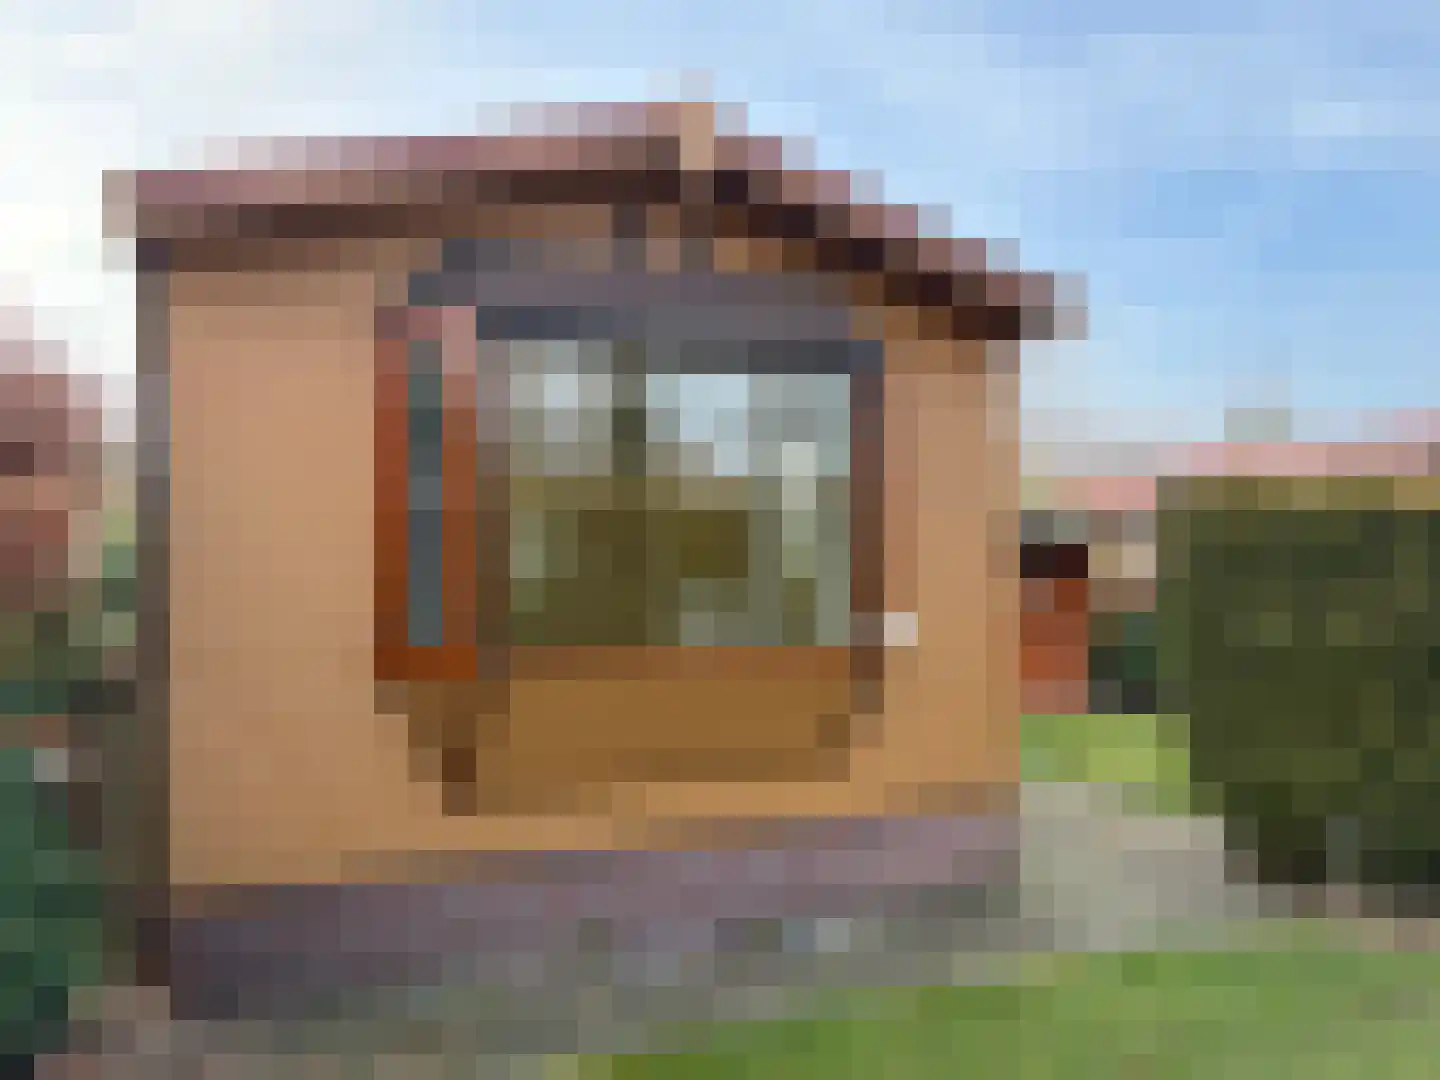
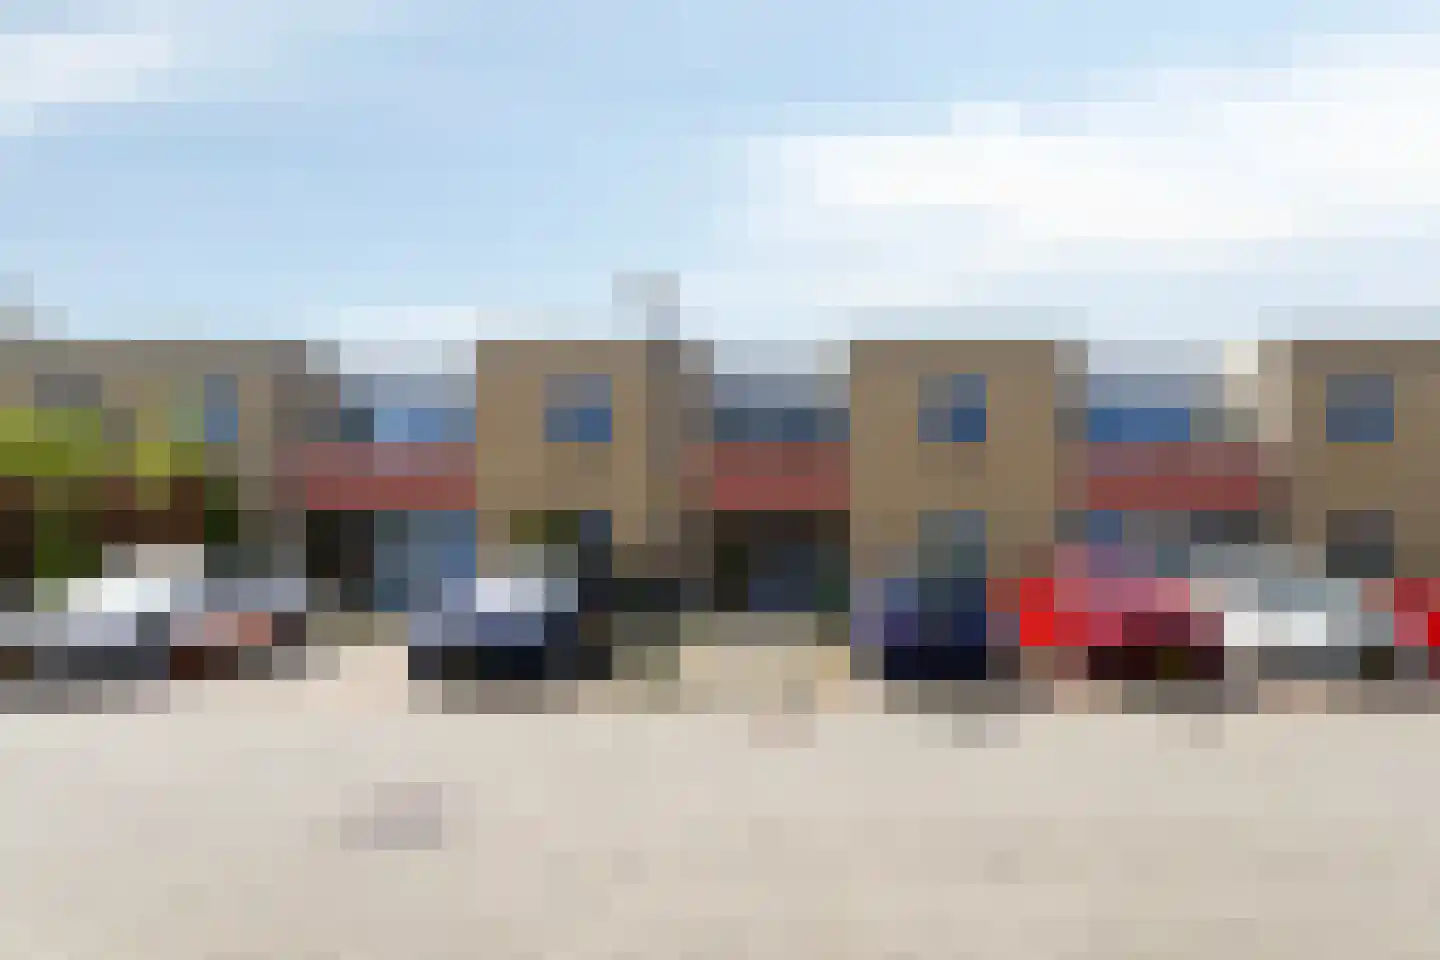
Maalbekerweg 25 2331
5951NS Belfeld
€ 104.750 k.k.
Save as favorite- Living area
- 28 m²
- Land area
- 159 m²
- Bedrooms
- 1
-

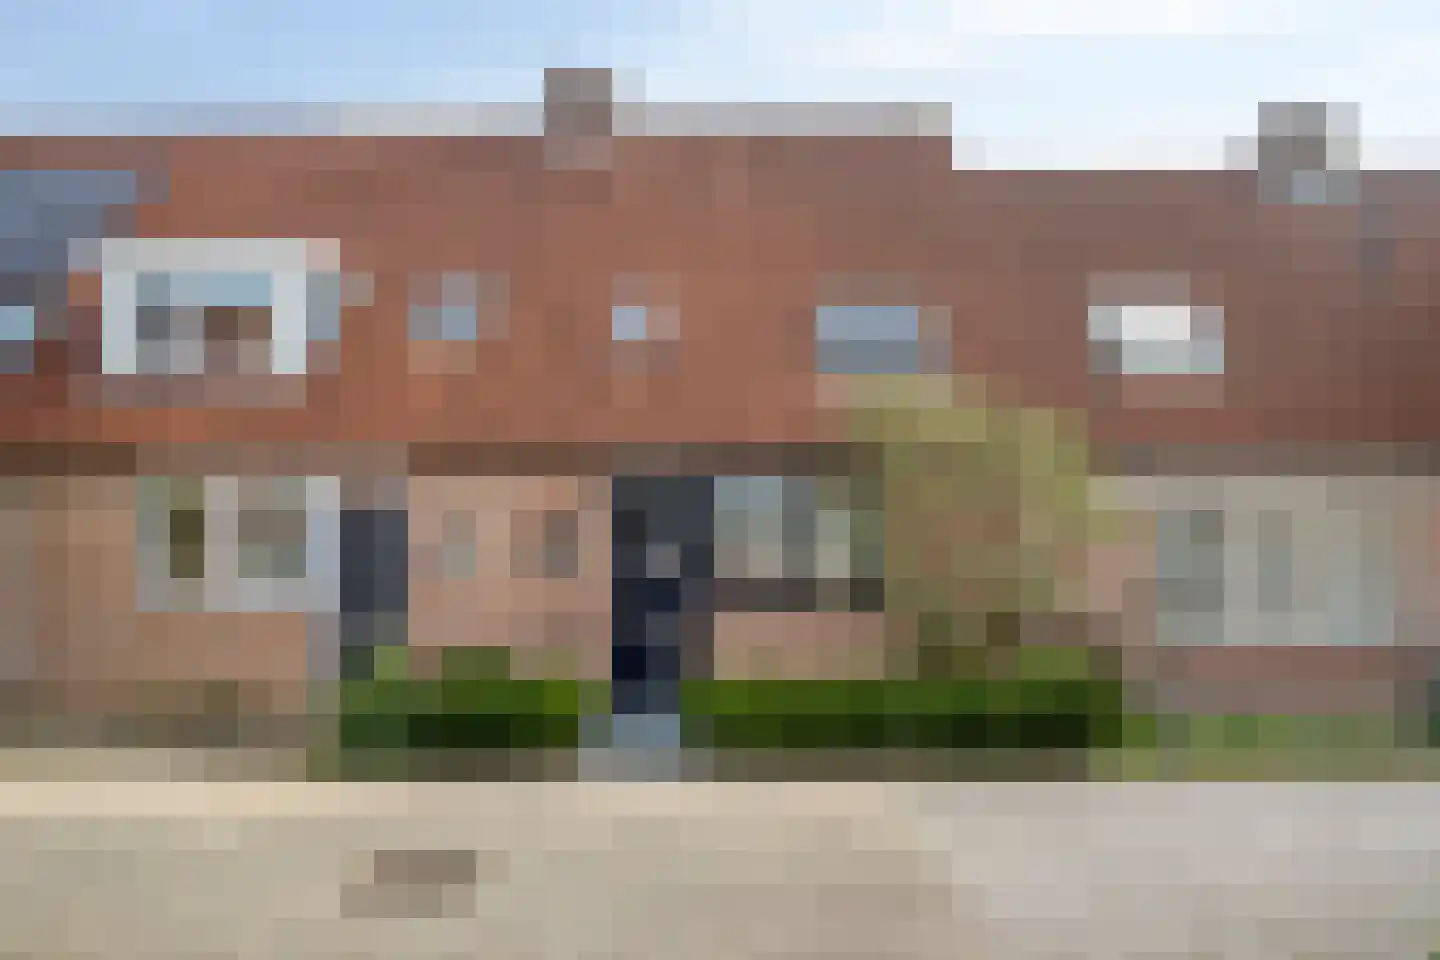
- Available
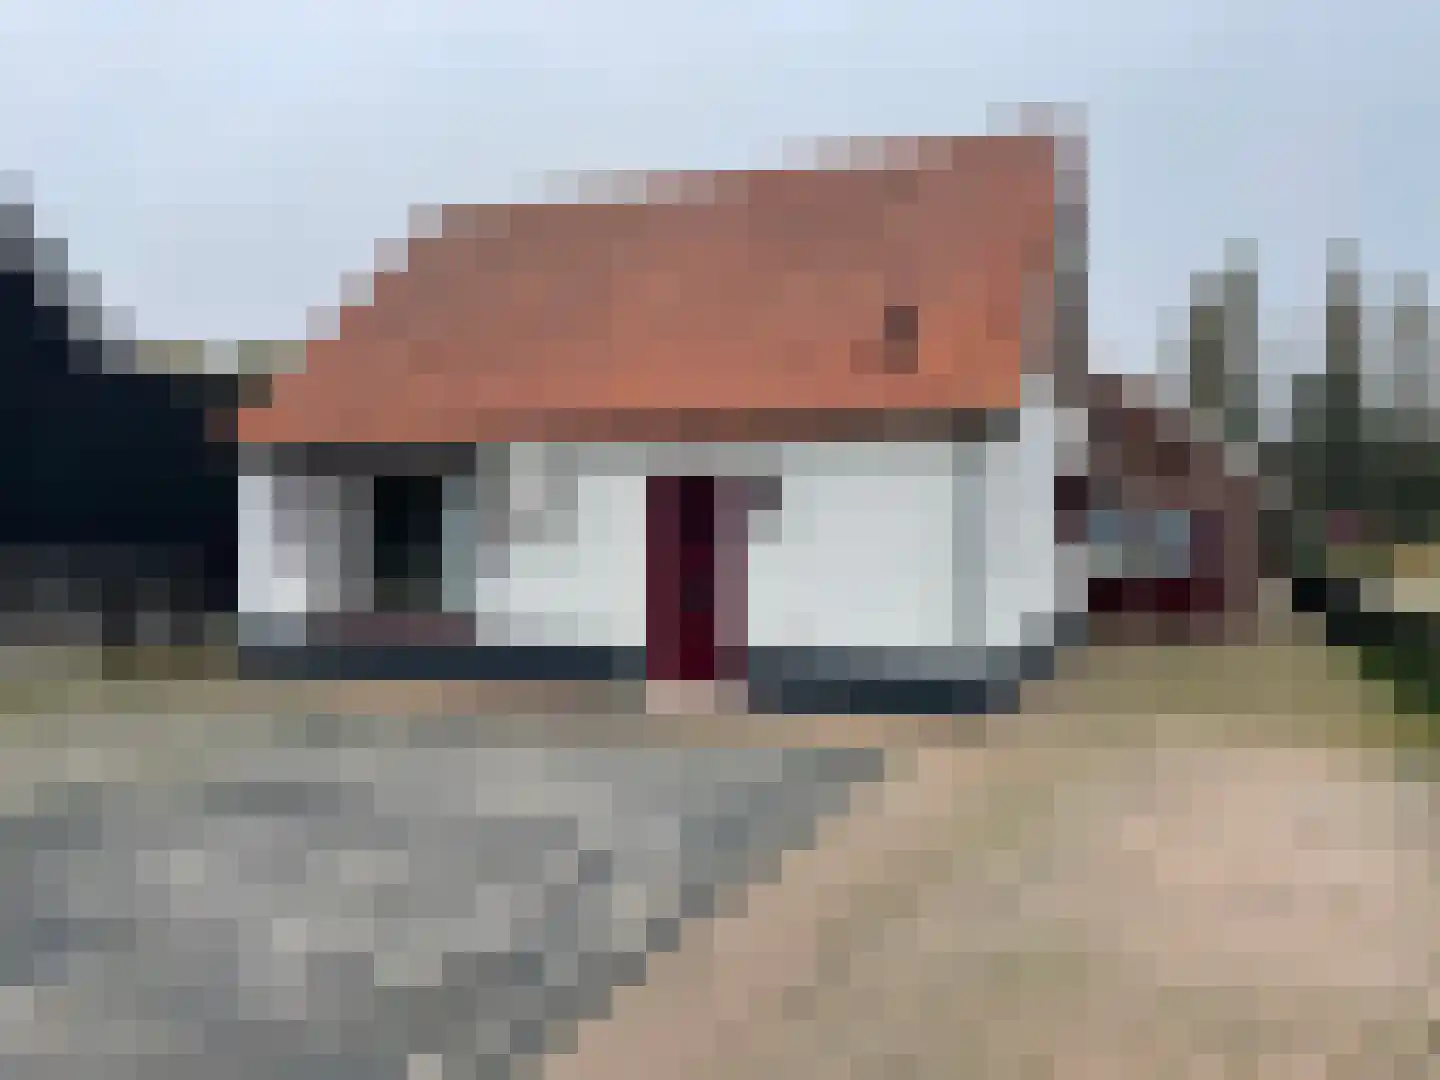
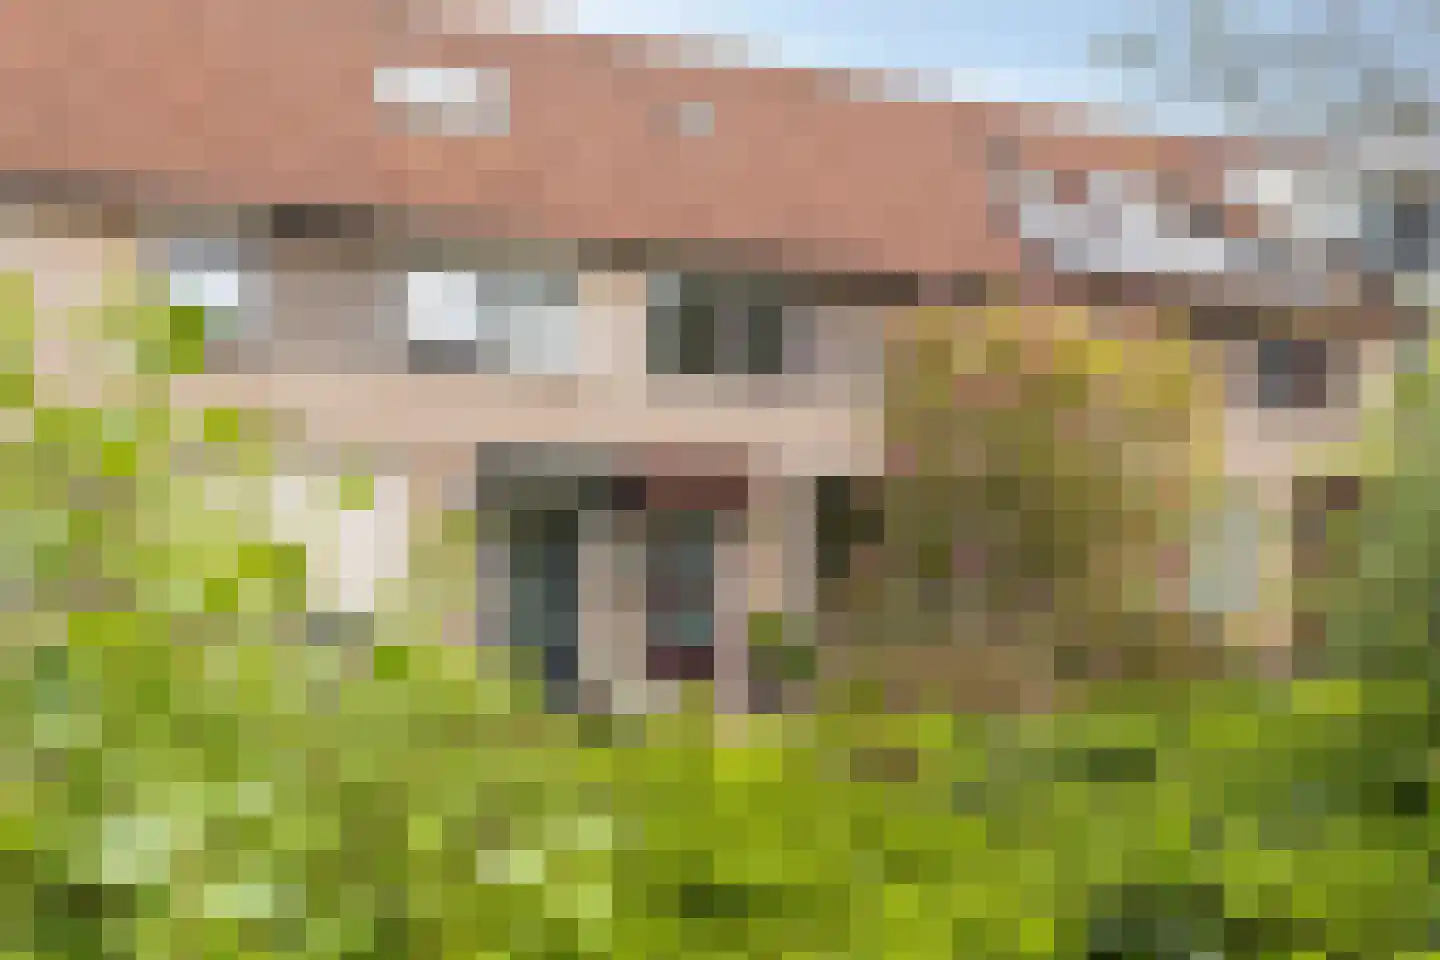
Vijverlaan 1 BG66
6731CK Otterlo
€ 395.000 k.k.
Save as favorite- Living area
- 111 m²
- Land area
- 450 m²
- Bedrooms
- 4
-
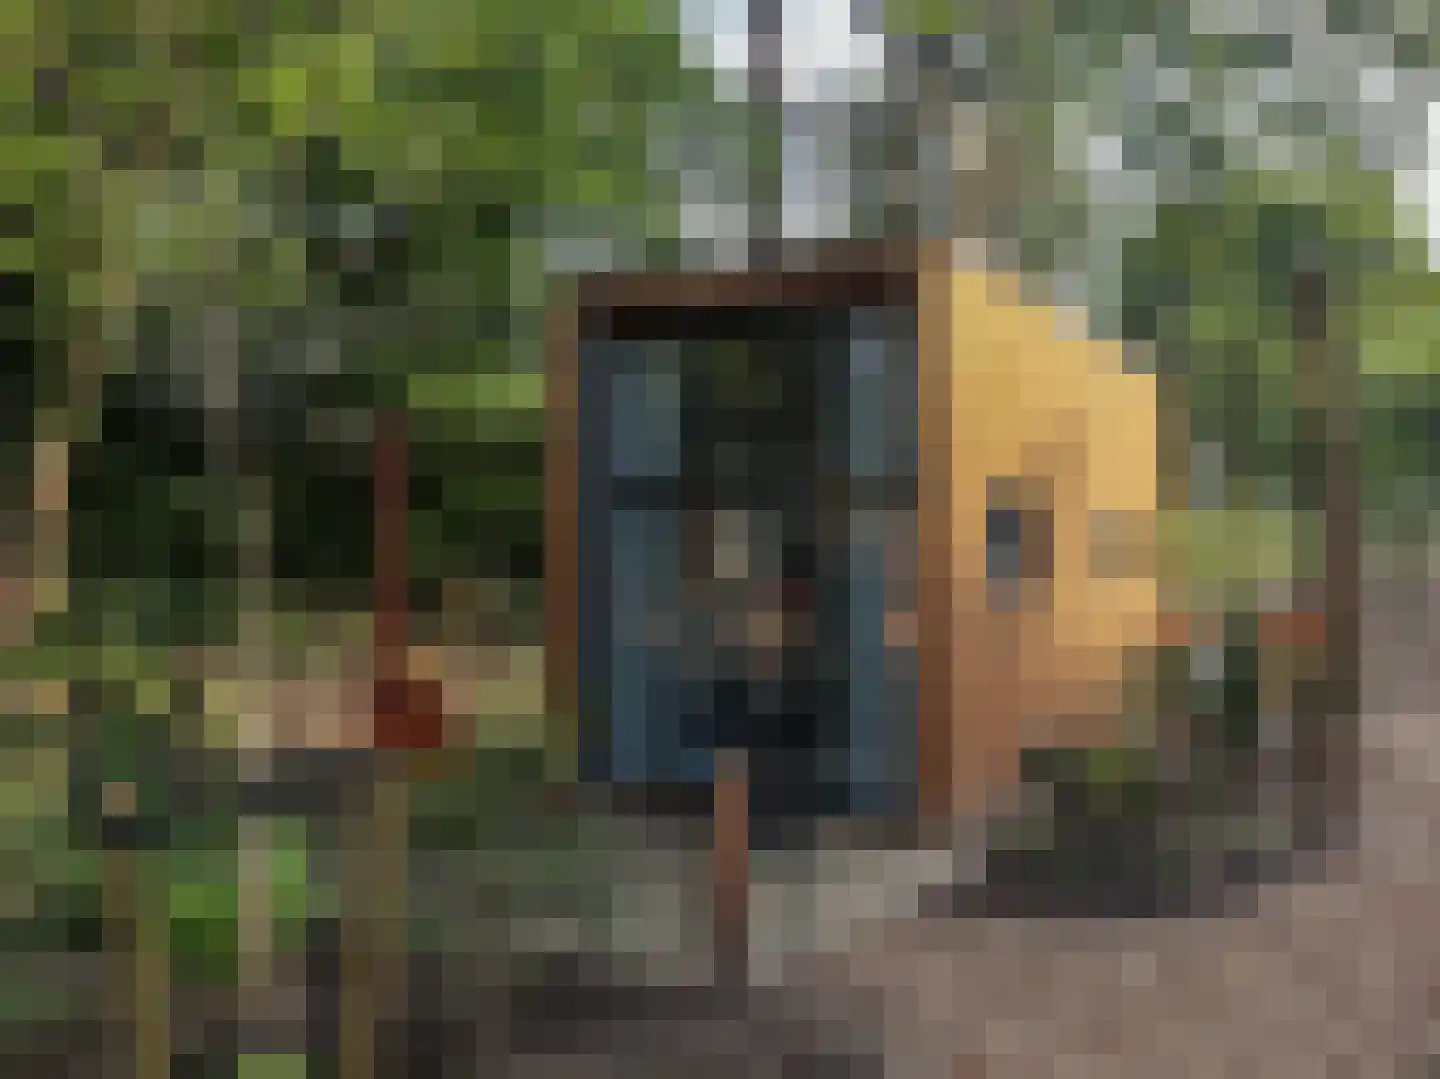
- Available
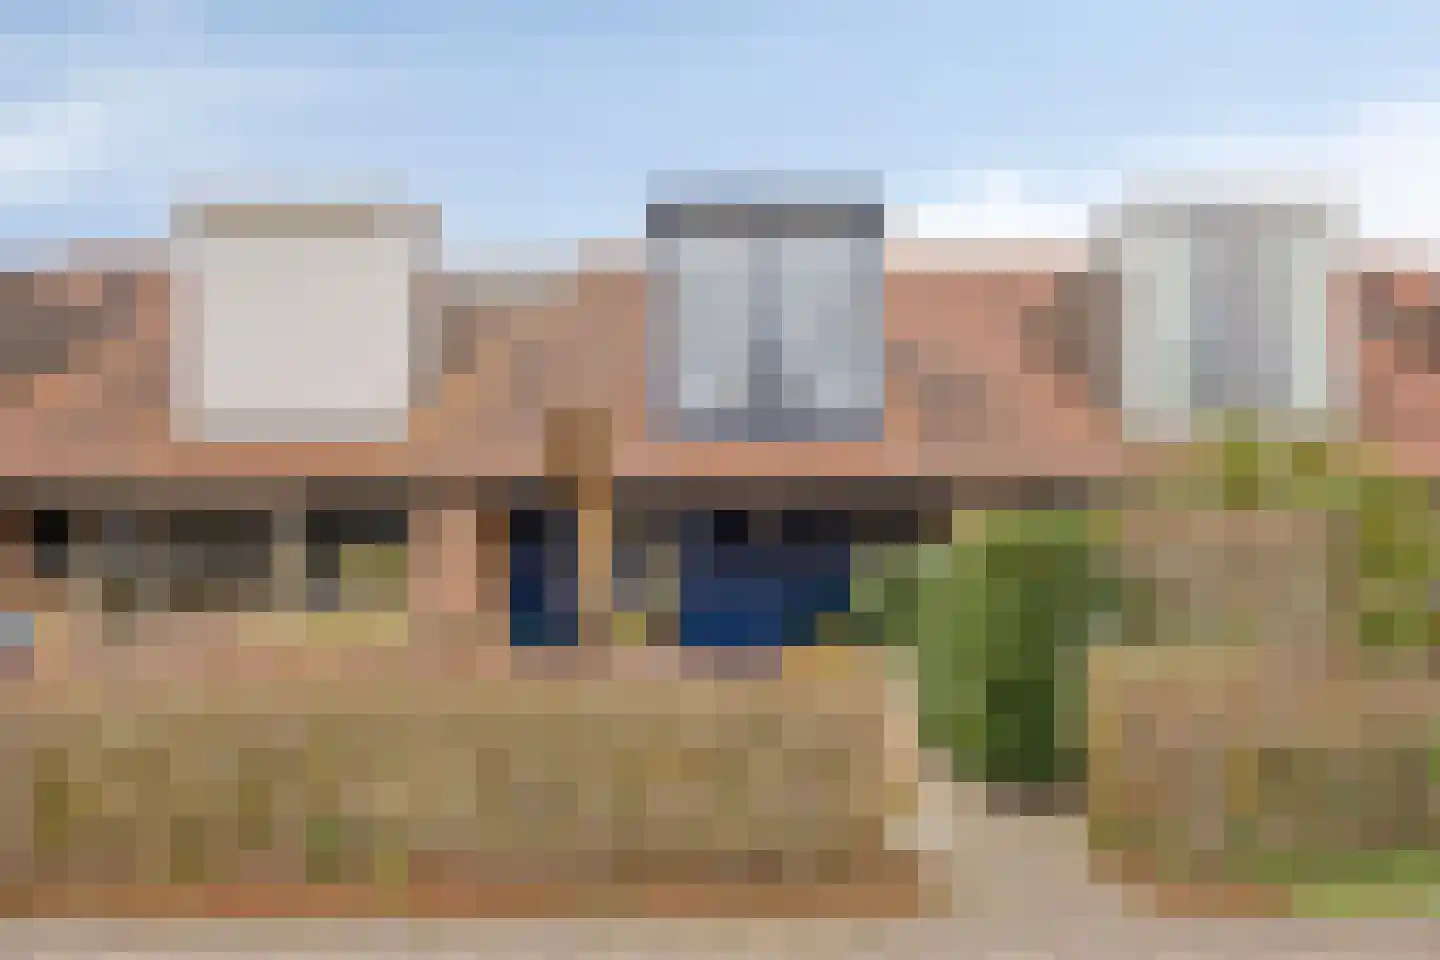
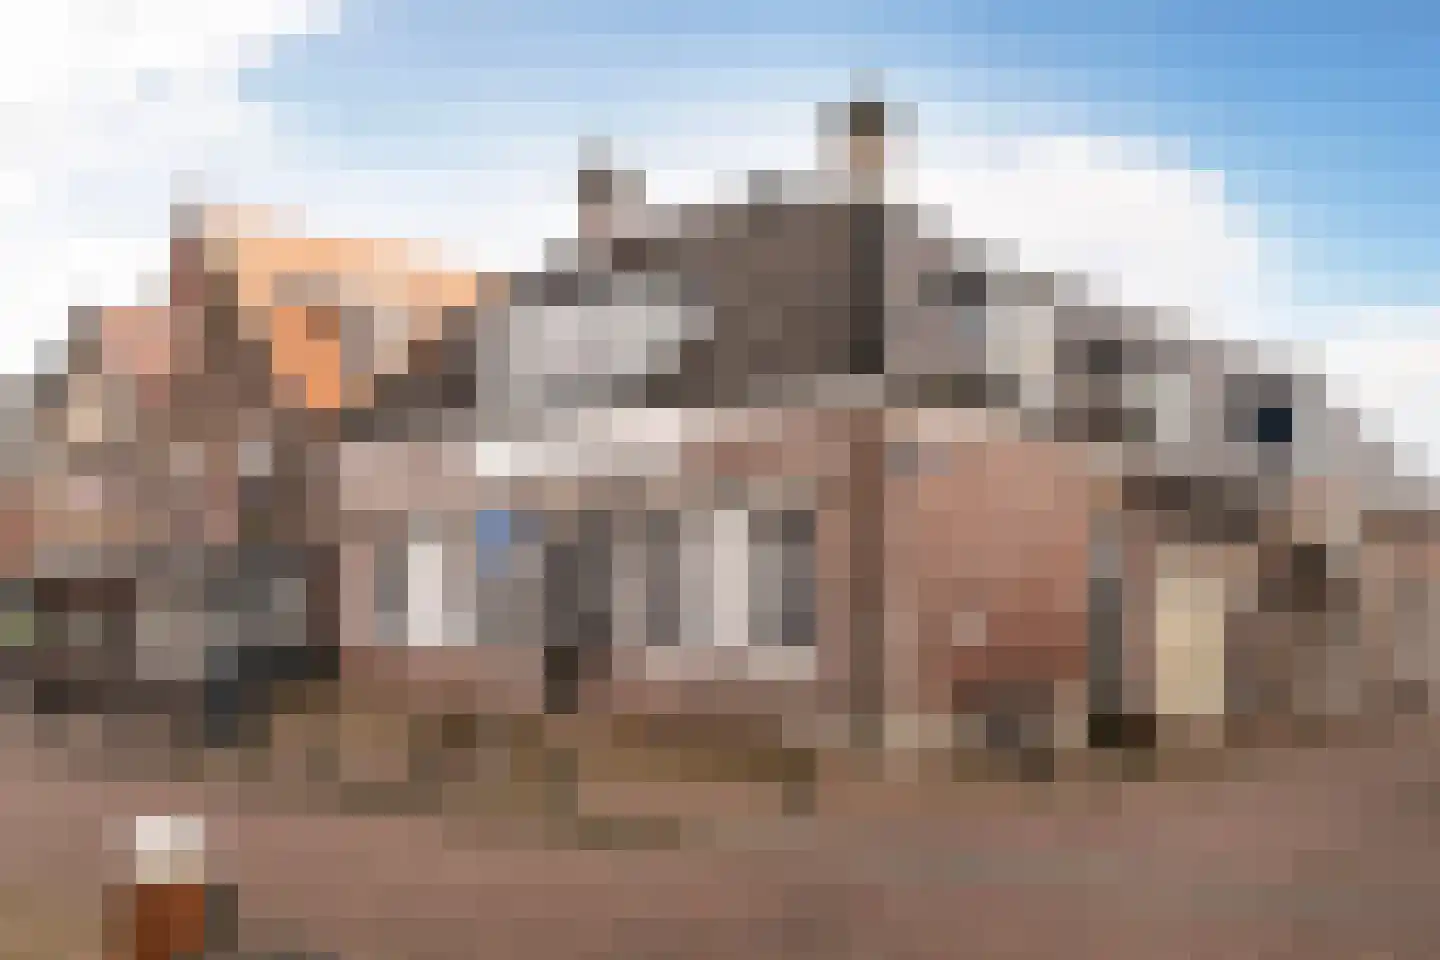
Ploegdijk 2 H 600a
7241SC Lochem
€ 139.900 k.k.
Save as favorite- Living area
- 62 m²
- Land area
- 589 m²
- Bedrooms
- 3
-

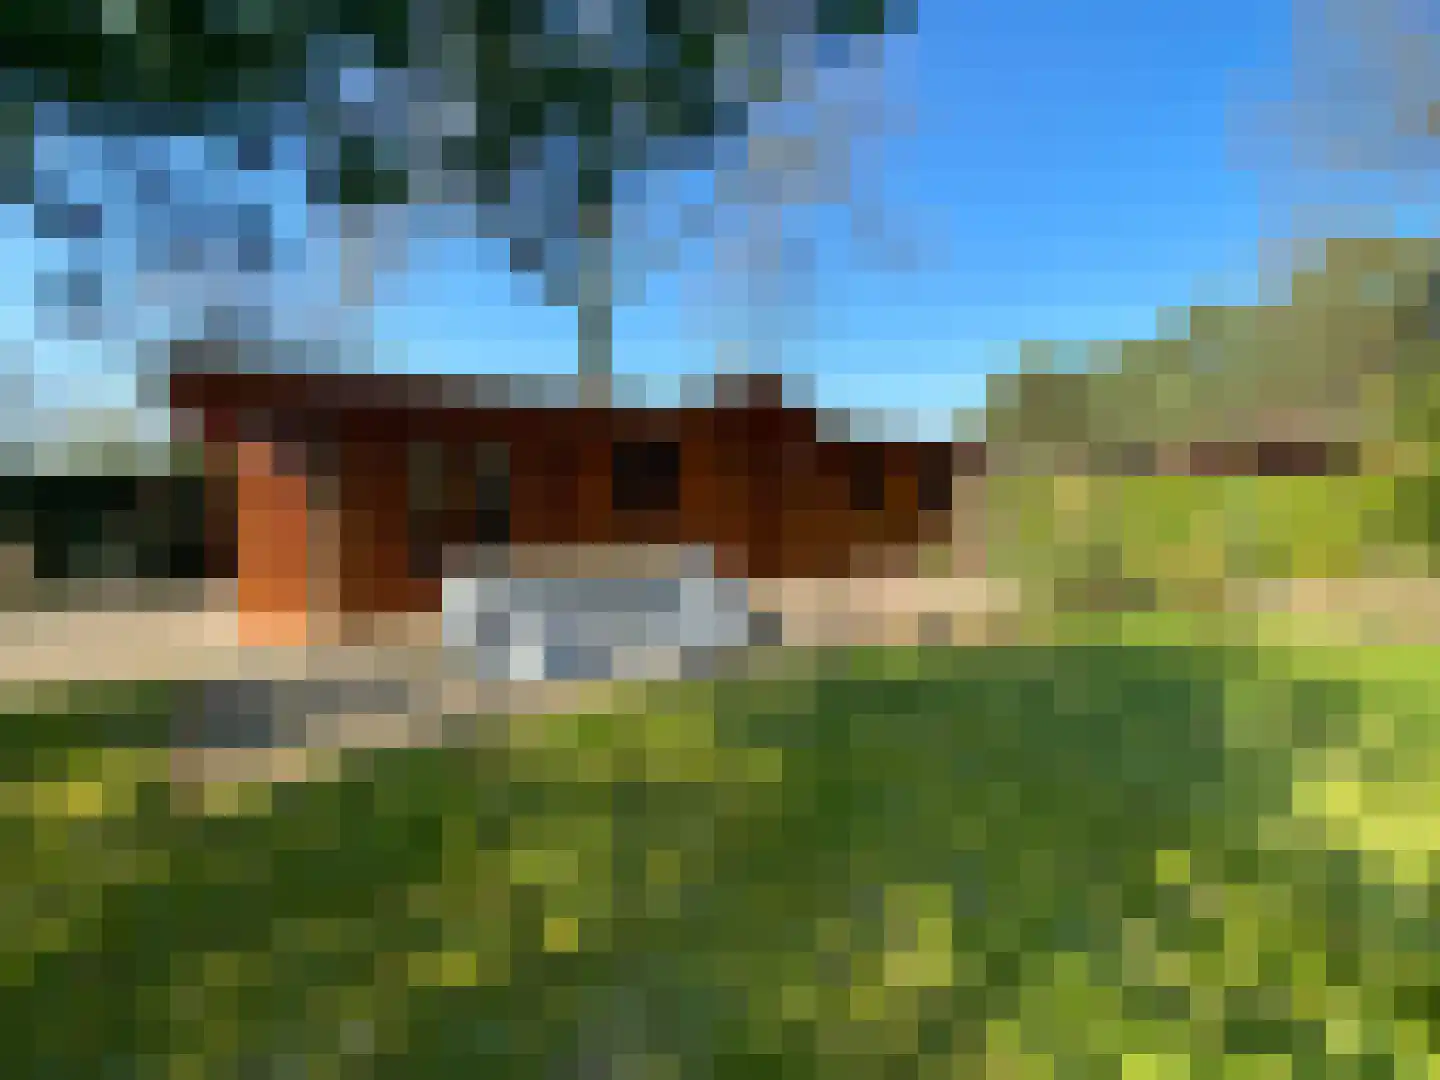
- Available
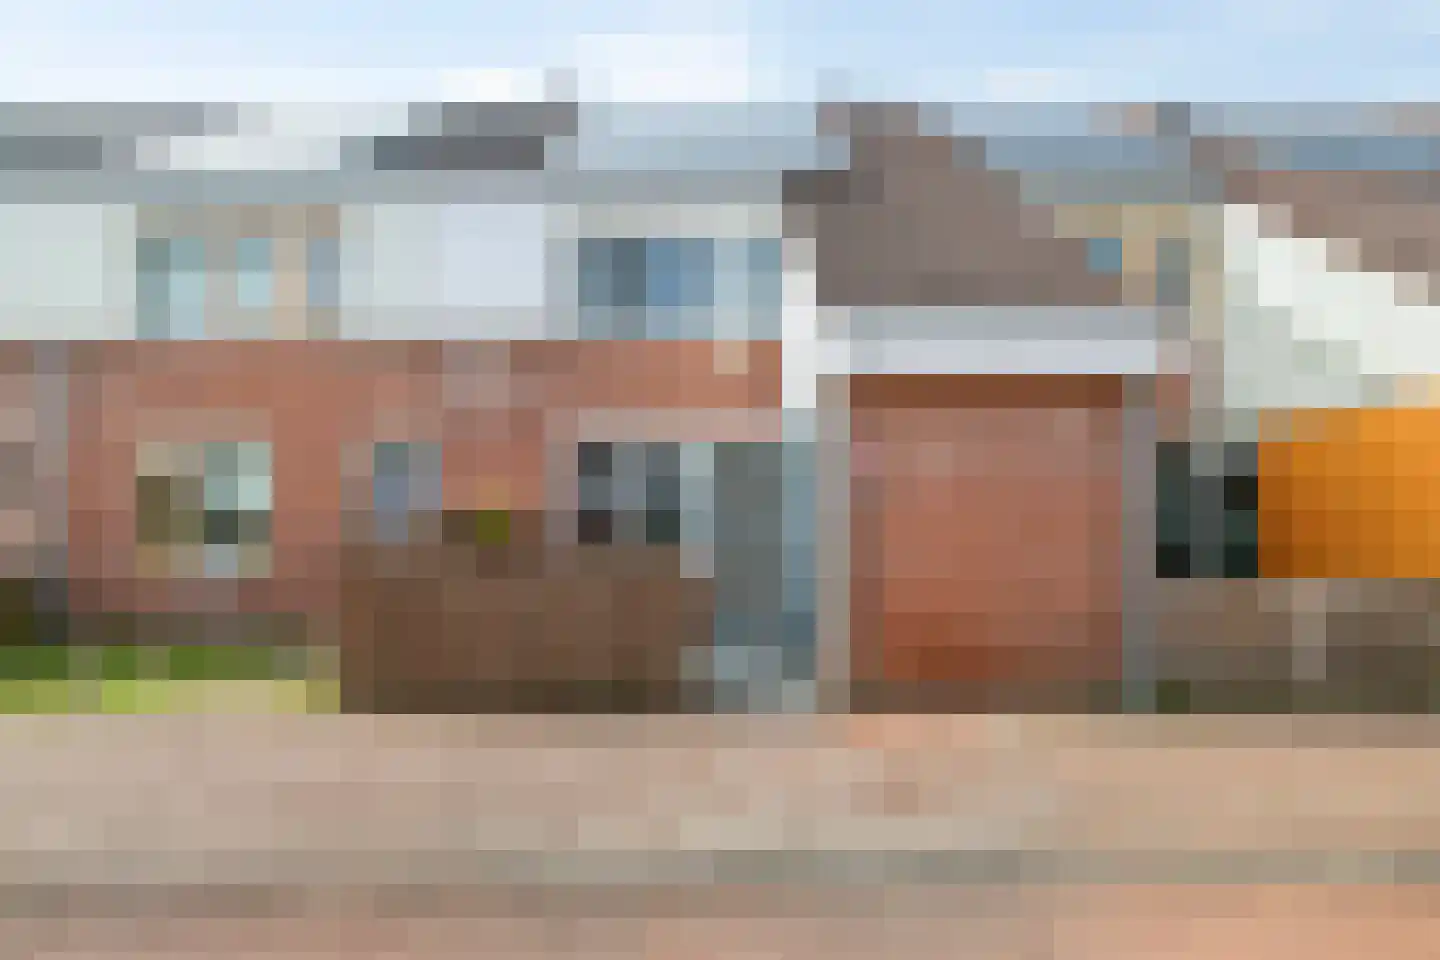
Vijverlaan 1 HV42
6731CK Otterlo
€ 299.000 k.k.
Save as favorite- Living area
- 60 m²
- Land area
- 286 m²
- Bedrooms
- 3
-
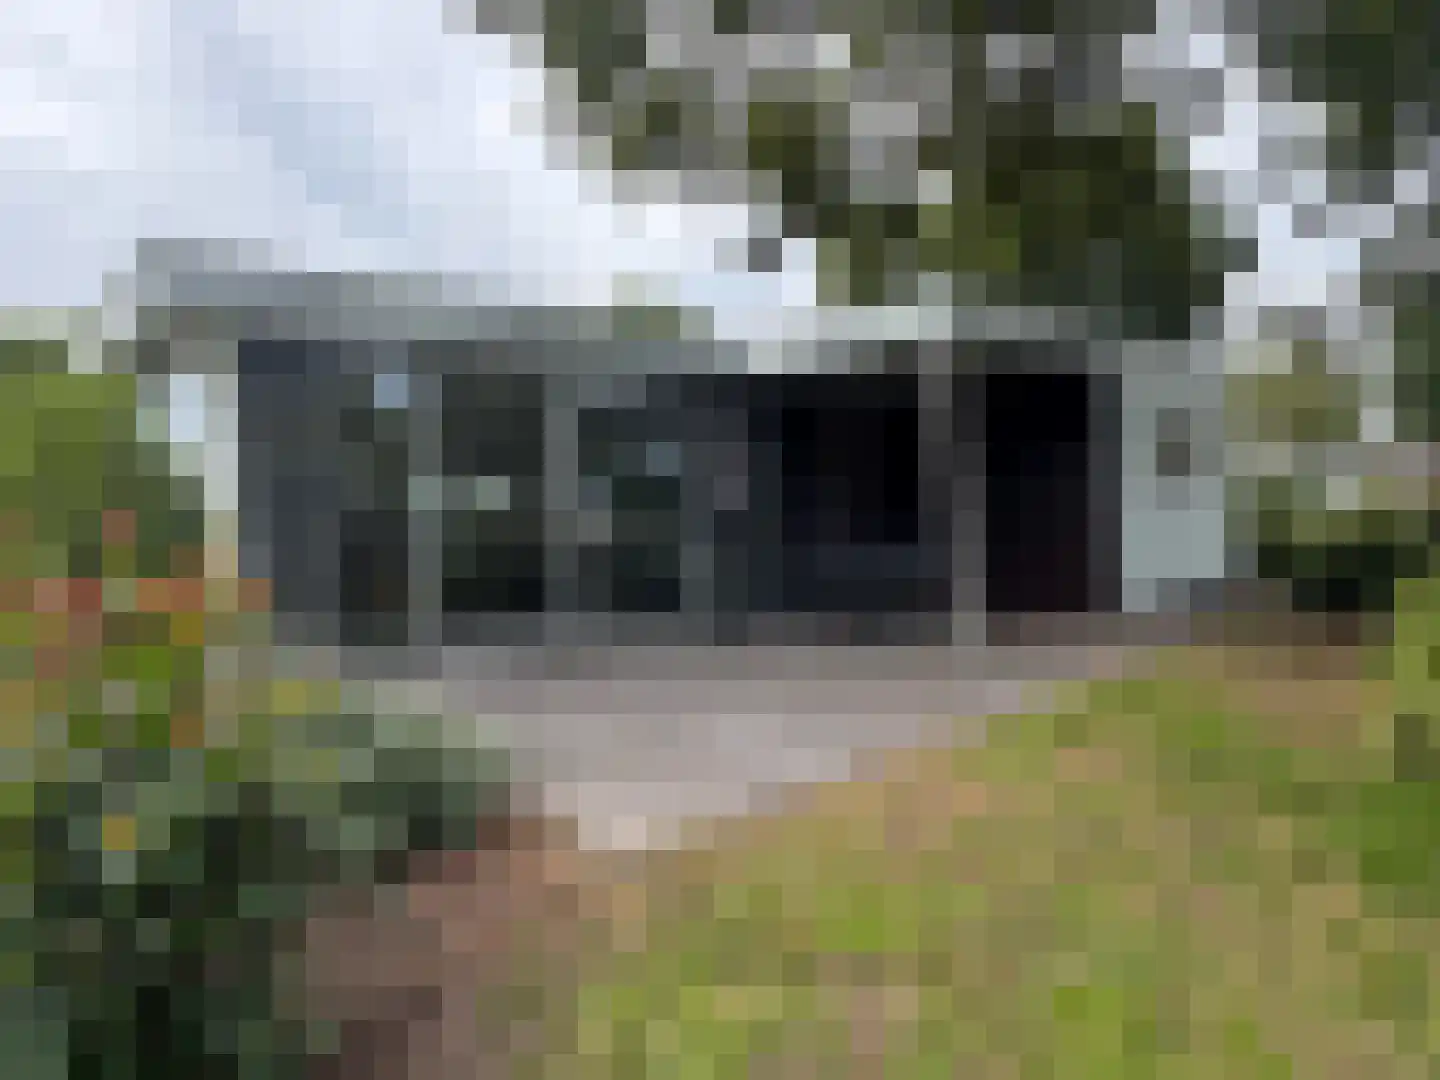
- Available
Hommelweg 2 R 103
6114RT Susteren
€ 75.000 ,-
€ 1.339/m²
CSave as favorite- Living area
- 56 m²
- Land area
- 535 m²
- Bedrooms
- 2
-
- Available
Spijkweg 15 p307
8256RJ Biddinghuizen
€ 149.500 k.k.
€ 2.768/m²
CSave as favorite- Living area
- 54 m²
- Land area
- 450 m²
- Bedrooms
- 3
Reviews (31)
Review platforms
BronscoresTotal score
31 total reviews

31 reviews on Google
-
Patrick Overberg
2Wij hebben via Jos Boterman een huisje op huurgrond aangeschaft. Vanaf het eerste moment hebben wij aangegeven de grond erbij te willen kopen en Jos gaf aan dat dit in januari weer zonder problemen zou kunnen. Dit bleek echter onjuist, de grond was niet te koop waardoor wij jaarlijks 5000,- aan huur mochten weggooien. We zijn dus zeer slecht voorgelicht! We besloten het huisje te verkopen om een huisje met grond te kopen. Nu moeten we bij Jos de hoofdprijs betalen voor de verkoop en is de service en bereikbaarheid ineens waardeloos. Geen aanrader! Kies een andere makelaar als dat kan!
-
Patrick Leuner
10Deze makelaar is een echte aanrader. We hebben de woning bezichtigd met Milan Boterman, die erg vriendelijk en zeer competent is. Nadat we een akkoord hadden bereikt met de verkoper, nam het kantoor de rest van het proces over. De samenwerking met het team was meer dan perfect; al onze vragen werden beantwoord, alle documenten werden ter inzage verstrekt en de reacties waren altijd zeer snel. Het hele proces verliep vlekkeloos. Hoewel ik Nederlands spreek, werd het hele consult, zoals gebruikelijk, in perfect Duits gevoerd; ze waren erg behulpzaam. Ik zou graag weer van hun diensten gebruikmaken!
-
Milan
10 -
Lucienne Van Der Hulst
10Ik ben erg tevreden over bjorn die mij geholpen heeft bij de aankoop van een chalet.
-
B S
4Geen fijne ervaring. Uiteindelijk hebben ze het chalet wel verkocht maar de communicatie was matig tot slecht en als je weet hoeveel provisie deze mensen vragen, en vervolgens zeer passief verkopen vind ik het geen succes.
-
Marleen B
10Translated by AITop realtor! Fast, friendly and open communication. Our holiday home was sold very quickly! Super!
-
Leon | JANS'
10Een erg prettig bedrijf om zaken mee te doen. Professionele makelaars en backoffice die kennis hebben van de markt en het aanbod.
-
Elise de Jong
10Super geholpen en snelle, professionele aanpak. Bedankt Bjorn!
-
Michaela Eschenbach
10Ons chalet is snel en eerlijk verkocht. Hartelijk dank in het bijzonder aan Milan en Elise. Ze waren allebei betrouwbaar, altijd bereikbaar en hebben al onze vragen geduldig beantwoord.
-
Michiel Haans
10Gisteren was de sleuteloverdracht van onze accommodatie op Badhoophuizen ZZ30 een feit. Het totale verkoopproces was tot in de puntjes proffesioneel geregeld, met relevante deskundige adviezen. Ook voor een stukje nazorg kun je een beroep doen op uw Tweedehuismakelaar. Dank voor de fijne laagdrempelige contacten.
-
albert rikkers
10Wij hebben in 2019 via Jos Boterman een Cub la Mer aangekocht op De Zanding in Otterlo. De overdracht en begeleiding is op een zeer prettige en deskundige verlopen. In 2024 hebben wij door omstandigheden het geliefde huisje moeten verkopen. Natuurlijk hebben wij dat weer in handen gegeven van Uwtweedehuismakelaar, nu kregen wij te maken met de zoon van Jos. Ook deze overdracht is weer prima en prettig begeleid. Wij zullen dan ook zeker de mensen die een vakantiehuis zoeken in binnen-en buitenland dit gespecialiseerde makelaarskantoor aanbevelen. Albert en Ineke Rikkers
-
gerard streef
10uw tweedehuis makelaar Binnen enkele maanden ons recreatiewoning verkocht nadat bij een ander 2 jaar tekoop heeft gestaan goed geholpen bij afhandeling verkoop
-
Joern Kocken
2De slechtste klantenservice die ik ooit van een makelaar heb meegemaakt. Nooit meer!
-
Gregi T.
10Een betrouwbare partner voor de aankoop van een vakantieappartement in Nederland. Ondanks de verschillende talen verliep de communicatie vlekkeloos. Ook na het tekenen van het contract bleven ze bereikbaar.
-
Britt Oonk
10 -
Peytra
10via tweedehuismakelaar een stacaravan aangeschaft. heel tevreden over de service, vriendelijkheid en kwaliteit!
-
Nathalia Sluijter
2Deze makelaar is niet aan te raden! Veel fouten in de omschrijving van ons chalet, die niet werden hersteld! B.v. huurgrond moest koopgrond zijn. Verkeerde locatie van het chalet. Niets willen toevoegen van ons aan de tekst. Ons niet op de hoogte houden. Wij hadden een 1 jarig contract, waarvan wij 2 maanden eerder zijn gestopt! En ook nog eens €600,00 kwijt aan "bemiddelingskosten"! Schandalig!!!
-
Sylvain Liebau
2Ik moet helaas ook constateren dat van actief makelen geen sprake is. Nadat woning maanden geleden in verkoop is gegeven en eerste bemiddelingskosten waren overgemaakt is het erg stil. Wel nog keer brief gehad om o.a. de woning maar uit verhuur te halen en prijs te verlagen, hetgeen uiteraard )gelukkig niet gedaan is. Ook een openhuis gehad en geen terugkoppeling van makelaar gehad. Al met al zijn er met name in de communicatie nog meters te maken.
-
Ip Ty
10We zijn erg goed geholpen door Bjorn en Elise bij de aankoop van een chalet. Er werd snel geantwoord op al onze vragen. Het contact was erg prettig.
-
Erik Timmers
10Erg fijn geholpen bij de verkoop van mijn Recreatie woning. Nadat het park lastig deed over de verkoop, hebben ze mij erg goed geholpen tot een verkoop. Ik ben zeer tevreden en zou iedereen deze makelaar aan kunnen raden.