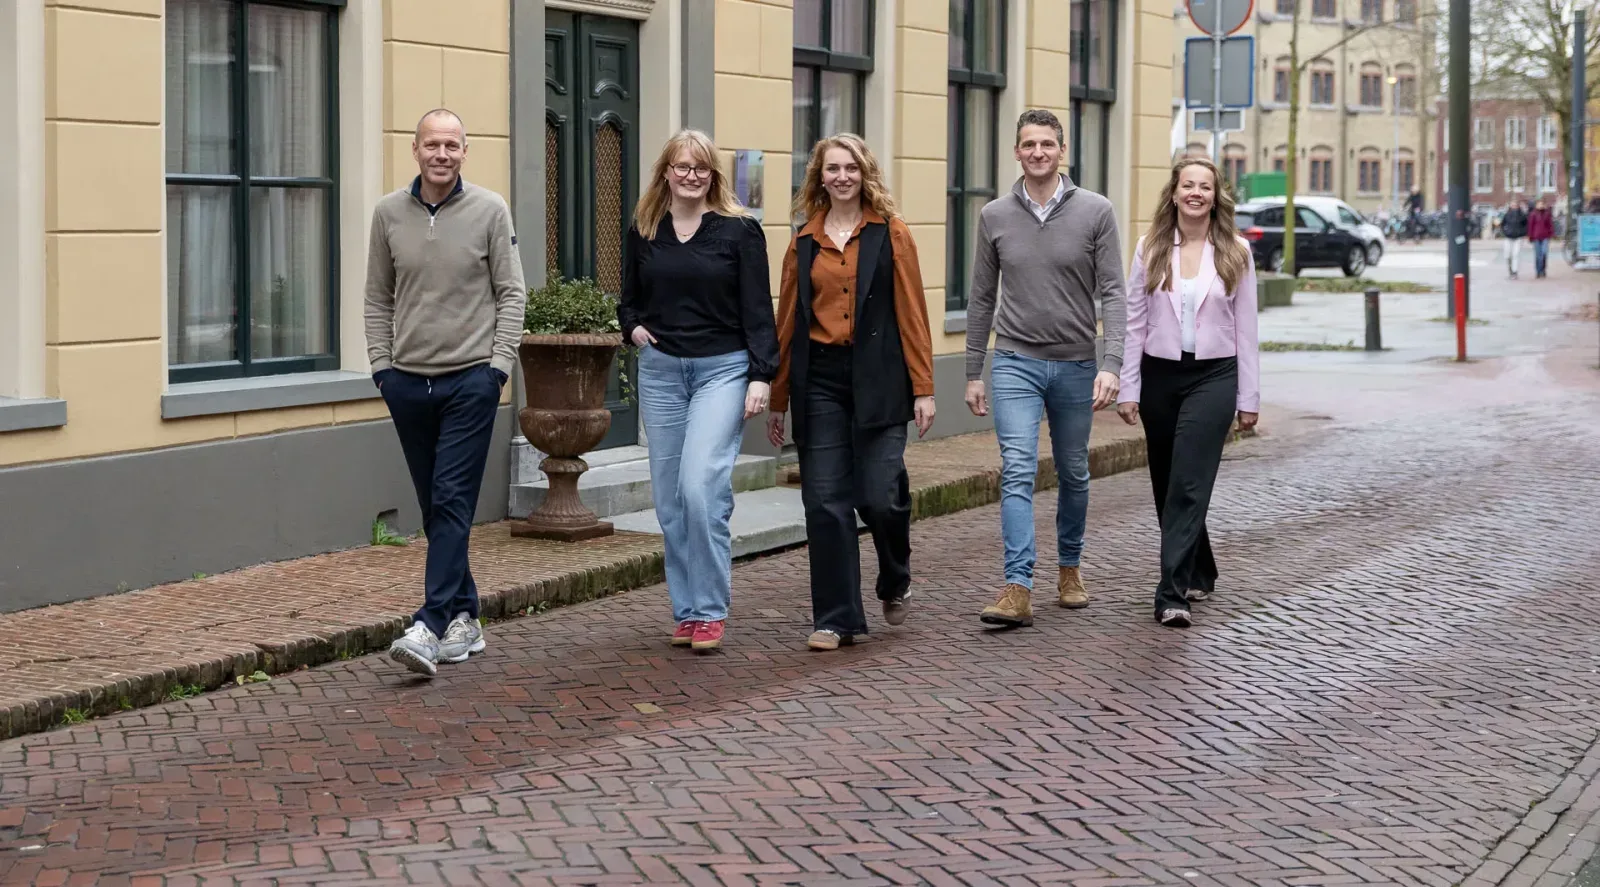
Bij Faber Makelaardij in Leeuwarden staan we voor je klaar bij het kopen of verkopen van een woning. Wij begrijpen dat dit een belangrijke keuze is en zorgen ervoor dat je op de juiste manier wordt begeleid. Onze medewerkers zijn er om je te helpen met alle stappen van het proces, zodat jij onbezorgd kunt kiezen voor een nieuw of bestaand huis. Met expertise in verkoop, aankoop, financieel advies en taxaties bieden we een breed aanbod d...
Current housing stock
-
- Available
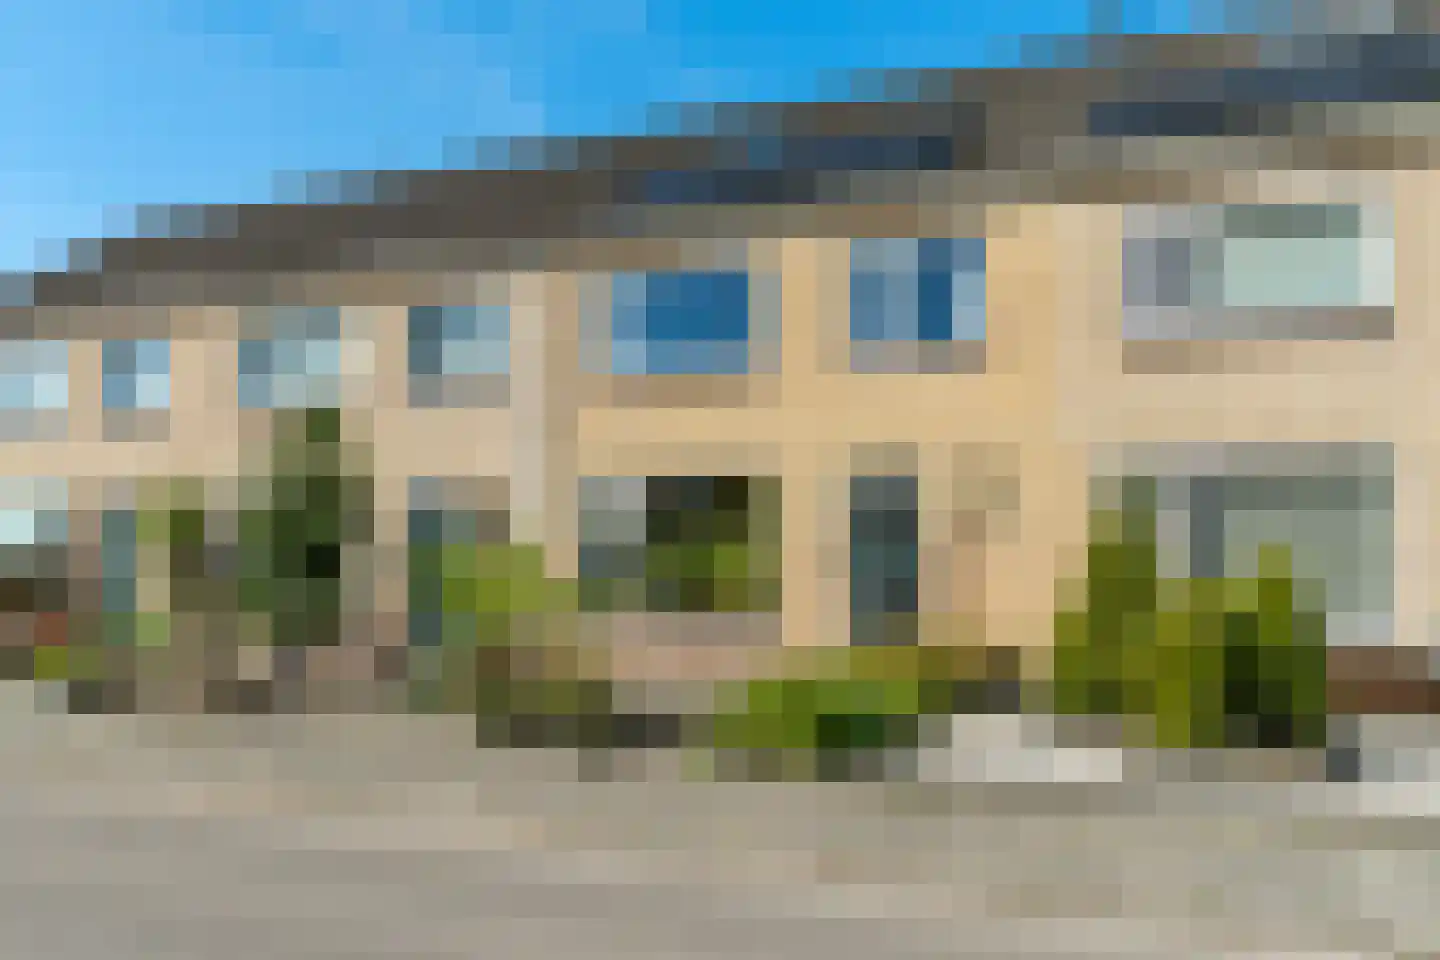
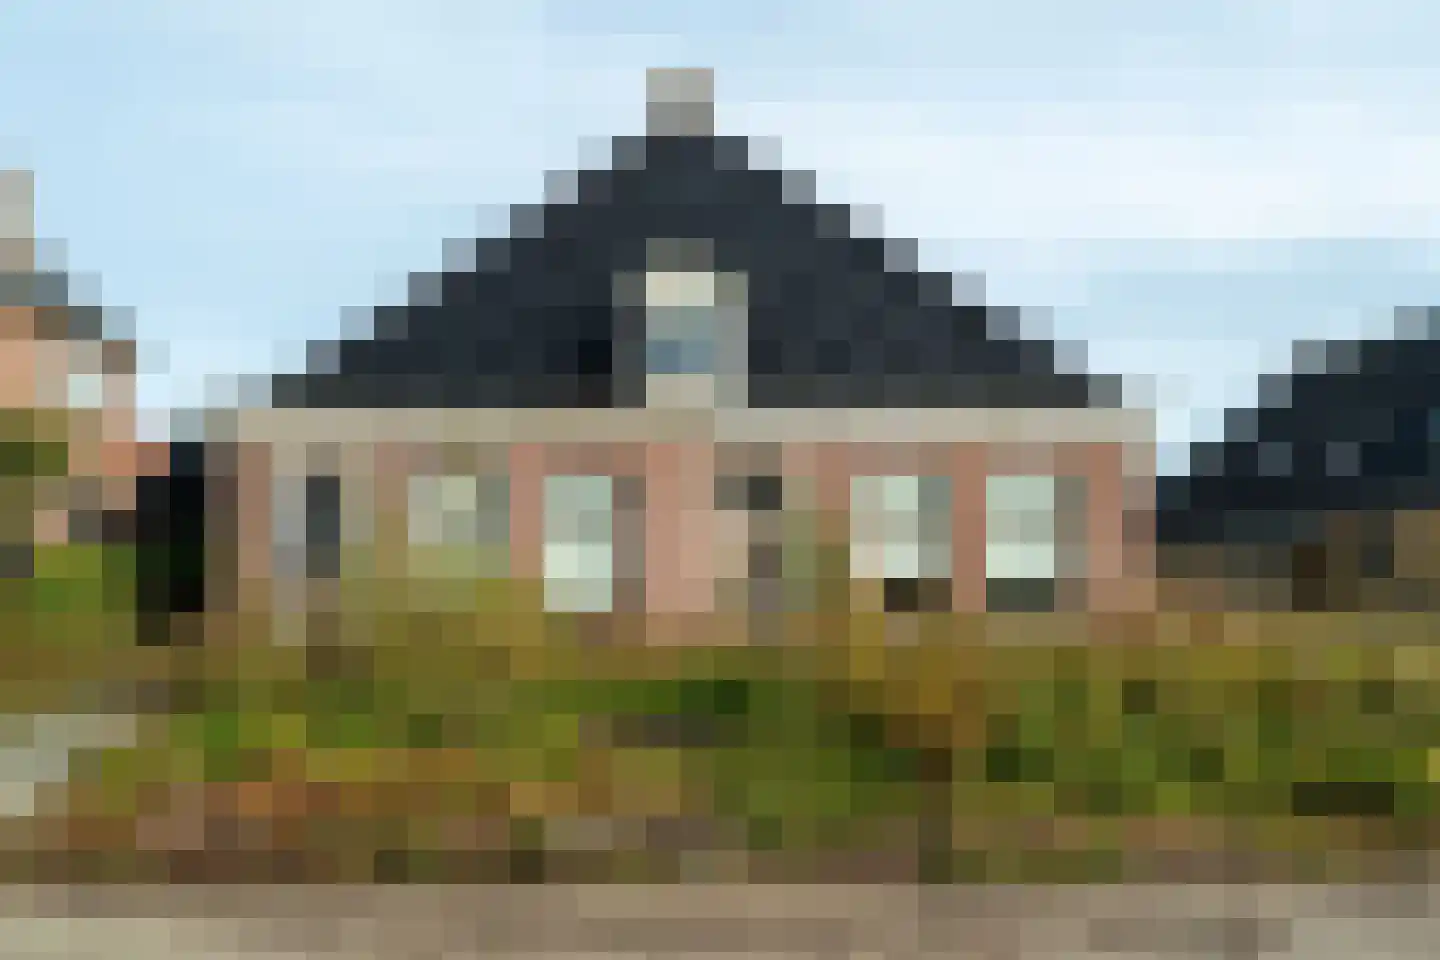
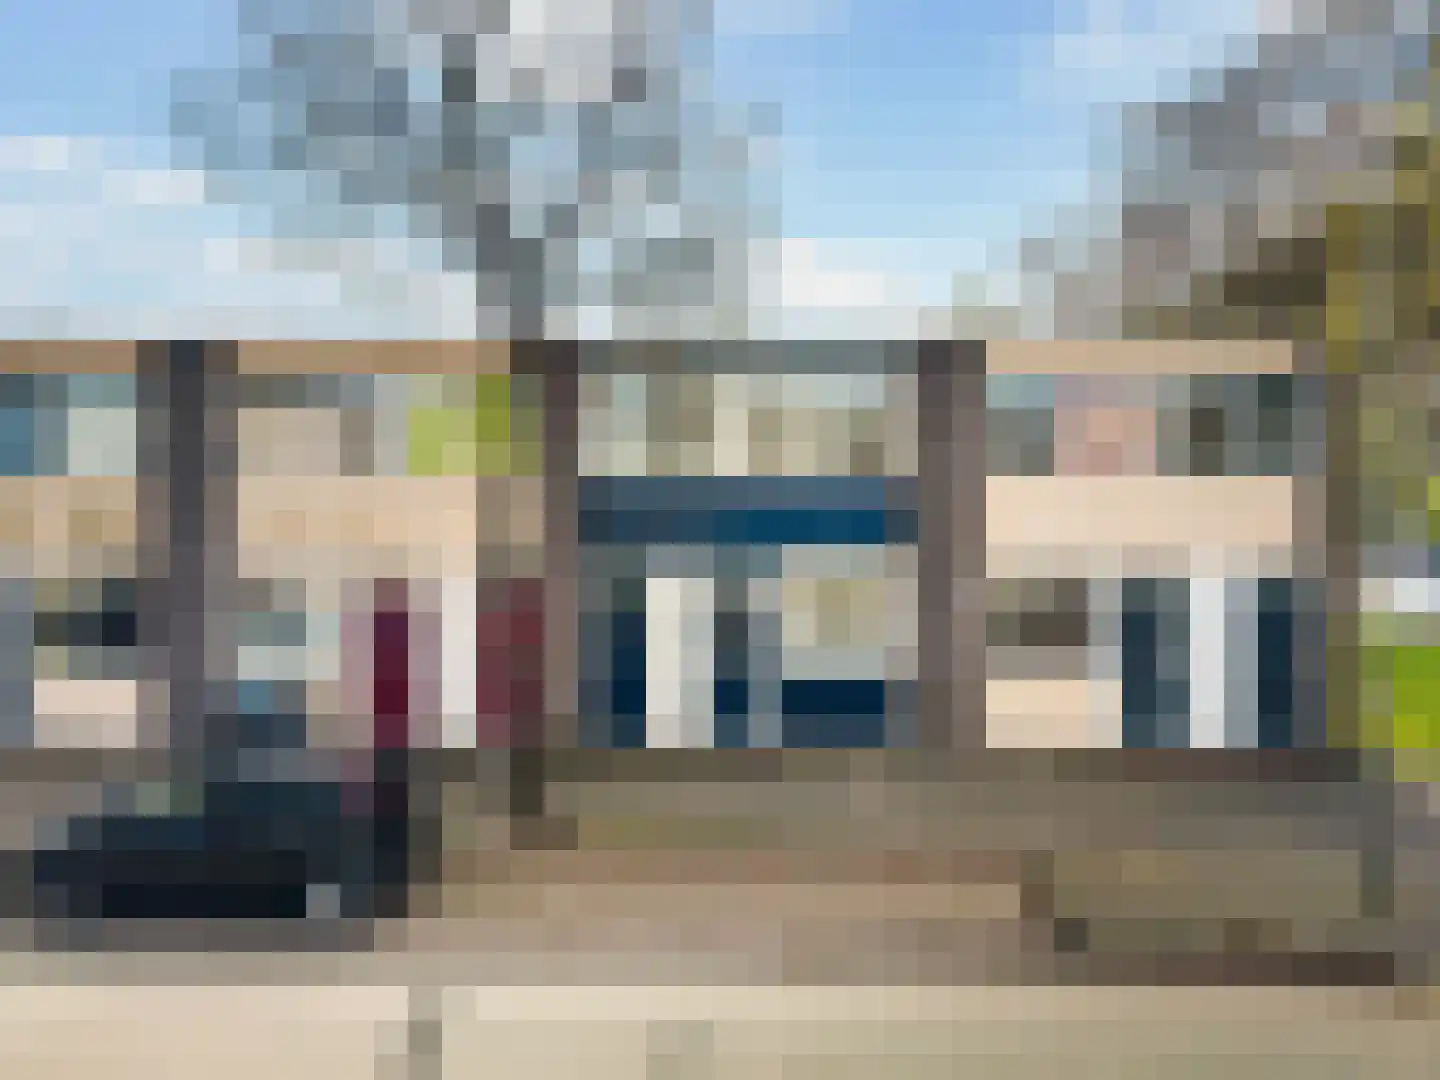
Groningerstraatweg 361 a 5
8923EJ Leeuwarden
€ 295.000 k.k.
A++Save as favorite- Living area
- 51 m²
- Land area
- —
- Bedrooms
- 1
-
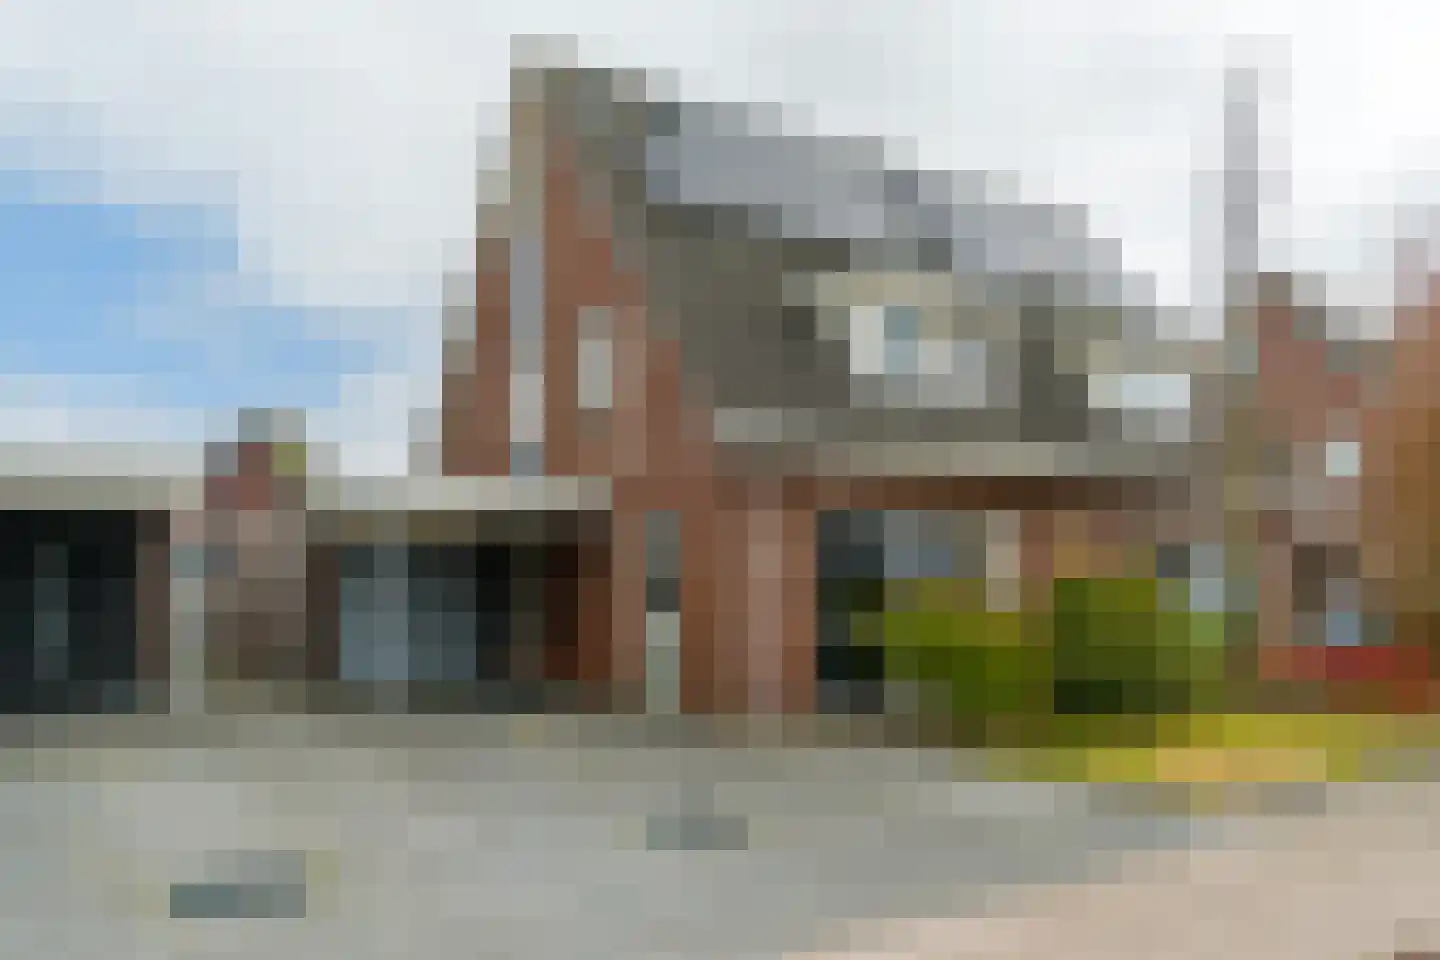
- Available
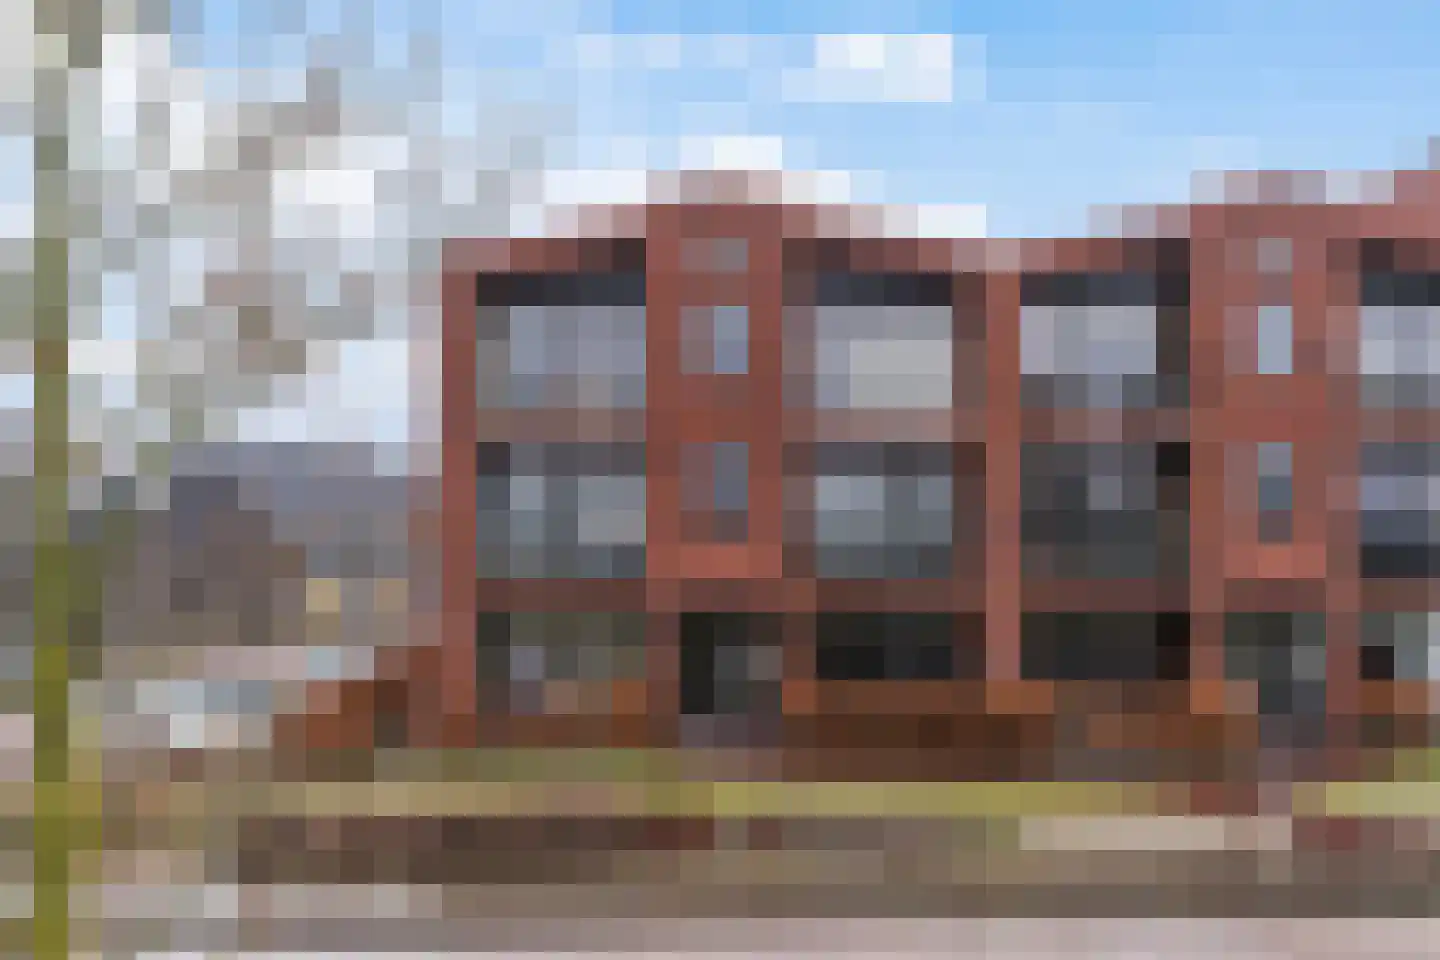
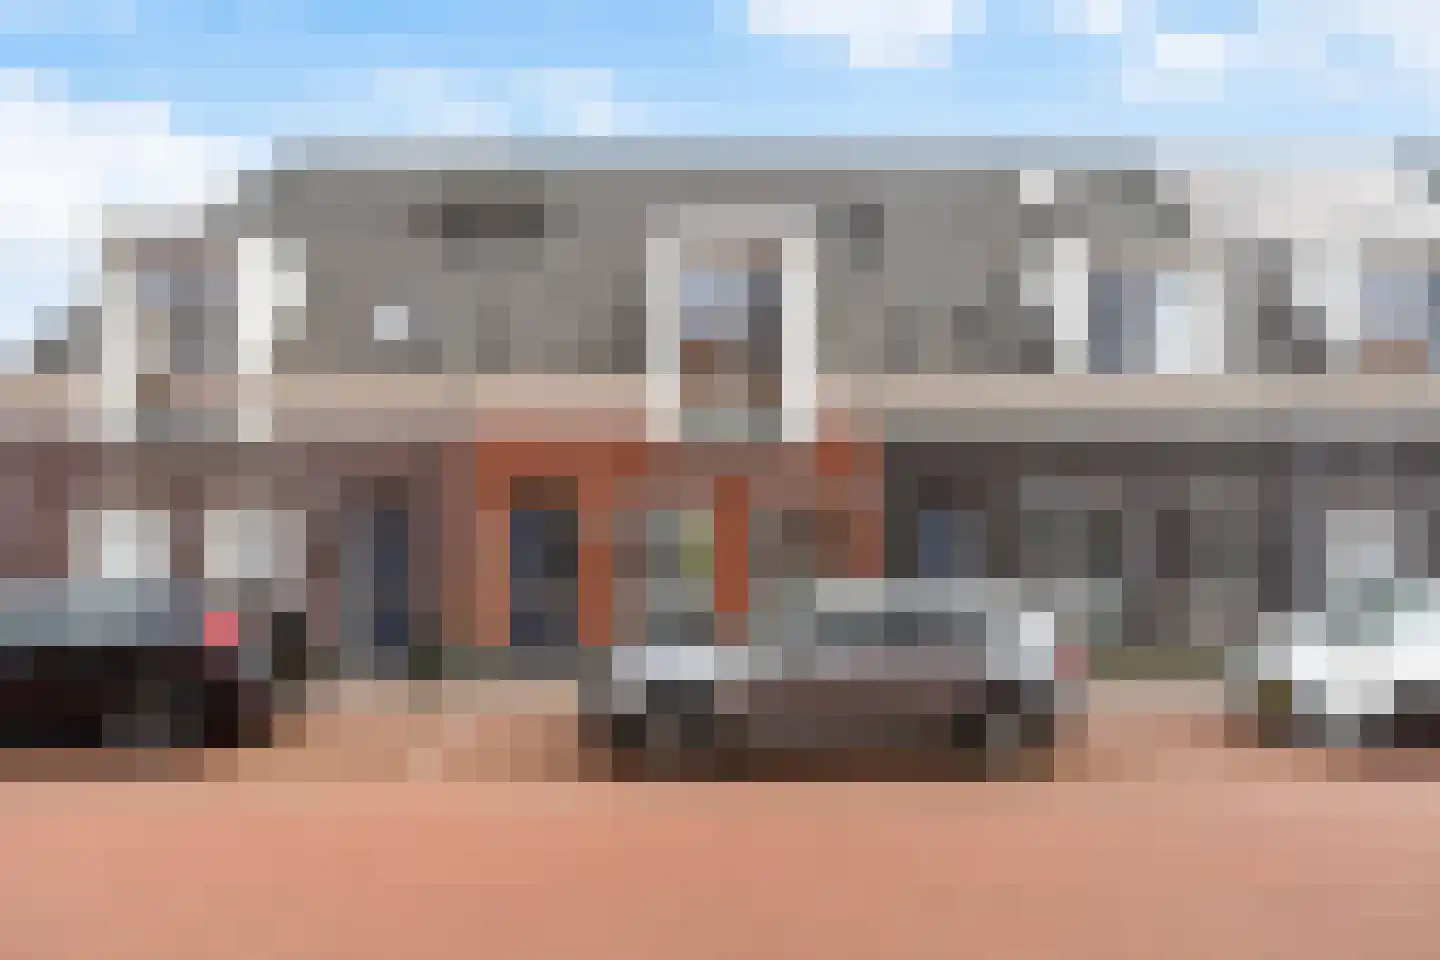
Liauckamastate 24
8926NL Leeuwarden
€ 298.000 k.k.
€ 2.525/m²
BSave as favorite- Living area
- 118 m²
- Land area
- 124 m²
- Bedrooms
- 5
-
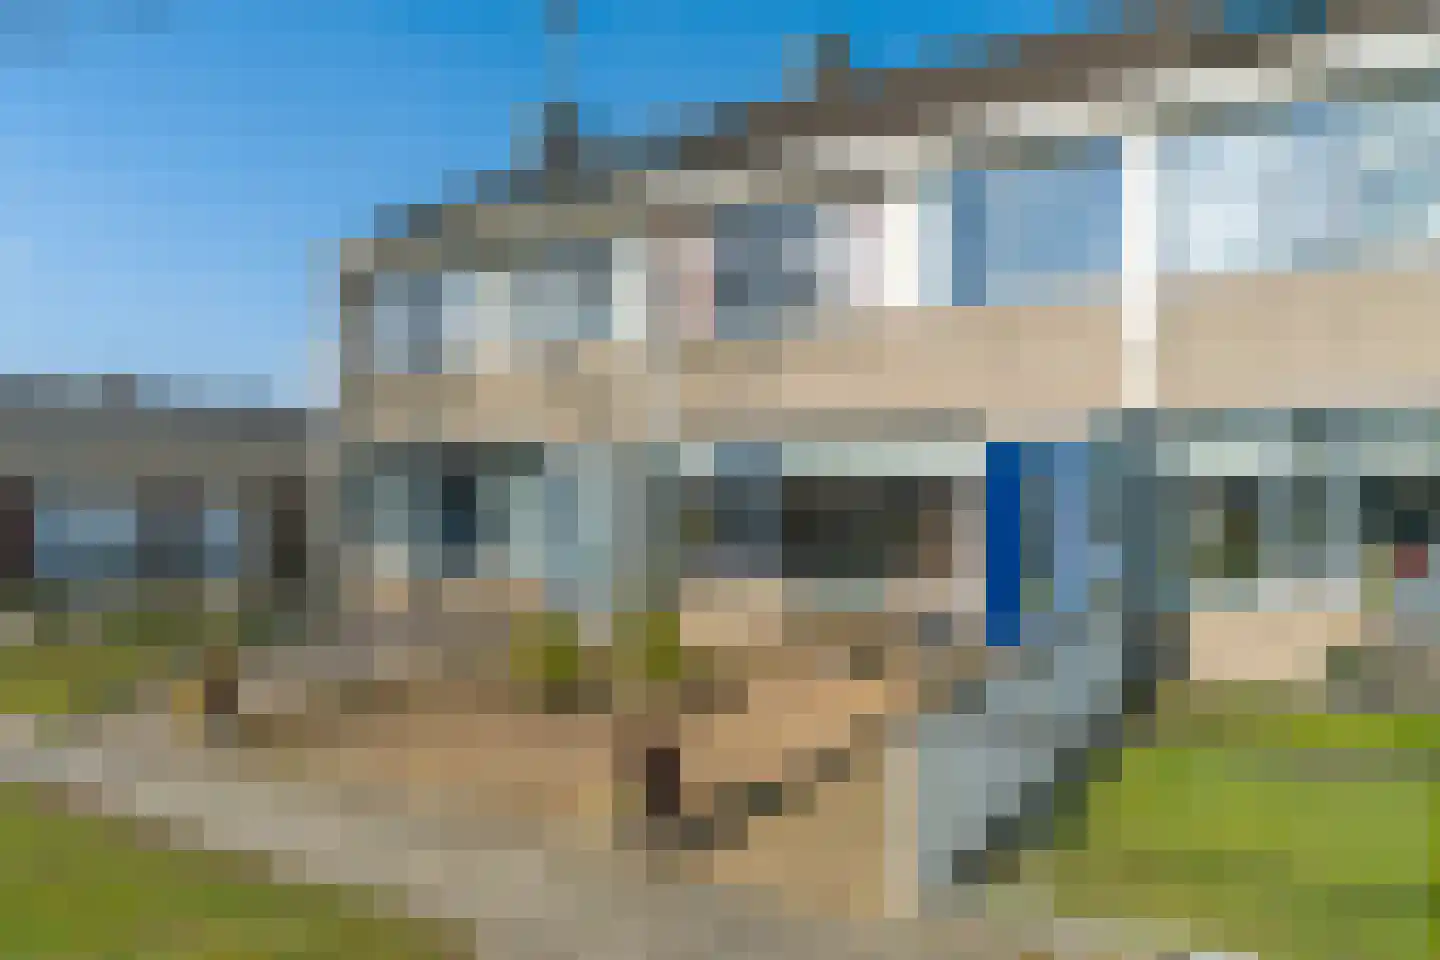
- Available
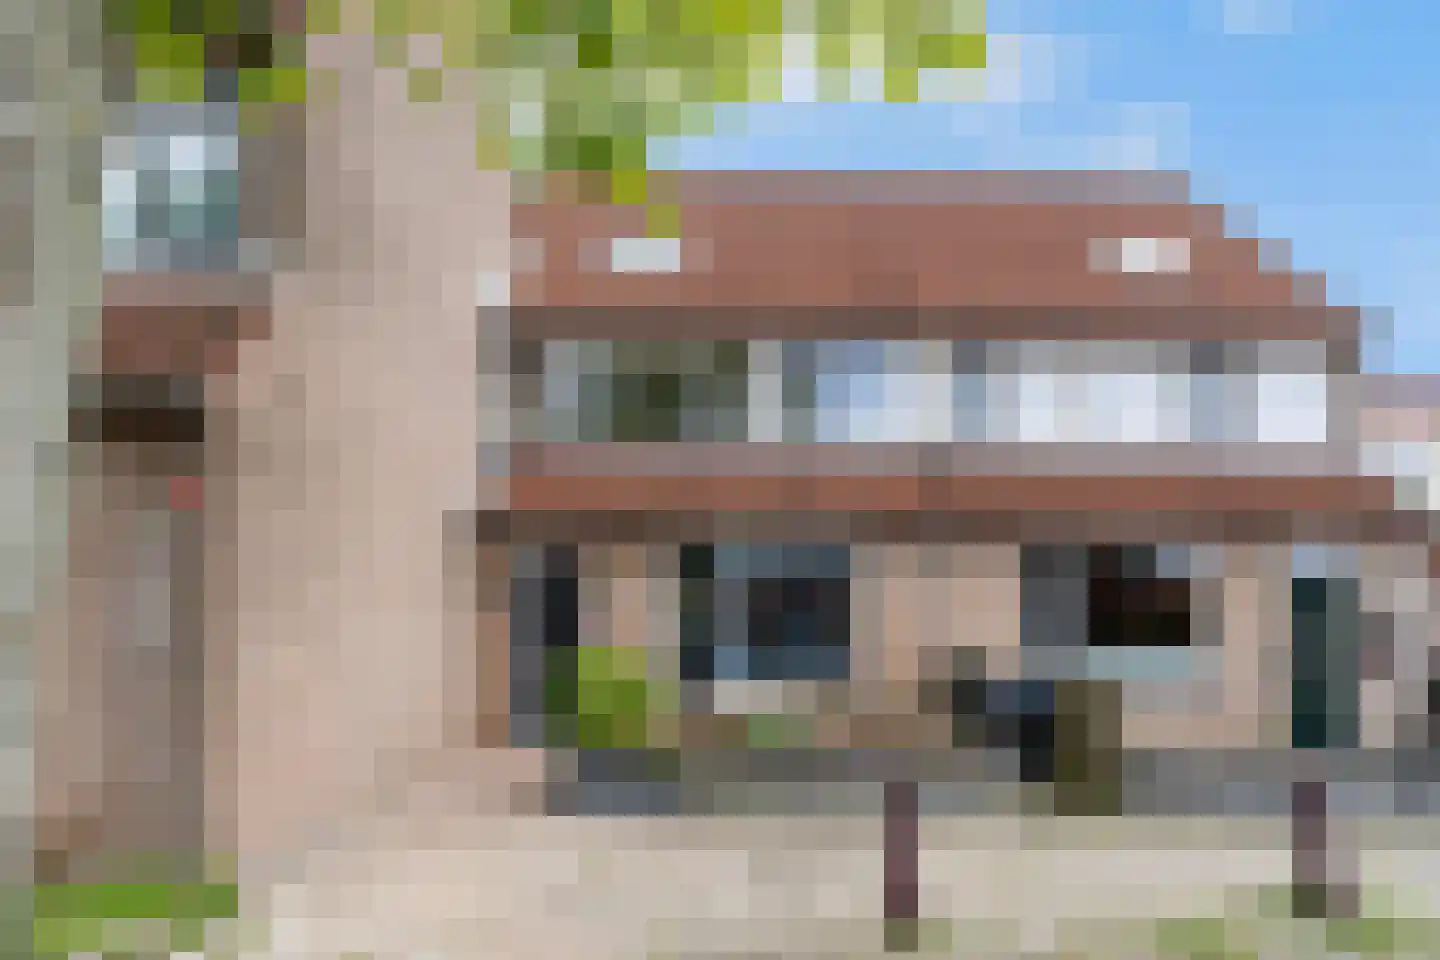
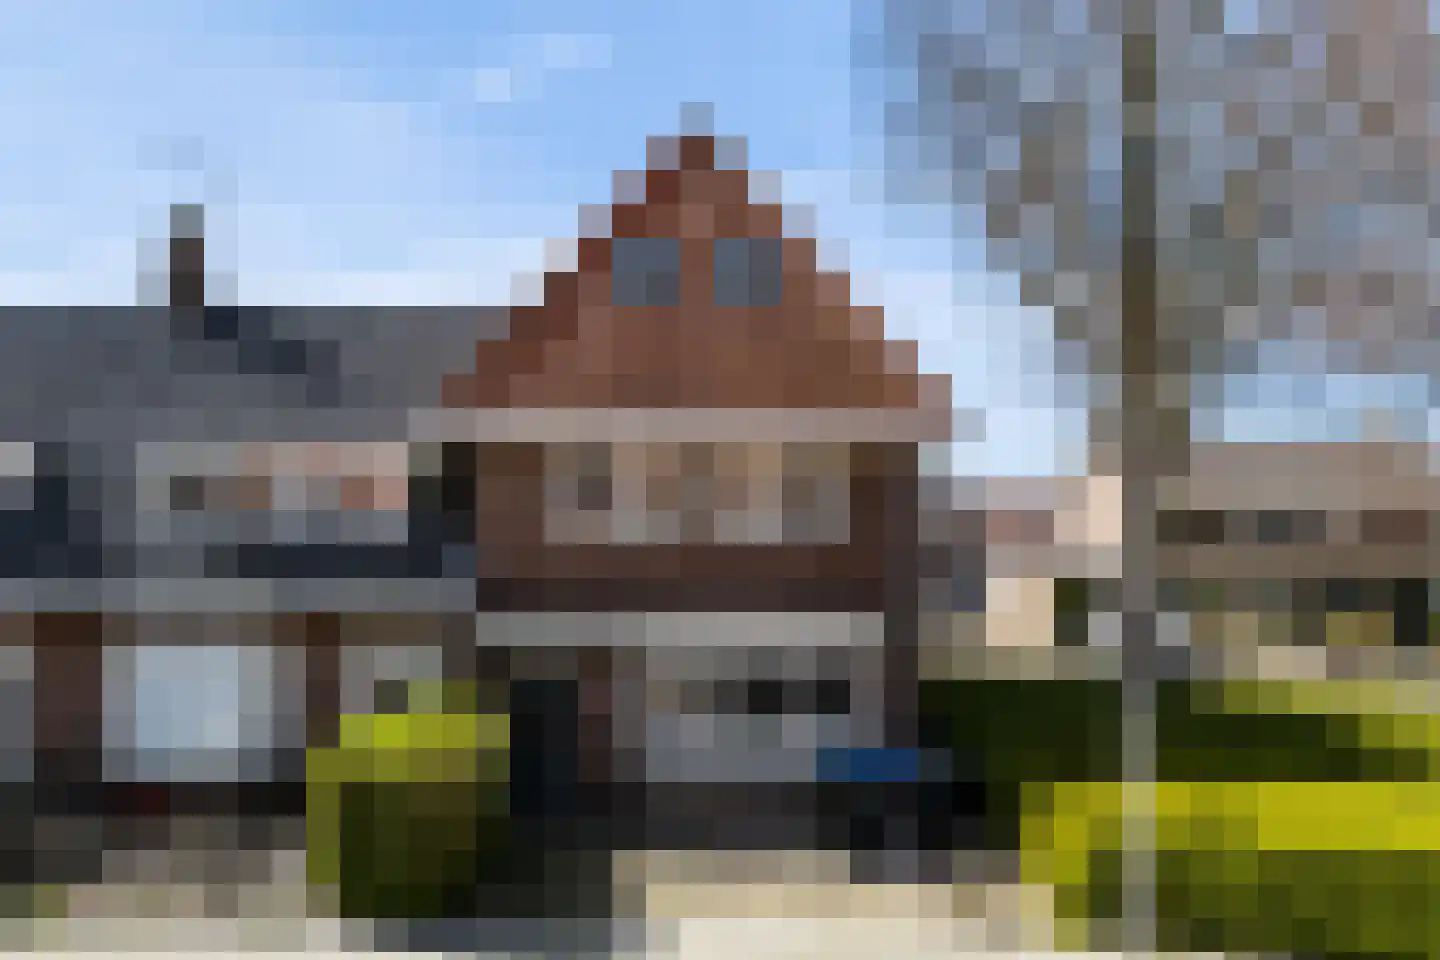
Jozef Israëlsstraat 9
8932HT Leeuwarden
€ 170.000 k.k.
€ 2.297/m²
FSave as favorite- Living area
- 74 m²
- Land area
- 102 m²
- Bedrooms
- 3
-
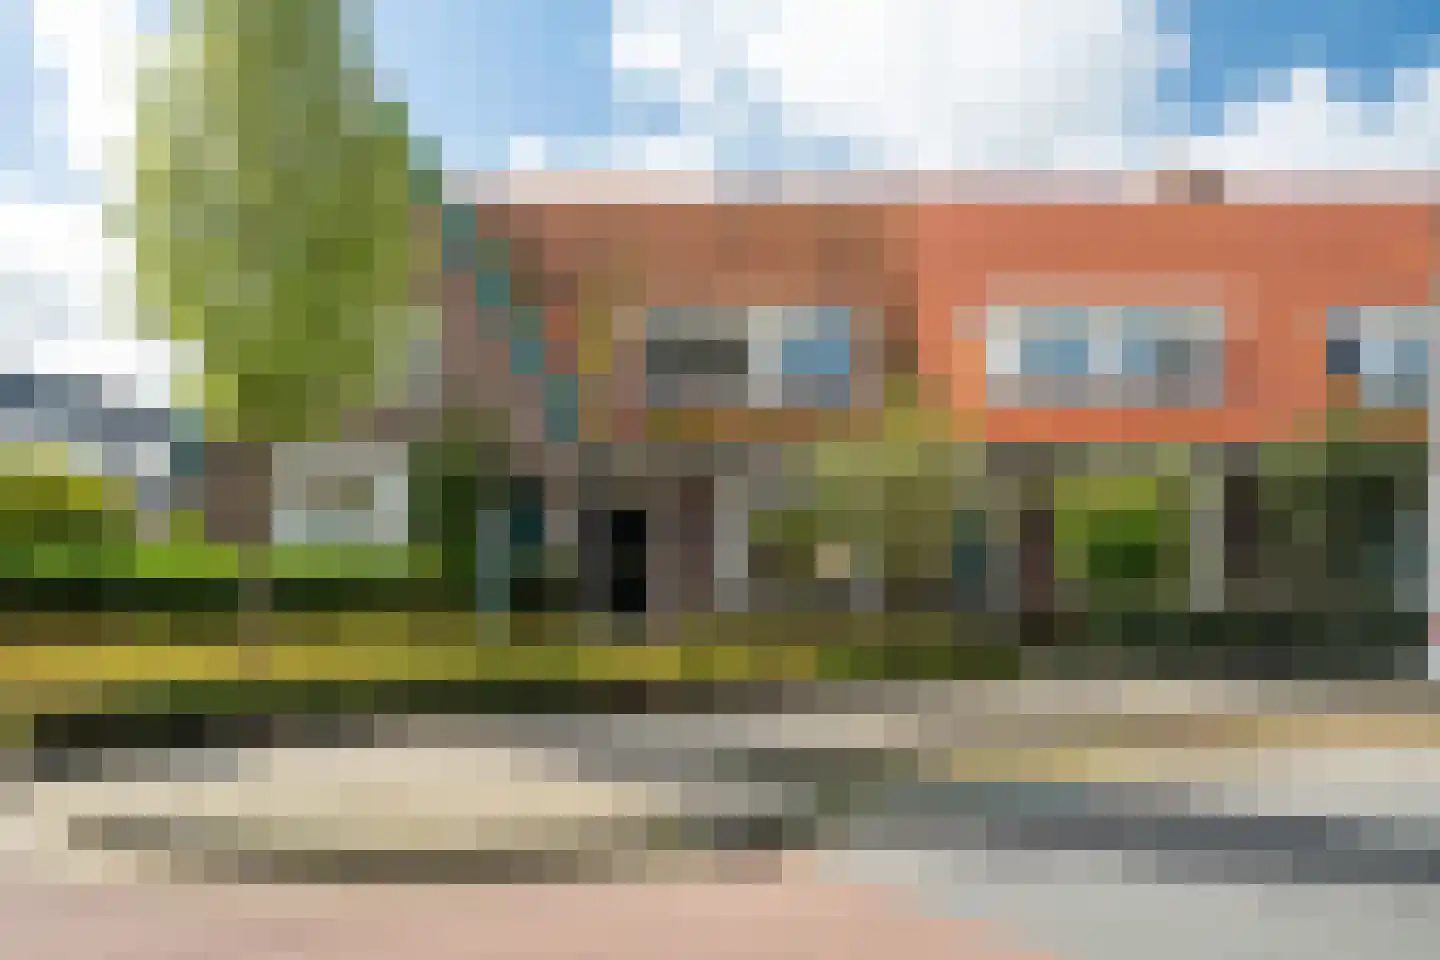
- Available
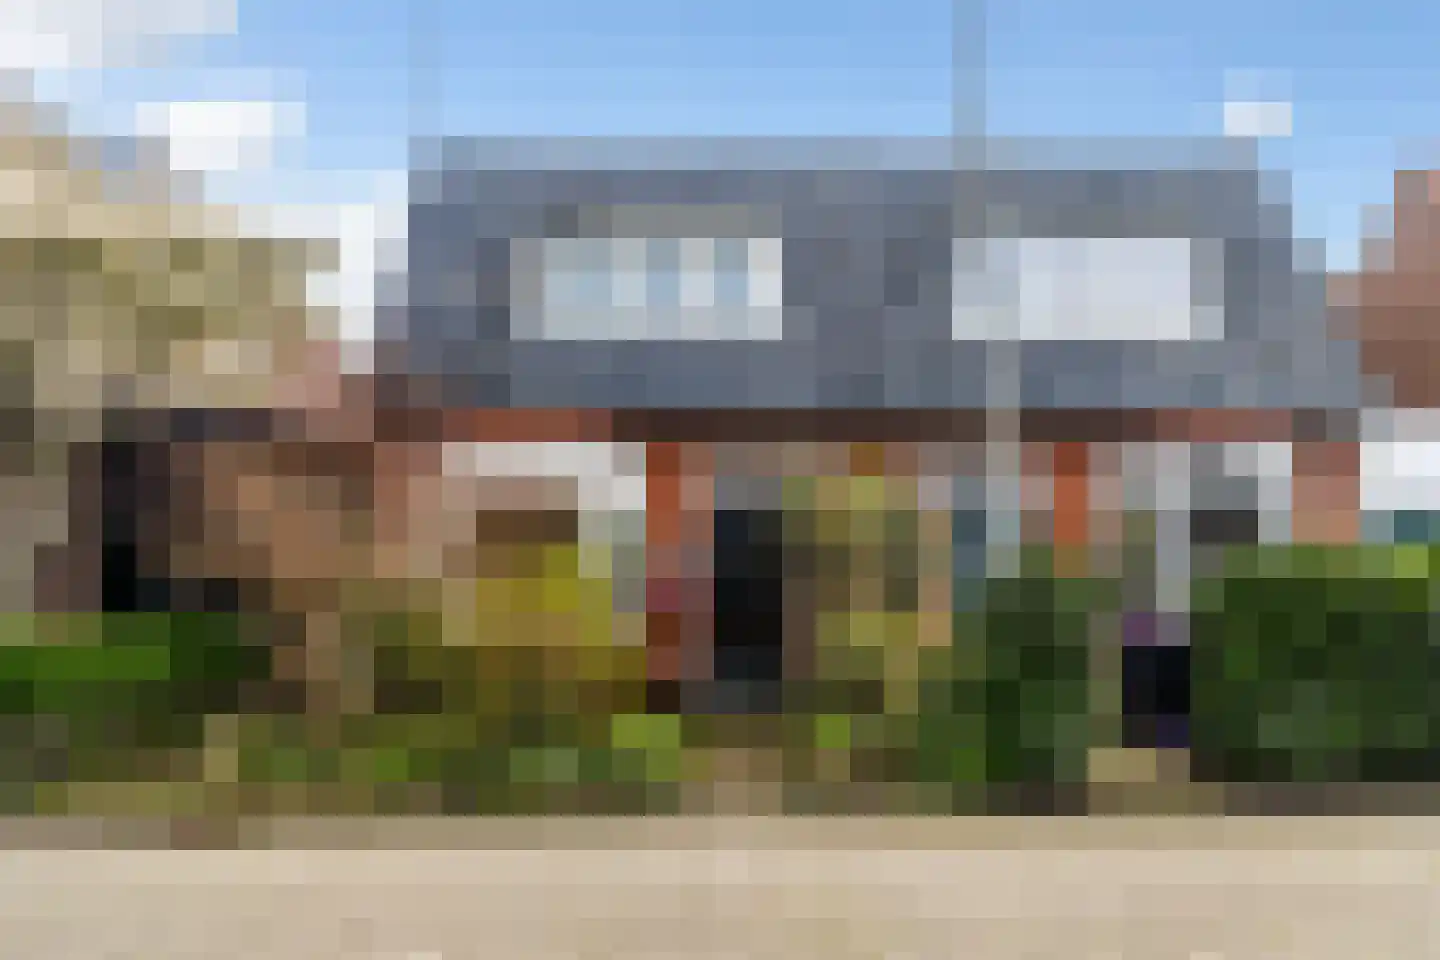
Brandemeer 102
8918CV Leeuwarden
€ 225.000 k.k.
€ 1.731/m²
CSave as favorite- Living area
- 130 m²
- Land area
- 119 m²
- Bedrooms
- 4
-
- Available
Buorkerij 150
8941AN Leeuwarden
€ 375.000 k.k.
€ 4.076/m²
ASave as favorite- Living area
- 92 m²
- Land area
- 173 m²
- Bedrooms
- 3
-
- Available
Cambuurstraat 55
8921HP Leeuwarden
€ 279.000 k.k.
€ 1.671/m²
GSave as favorite- Living area
- 167 m²
- Land area
- 99 m²
- Bedrooms
- 3
Reviews (118)
Review platforms
BronscoresTotal score
118 total reviews

Funda
76 reviews on Funda

42 reviews on Google
-
Antillenweg 49
10Leuke kennismaking. Goede begeleiding, planning en verdere verloop van t verkoopproces. Hele mooie presentatie, Korte lijntjes. Al met al een plezierige samenwerking.
-
Orxmasingel 132
10De verkoop is snel en soepel verlopen met een uitstekend resultaat! Complimenten voor het hele team van Faber Makelaardij, wat een prettige samenwerking!
-
Mozartstraat 51
10Faber Makelaardij is duidelijk en snel in de communicatie en is een betrouwbare partner bij aankoop en verkoop van een huis.
-
Leeuwerikstraat 98
10Translated by AIExcellent advice, good listening, spot on communication during the process, nice people. Clear about expectations.
-
Sontdwarsstraat 7
10Zeer ervaren makelaar. Deskundig. Korte lijnen. Super service.. erg blij met de begeleiding. Denken goed mee.
-
d'Hondecoeterstraat 13
10Huis verkocht via Faber, erg fijne ervaring! Communicatie ging top, via de groepsapp werd altijd alles snel gedeeld en werd er snel gereageerd bij vragen. De terugkoppelingen van Jesse na de bezichtigingen waren ook erg prettig. Zou deze makelaar dan ook zeker aanbevelen!
-
Groningerstraatweg 361 a5
10Heldere en laagdrempelige communicatie tijdens het hele verkoopproces. Het team was erg meedenkend in de juiste aanpak. De makelaar schakelde snel in een veranderde situatie. Onze tactiek tijdens het proces aangepast en met een heel mooi resultaat. Er was goed oog voor onze belangen en wensen tijdens het proces. Een aanrader dus!
-
It Houtstek 13
10Heel vriendelijk en deskundig personeel, via de app altijd snel antwoord op vragen. Goede begeleiding bij wat er allemaal komt kijken bij de verkoop
-
Margaretha de Heerstraat 21
10Geweldige makelaar! Marc heeft het top gedaan! Was een hele fijne communicatie en het huis in ontzettend snel verkocht!
-
Kwekerijstraat 30
10Verliep heel goed, we werden goed op de hoogte gehouden en alles werd duidelijk uitgelegd! Fijn om een groepsapp te hebben, waarin je makkelijk vragen kon stellen.
-
Leeuwerikstraat 86
10De verkoop van onze woning is werkelijk vlekkeloos verlopen. Dankzij de uitstekende communicatie werden we continu goed op de hoogte gehouden en wisten we precies waar we aan toe waren. De grondige kennis van de markt gaf ons veel vertrouwen en zorgde voor een mooi verkoopresultaat. Daarbij maakten de toegankelijke en professionele houding het hele proces niet alleen soepel, maar ook prettig om mee te maken. We kijken met een heel goed gevoel terug op de samenwerking. …
-
Nijlânsdyk 217 c
8Fijne makelaar, weinig gedoe. Soms miste je net even het stukje extra onderzoeken en doordenken/verder gaan. Wel deskundig en vriendelijk.
-
Eise Eisingastrjitte 12
10Translated by AIThe contact with the real estate agent went as desired. After a phone call, an appointment could be made quickly.
-
Het Zool 41
9Translated by AINice contact, I am very satisfied. Already used the services of this real estate agent before. Also very satisfied then.
-
It Heafek 19
10Translated by AIWe were well assisted by Faber Makelaardij. From day one there was a nice click and we went through everything together. We received good advice and the service and guidance were very pleasant throughout the entire process. The expertise was clearly noticeable. In short, we are very satisfied with this process!
-
Kamgras 33
10Translated by AIFine support throughout the entire process. Both the real estate agent and office are super easy to reach and friendly.
-
Holwortel 56
10Translated by AIThinking along and advising in all situations. Coming to appointments late and the communication is, in my opinion, prime. The cooperation was experienced as pleasant.
-
Haadstrjitte 13
10Jesse is a wonderful agent, and I will reach out to use him for any future home purchase! Very helpful along every step of the way.
-
Aggemastate 186
10Translated by AIFriendly and professional approach. Excellent contact with all parties involved! They take ample time for all questions you have.
-
Bildtsestraat 73
10Translated by AICommunication was good and pleasant from the start. A realistic picture was set. At every step they took, there was always feedback. They listened to our wishes and did not push something through against our will. In short, a top realtor, definitely recommended and therefore a 10 out of 10 on everything.