
Zekerheuts Makelaardij staat voor betrouwbare en persoonlijke begeleiding bij de aankoop of verkoop van uw woning. Met meer dan 25 jaar ervaring in de vastgoedwereld heeft het kantoor zich een sterke naam opgebouwd in Zuid Limburg. De makelaars leggen de nadruk op klantvriendelijkheid, service en flexibiliteit, met als kernwaarde dat elke klant centraal staat. Op één locatie vindt u een compacte organisatie die zich volledig toewijdt aa...
Current housing stock
-

- Available
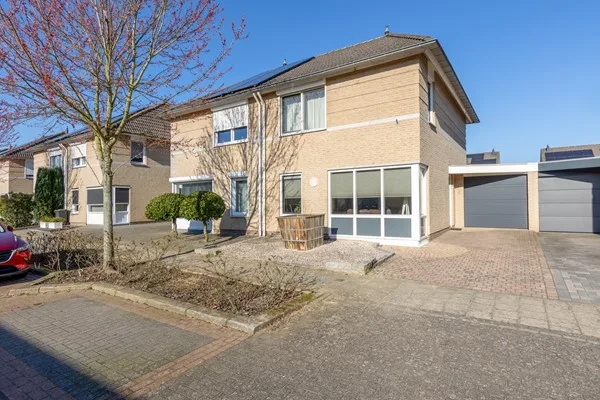
St. Josephstraat 13
6431XH Hoensbroek
€ 285.000 k.k.
€ 2.457/m²
ESave as favorite- Living area
- 116 m²
- Land area
- 196 m²
- Bedrooms
- —
-
- Available
Burg. Kerckhoffsstraat 22
6336XB Hulsberg
€ 469.000 k.k.
€ 3.148/m²
CSave as favorite- Living area
- 149 m²
- Land area
- 403 m²
- Bedrooms
- 3
-

- Available
Heerlerweg 13
6367AA Voerendaal
€ 549.000 k.k.
€ 1.920/m²
ESave as favorite- Living area
- 286 m²
- Land area
- 2002 m²
- Bedrooms
- 7
-

- Available
Klingbemden 3
6441KT Brunssum
€ 385.000 k.k.
€ 3.407/m²
ESave as favorite- Living area
- 113 m²
- Land area
- 393 m²
- Bedrooms
- 3
-

- Available
Jhr. v.d. Maesenstraat 43
6336VB Hulsberg
€ 389.000 k.k.
€ 3.039/m²
CSave as favorite- Living area
- 128 m²
- Land area
- 405 m²
- Bedrooms
- 3
-

- Available
Bachlaan 12
6361CL Nuth
€ 269.000 k.k.
€ 2.892/m²
FSave as favorite- Living area
- 93 m²
- Land area
- 225 m²
- Bedrooms
- 3
Reviews (116)
Review platforms
BronscoresTotal score
116 total reviews

Funda
78 reviews on Funda

38 reviews on Google
-
Tim Bruls
10Als je een ver/aankoop makelaar zoekt is er geen beter te vinden in de omgeving.
-
Beethovenlaan 2
9Het was een prettige en constructieve samenwerking, de makelaar is zeer deskundig en het verkooptraject is prima verlopen en het beoogde resultaat is gehaald.
-
Bourgogne 8
9Kennis van zaken, intuïties, bereikbaarheid, communicatie, mensenkennis, flexibiliteit, het was allemaal top bij Kim.
-
Kloosterweg 16
9We willen Zekerheuts Makelaardij in Hulsberg echt bedanken voor de fijne begleiding bij de verkoop van ons appartement in Valkenburg aan de Geul. Vanaf het eerste contact voelde het vertrouwd. In het begin verliep de verkoop niet zoals gehoopt, maar na goede aanpassingen en het vernieuwen van de foto's kwam er duidelijk verbetering. We werden goed op de hoogte gehouden van alles wat er speelde. We waarderen het dat er werd meegedacht en bijgestuurd waar nodig. Uiteindelijk is a…
-
Kervelhof 8
10Mijn huis nu verkocht via de mij goed bekende makelaardij Peter de Vor. Ook van hen mijn nu verkochte woning 26 jr geleden gekocht. Geweldige medewerkers die ons hierin begeleid hebben. Onze speciale dank aan de makelaar Erik van der Horst en de voor Zekerheuts opererende hypotheekadviseur John Willems. Niet was hen te veel. Veel deskundigheid. Dank jullie nogmaals voor alle werk. Met vr. groetjes: Tiny en Nol Scheepers in Hulsberg.
-
Ketelbuter 1
9Een deskundig, betrouwbare en realistische makelaar die altijd bereikbaar is en met je meedenkt. Topper!
-
Jan Maenenstraat 60
9Vanaf begin een goed en duidelijk advies ten aanzien van de aanpak om de verkoop naar wens te laten verlopen. Hiermee is een snelle verkoop gerealiseerd waarbij zowel kopende en verkopende partij zeer tevreden zijn!
-
Heerlerweg 105 J
10Goede begeleiding bij het verkoopproces en ruimte voor discussie als de markt verandert door invloeden van buitenaf. Kennis van zaken en weet wat de markt in Voerendaal doet.
-
Schippersdreef 8 C
9Goede en persoonlijke begeleiding. Men denkt oplossingsgericht en is goed bereikbaar voor vragen. Vanaf het eerste contact tot aan de daadwerkelijke / uiteindelijke verkoop liep alles zoals verwacht.
-
Dr. Poelsstraat 18
10We zijn ontzettend goed geholpen met de verkoop van het ouderlijk huis door de medewerkers/sters van Zekerheuts Makelaardij Hulsberg.
-
De Ping 25
10De makelaar heeft zich erg actief opgesteld en was duidelijk in de informatievoorziening. De begeleiding was efficiënt en vooral persoonlijk. Hierdoor verliep de verkoop prettig en snel tegen een mi. Goede prijs. Louter tevredenheid aan deze kant.
-
Gelein 16
10ZekerHeuts, in de persoon van de heer Erik van der Horst, heeft ons perfect begeleid bij de verkoop van de woning. Bij de verkoop van de woning werd een perfecte strategie gehanteerd, waarbij het vooraf voorspelde resultaat ook werd gerealiseerd. Gemaakte afspraken werden correct nagekomen en als verkopende partij werden wij steeds goed op de hoogte gehouden.
-
Mozartlaan 5
9Gesprekken en afhandeling van het begin tot aan het eind zijn zeer netjes en correct verlopen Heel erg tevreden mee en zeker aan te bevelen !
-
Burg. Ritzenstraat 6
8Makelaar nam de tijd en was deskundig, rustig en vriendelijk. We werden na iedere bezichtiging keurig op de hoogte gesteld.
-
Schutteheiweg 43
10Peter de Vor en zijn collega’s zijn zeer prettig en professioneel. Ze staan altijd voor je klaar. Kortom een makelaar die je nodig hebt.
-
Emmalaan 18 D
9Zeer correct, altijd op tijd! Zeer goede kennis van het appartement, met name vwb de vragen die geïnteresseerden hadden betreffende de VvE.
-
Panhuisstraat 12
7Behalve bij de kennismaking waar de opdracht werd binnen gehaald door de makelaar en op de dag van de verkoop hebben wij de makelaar zelf niet meer gezien en steeds met een collega van zijn kantoor te maken gehad. Nadat de verkoop bijna rond was bleek bij de notaris dat de makelaar ons onvoldoende had ingelicht over het in bezit hebben van de juiste papieren die nodig waren voor de verkoop van de woning. Waardoor de verkoopdatum bijna verschoven moest worden, maar er ook nog vee…
-
Diepestraat 11
10Translated by AISuper good contact, honest, clear, keeping appointments, top real estate agent! Always direct answers to our questions, by phone or via Whatsapp.
-
Mesweg 4
9Translated by AIVery good and easy contact with the real estate agents. They are always ready to help you with questions and think along with you. A realistic selling price has been calculated and they have made sure that the viewings went smoothly.
-
Patricia Gielkens
10Translated by AIVery satisfied with the good service and advice from your office. With heart and soul, work is done here to please both the buyer and certainly the seller....A TRUE recommendation!!!