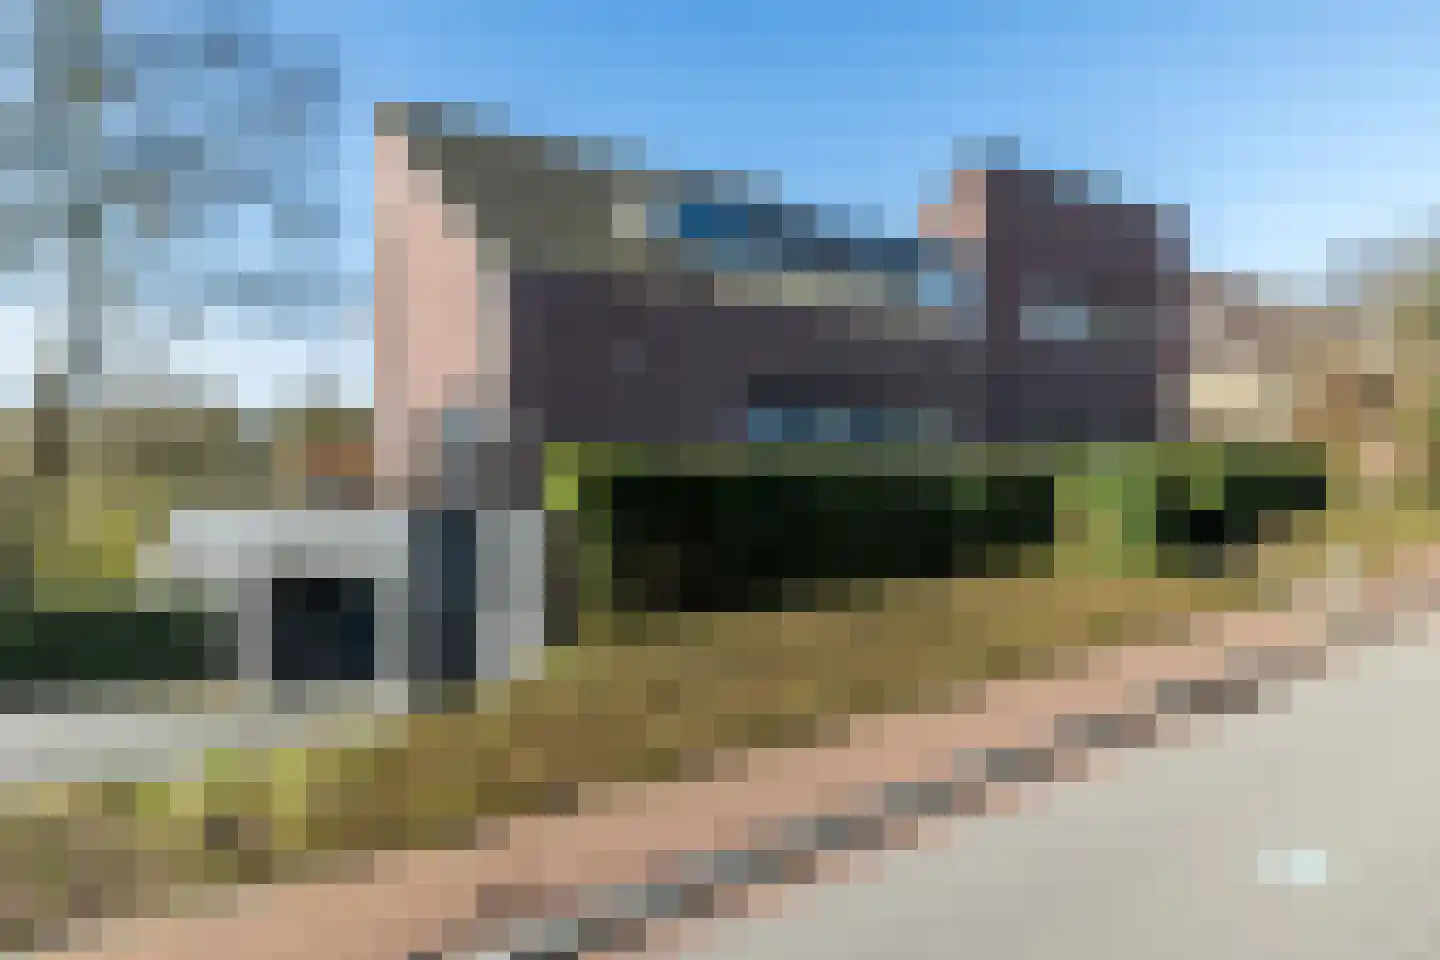
Housing offer in Merkelbeek

Searching in 19 houses in Merkelbeek

Connected to: Vastgoed Nederland NVM Makelaars

View the current housing stock in Merkelbeek and quickly filter by price, living area, rooms and more. There are currently 19 houses in this place within our selection. View also 14 sold houses in Merkelbeek for extra insight into the local housing market.

Selection

Search and filter homes

Set your preferences and discover homes that suit you.

Total supply 244.799
Filters

Set price, area and other characteristics. Adjust a filter or click on Show homes. Location changes directly above.

Reset filters

You search for

  • Place Merkelbeek

Selling a home in Merkelbeek? Compare realtor offers

Get free quotes from real estate agents with local market knowledge. Compare more than 85 real estate agents in Merkelbeek.

Free request a quote

  • Quotes in Merkelbeek
  • Non-binding
  • Personal
  • Compare free rates

Selling a home in Merkelbeek? Compare all real estate agents in Merkelbeek or view the top 10 real estate agents in Merkelbeek for extra context for your choice.

Compare multiple quotes

Real estate agents make sharper offers when they know you're comparing — ask for quotes for sale or purchase.

Frequently asked questions about homes in Merkelbeek

Practical answers about housing supply, sales and comparing real estate agents in Merkelbeek.

Residential and neighborhood statistics in Merkelbeek

View current location data on residents, WOZ development, housing stock, energy consumption, business activity and safety in Merkelbeek. In 2026 were there 1.617 residents. The average WOZ value in 2025 is EUR 327.000.

These figures help to better assess and compare the housing stock in Merkelbeek with recent sold homes. Orient yourself then on suitable top real estate agents in Merkelbeek for sales advice in this region.

Residents

1.617

Last year: 2026

Average WOZ

EUR 327.000

Last year: 2025

Average income per person.

EUR 33.300

Source: AllNumbers

Crimes (current year)

34

Total registered

Demographics and WOZ development

Inhabitants per year

Inhabitants per year in Merkelbeek
Year Residents
2021 1.610
2022 1.615
2023 1.595
2024 1.595
2025 1.625
2026 1.617

Annual WOZ value

WOZ value per year in Merkelbeek
Year Average WOZ
2021 EUR 244.000
2022 EUR 263.000
2023 EUR 301.000
2024 EUR 305.000
2025 EUR 327.000

Composition of residents

Age build-up

65+: 395 0-15: 240 15-25: 120 25-45: 380 45-65: 465

Education level

Hoger

350

Praktisch

350

Middelbaar

530

Origin of residents (2025)

Europa

165

Nederland

1.340

Buiten Europa

125

Housing stock and construction periods

Types of homes

Hoekwoningen 121
Appartementen 20
Tussenwoningen 162
Vrijstaande woningen 187
Twee-onder-één-kap woningen 235

Construction period of buildings

Voor 1700 0
1700 tot 1900 46
1900 tot 1925 50
1925 tot 1950 87
1950 tot 1970 216
1970 tot 1980 159
1980 tot 1990 110
1990 tot 2000 54
2000 tot 2010 20
2010 tot 2020 6
2020 en later 2

Energy and sustainability

Energy label distribution

Label C

172

Label D

125

Label F

113

Label G

103

Label B

97

Label A

57

Label E

44

Label A+

2

Label A++

0

Label A+++

0

Label A++++

0

Label A+++++

0

Average energy consumption per year

Average energy consumption per year in Merkelbeek
Year Gas (m3) Electricity (kWh)
2020 1.560 3.400
2021 1.810 3.490
2022 1.390 3.340
2023 1.150 3.170
2024 1.090 3.290

Consumption per house type

Hoekwoning

Gas: 1.010 • Electricity: 2.830

Huurwoning

Gas: 950 • Electricity: 2.440

Koopwoning

Gas: 1.190 • Electricity: 3.340

Appartement

Gas: 1.270 • Electricity: 3.160

Tussenwoning

Gas: 940 • Electricity: 2.820

Vrijstaande woning

Gas: 1.380 • Electricity: 3.920

Twee-onder-één-kap woning

Gas: 1.190 • Electricity: 3.020

Business activity in Merkelbeek (2025)

Handel en HORECA 25
Nijverheid en energie 20
Zakelijke dienstverlening 30
Overheid, onderwijs en zorg 30
Landbouw, bosbouw en visserij 10
Vervoer, informatie en communicatie 10
Financiele diensten en onroerendgoed 10
Cultuur, recreatie en overige diensten 20

Total number of company establishments: 155

Recent crime statistics

Recent crime statistics in Merkelbeek
Period Crimes
jan 2026 2
jul 2025 4
jun 2025 2
mei 2025 5
mrt 2025 0
mrt 2026 2
nov 2024 4
nov 2025 1
okt 2024 5
okt 2025 1
sep 2024 0
sep 2025 2

These figures give an indicative picture of safety trends in the living environment of Merkelbeek.

Frequently asked questions about living in Merkelbeek

Short answers based on current local statistics, handy for a quick comparison of the living environment.

Hoeveel inwoners heeft Merkelbeek?

Merkelbeek telt in 2026 ongeveer 1.617 inwoners.

Wat is de gemiddelde WOZ-waarde in Merkelbeek?

De gemiddelde WOZ-waarde in Merkelbeek is in 2025 circa € 327.000.

Wat is het gemiddelde inkomen per inwoner in Merkelbeek?

Het gemiddelde inkomen per inwoner in Merkelbeek ligt rond € 33.300 per jaar.

Hoe veilig is wonen in Merkelbeek?

Voor het huidige jaar gaat het om ongeveer 34 geregistreerde misdrijven. Gebruik deze cijfers als indicatie en vergelijk trends per periode.

Welke woningtypen komen het meest voor in Merkelbeek?

In Merkelbeek komt vooral "Twee-onder-één-kap woningen" veel voor, met ongeveer 235 woningen.

Receive free, non-binding quotes

Compare multiple real estate agents and choose the best match.