Bert Bimmel Makelaardij

Bert Bimmel Makelaardij staat al jaren bekend als een stabiele en betrouwbare partner in de makelaardij. Ons kantoor biedt ondersteuning bij aankoop, verkoop en taxatie van onroerend goed. In een wereld waarin transacties vaak complex zijn, streven wij ernaar om helderheid en betrouwbaarheid centraal te stellen. Wij leggen de nadruk op eerlijk prijsadvies, transparante communicatie en een duidelijke kostenstructuur. Onze werkwijze is ge...
Current housing stock
-
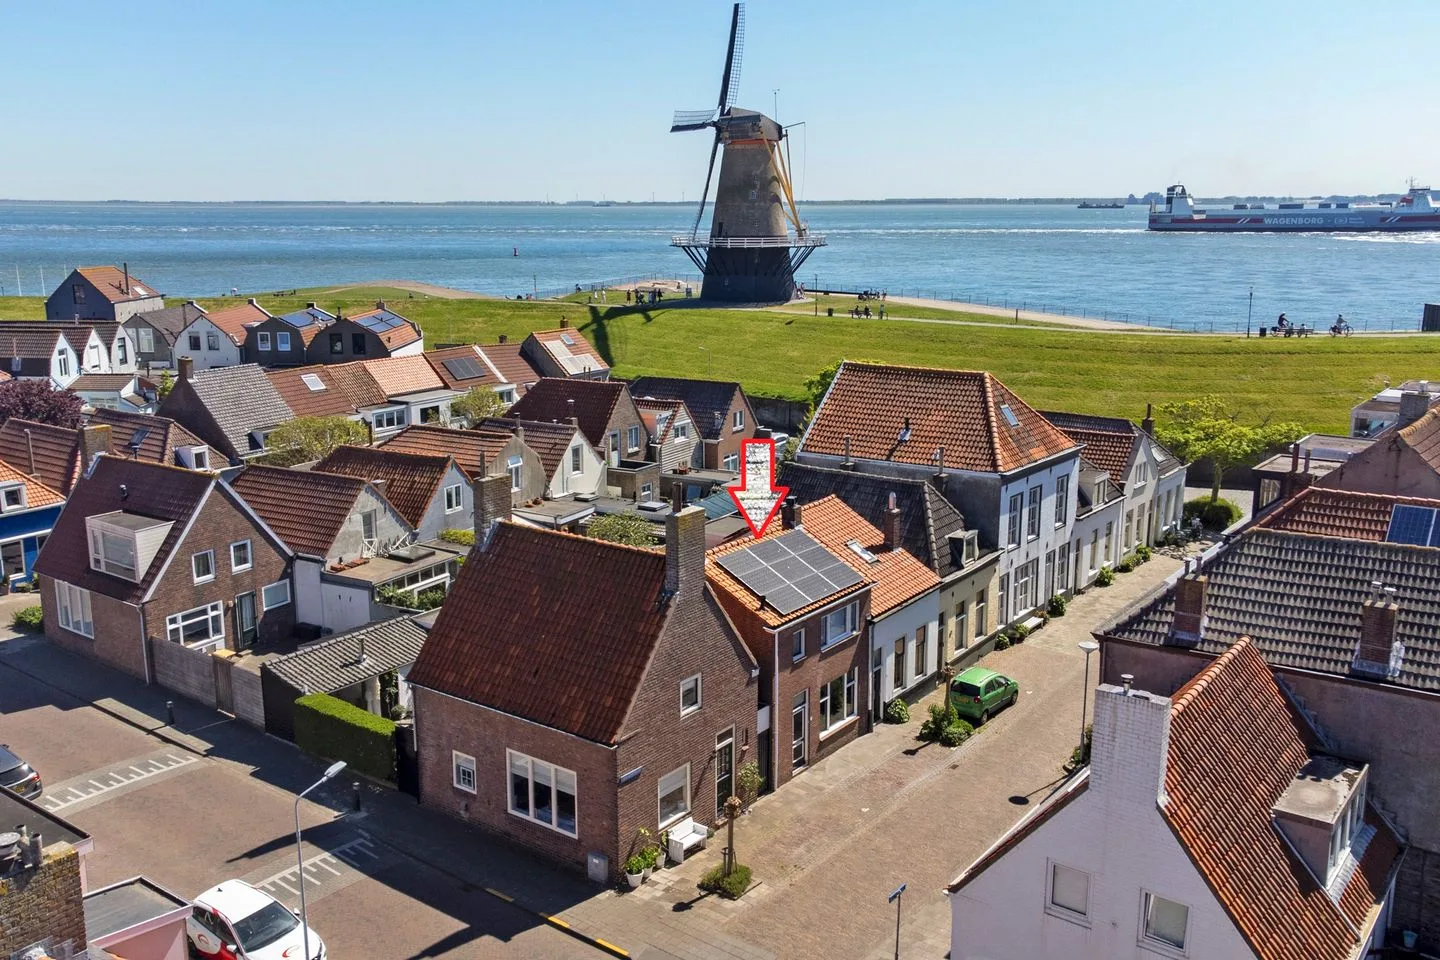
- Available
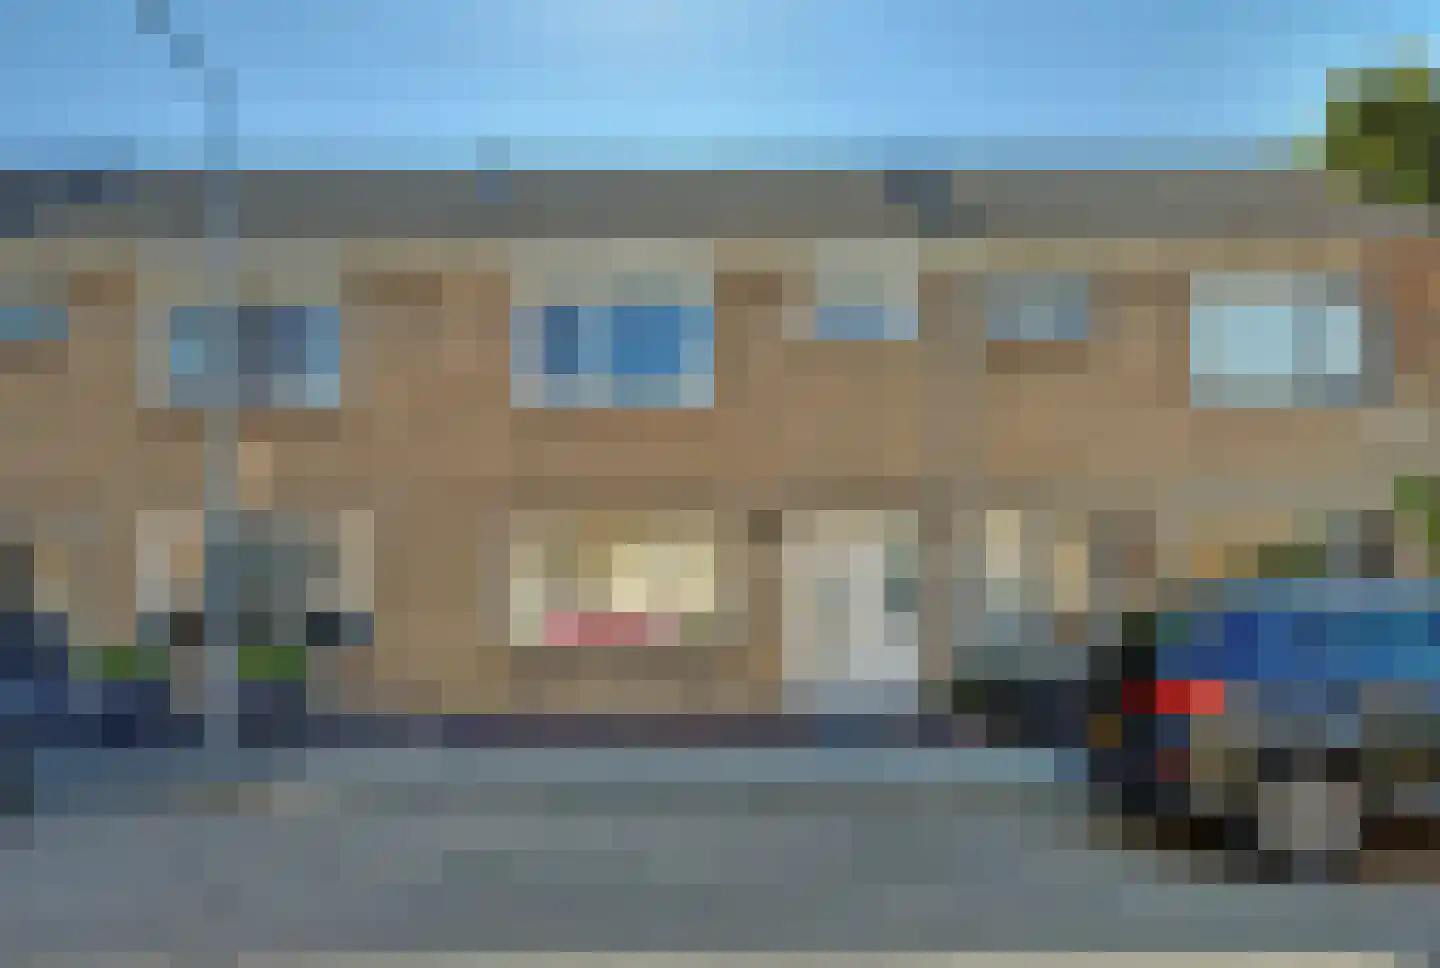
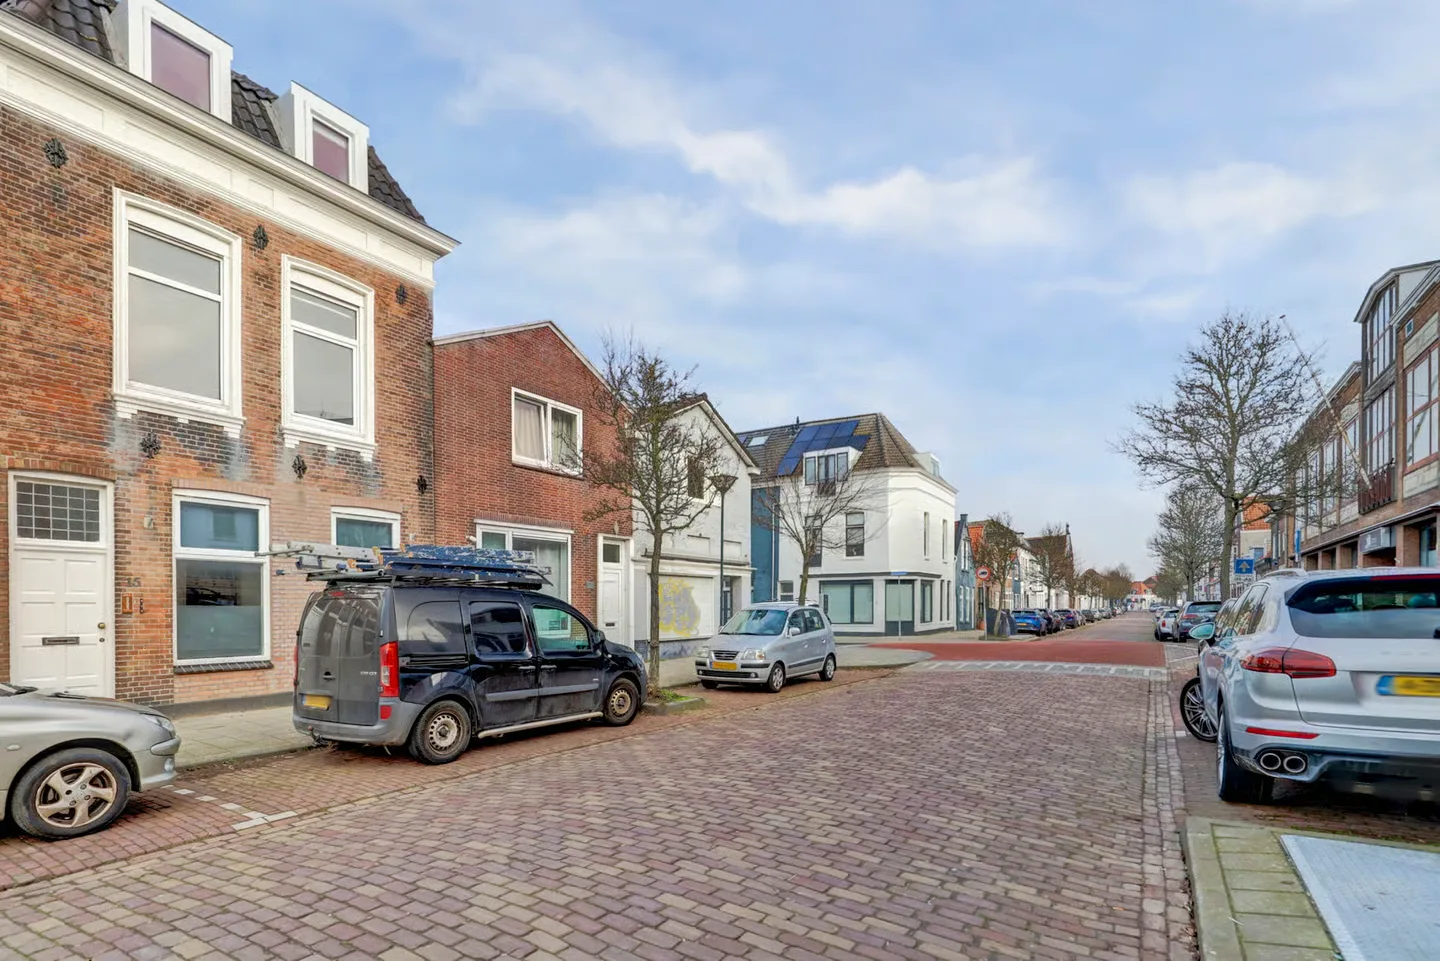
Prinsenstraat 26
4381AZ Vlissingen
€ 269.000 k.k.
€ 3.685/m²
ESave as favorite- Living area
- 73 m²
- Land area
- 110 m²
- Bedrooms
- 3
-
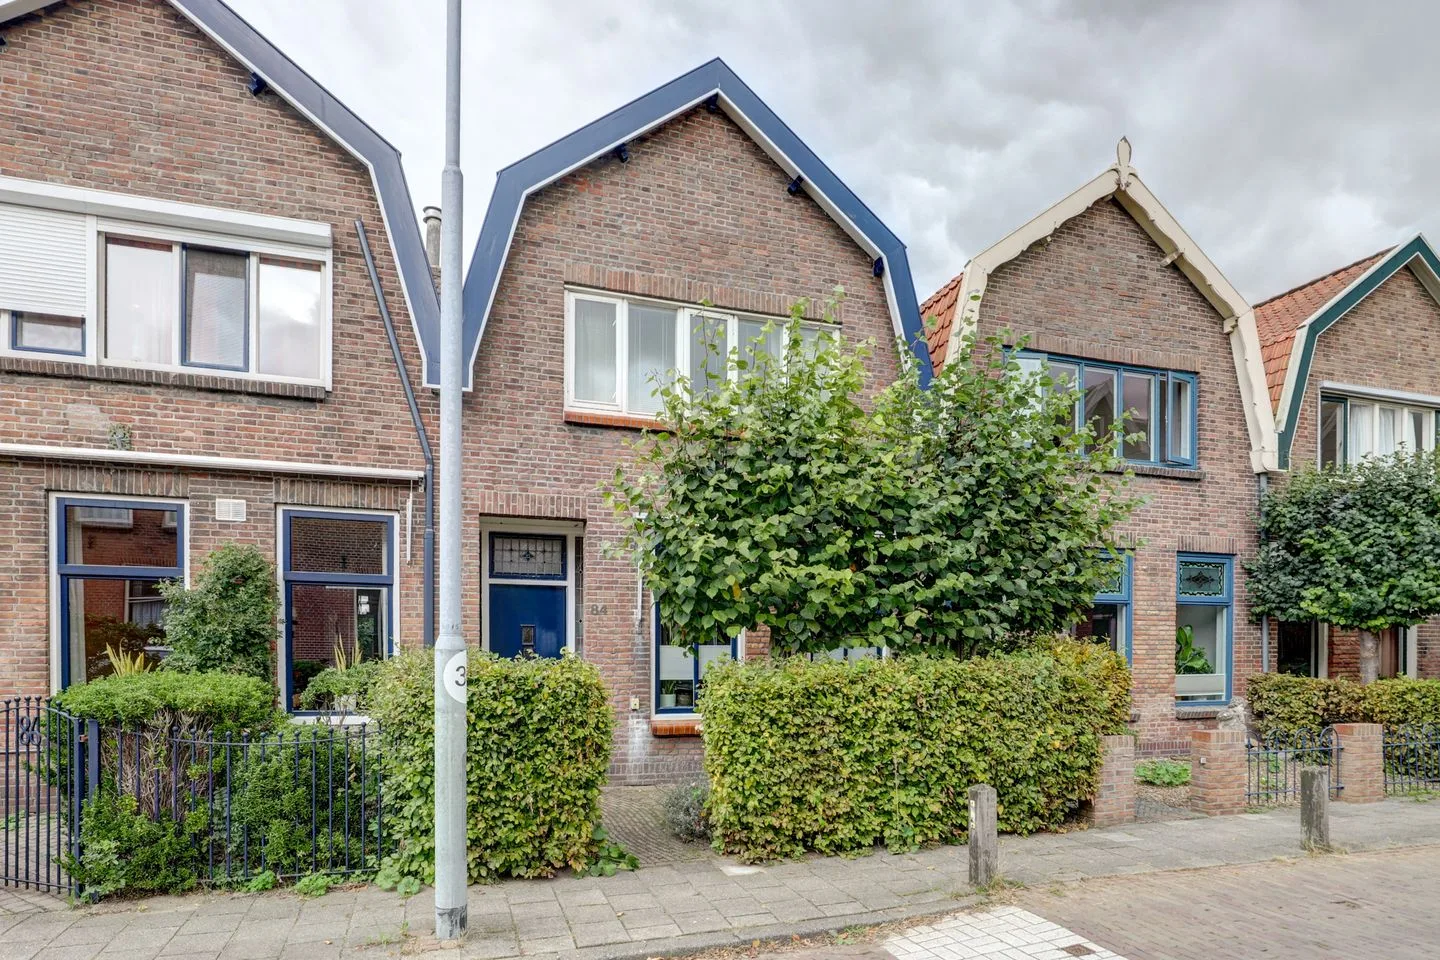
- Available
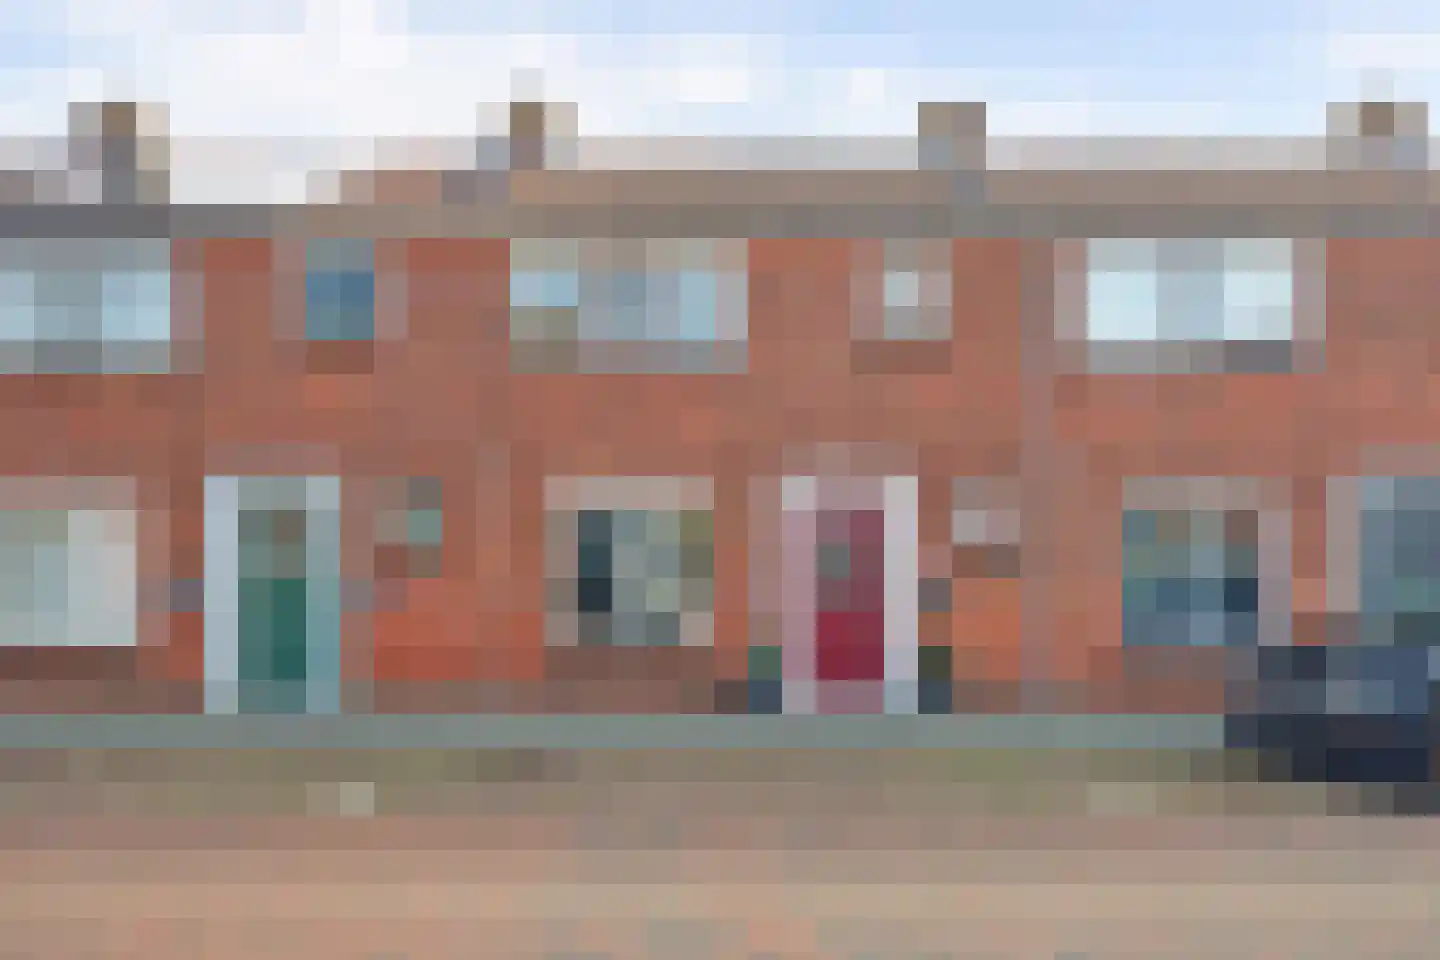
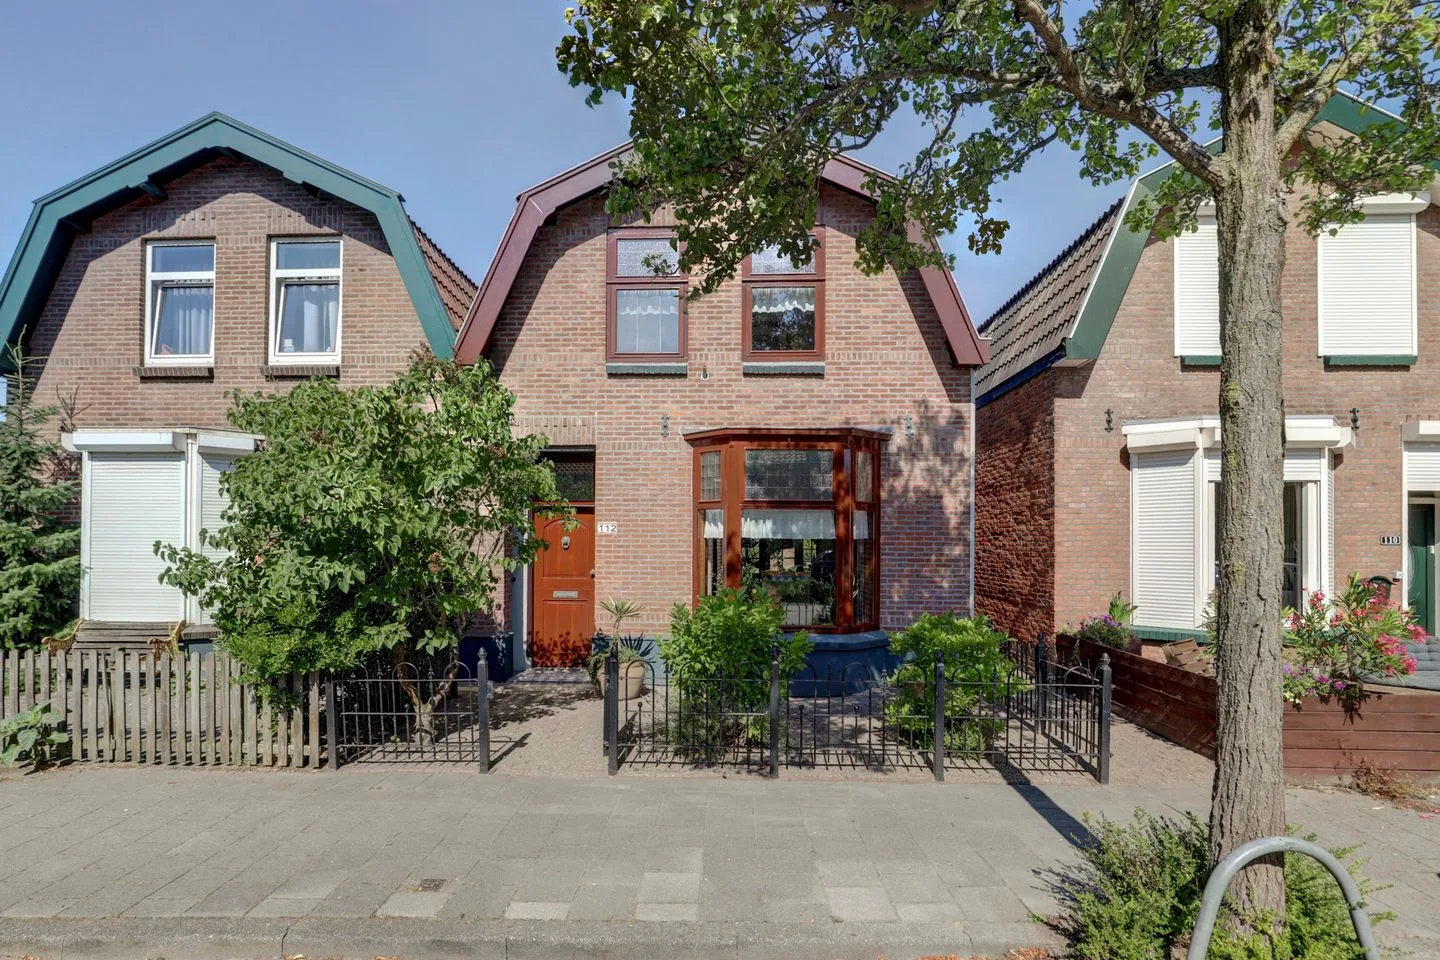
Noordweg 84
4333GK Middelburg
€ 389.000 k.k.
€ 3.297/m²
CSave as favorite- Living area
- 118 m²
- Land area
- 160 m²
- Bedrooms
- 3
-
- Available
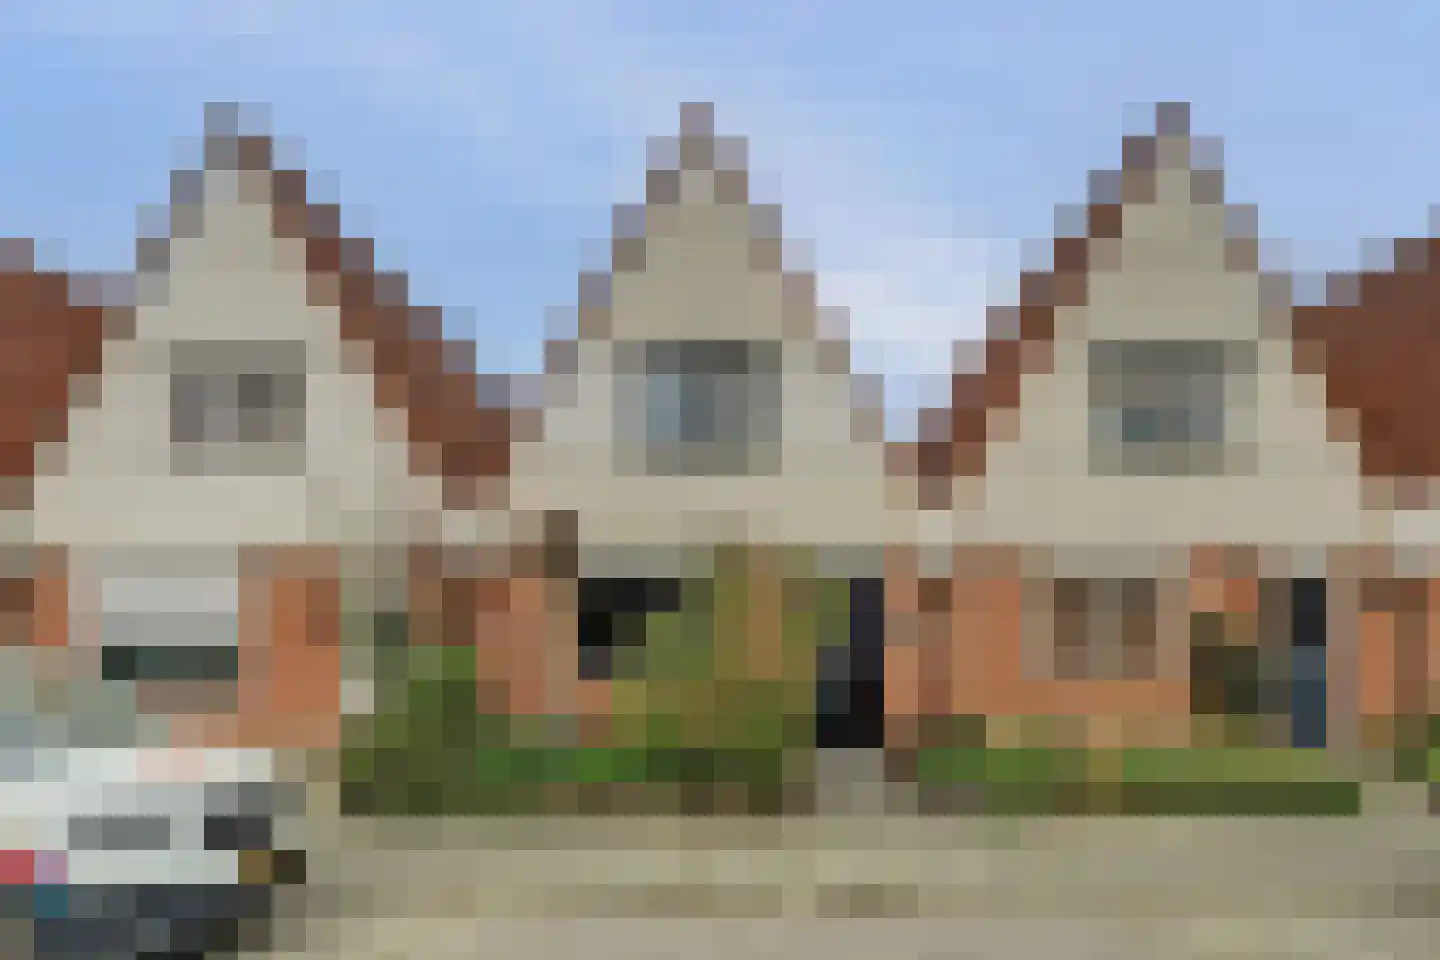
Wilgenstraat 136
4388LK Oost-Souburg
€ 219.000 k.k.
€ 2.671/m²
GSave as favorite- Living area
- 82 m²
- Land area
- —
- Bedrooms
- 2
-
- Available
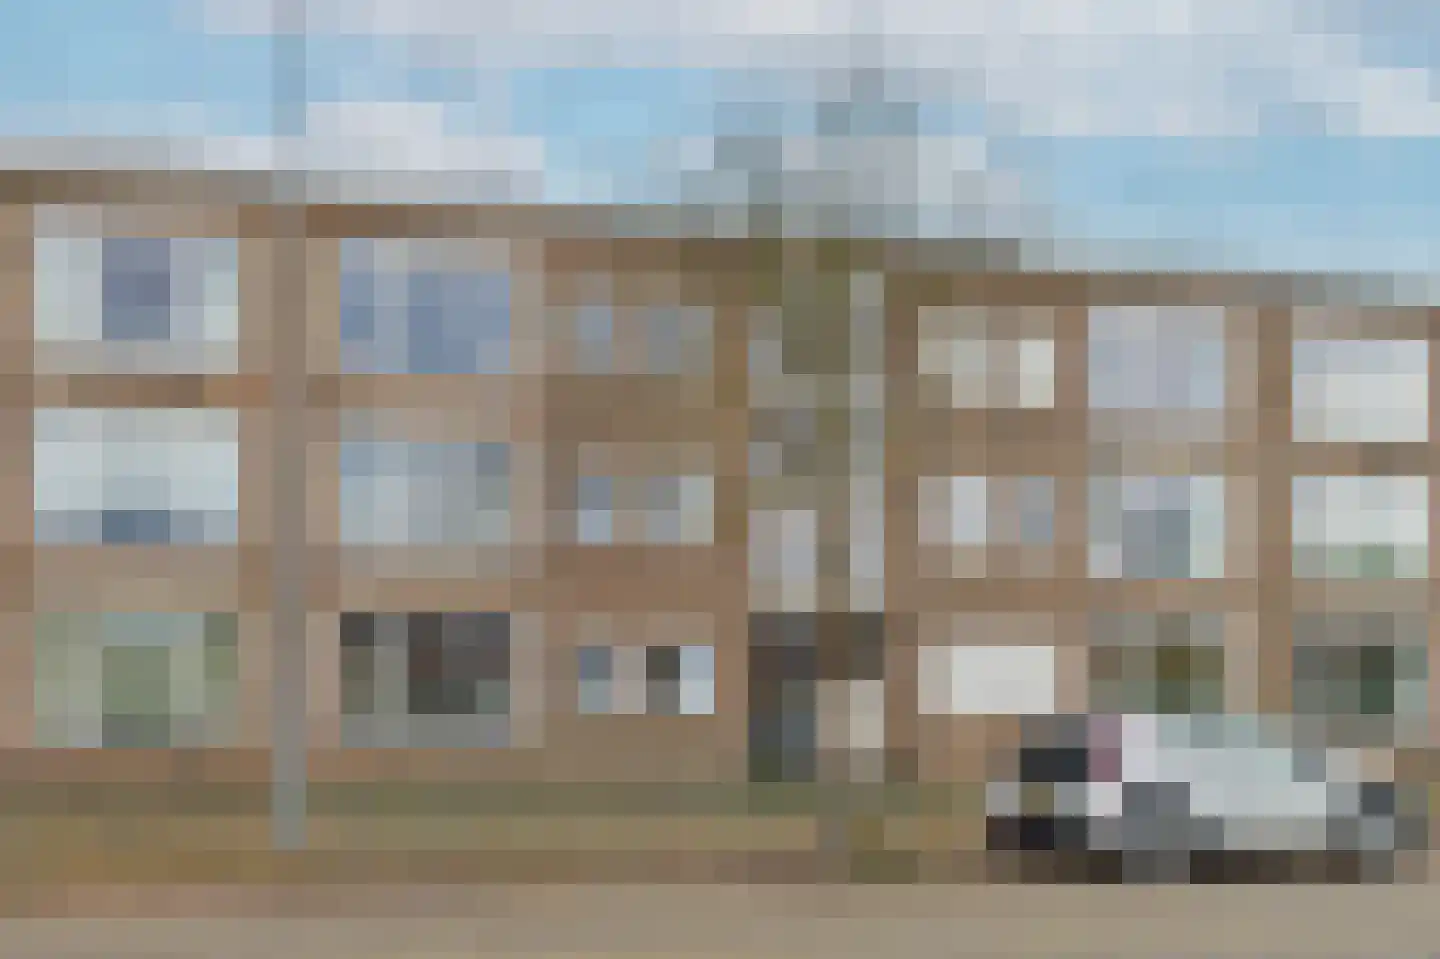
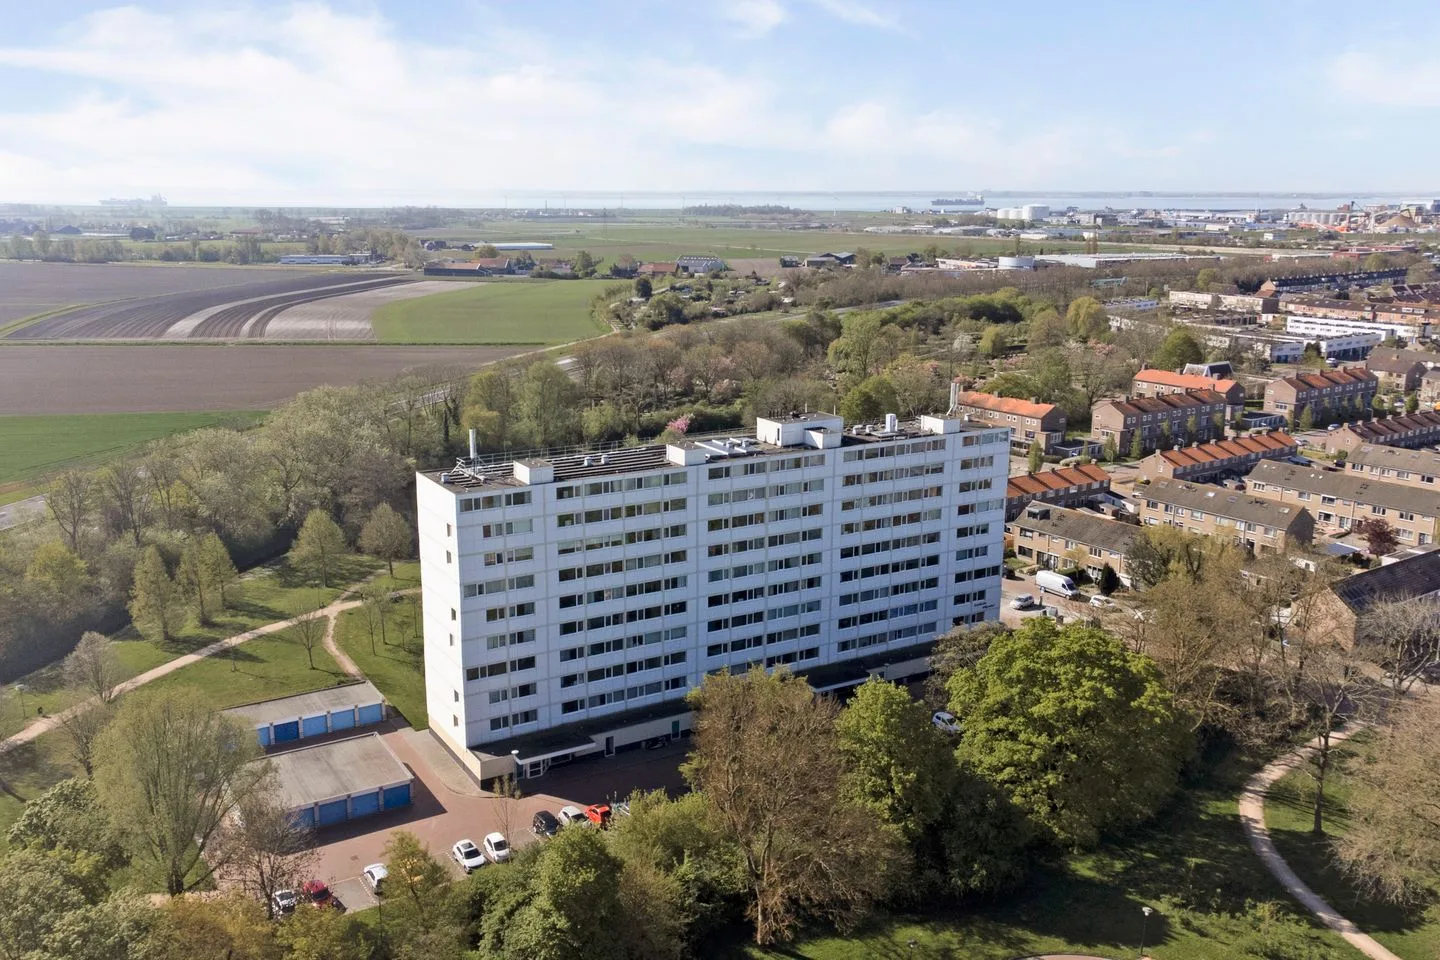
Noorderbaan 1
4386CD Vlissingen
€ 325.000 k.k.
€ 2.876/m²
CSave as favorite- Living area
- 113 m²
- Land area
- 168 m²
- Bedrooms
- 4
-
- Available
Glacisstraat 15 b
4381RE Vlissingen
€ 149.000 k.k.
GSave as favorite- Living area
- 55 m²
- Land area
- —
- Bedrooms
- 2
-
- Available
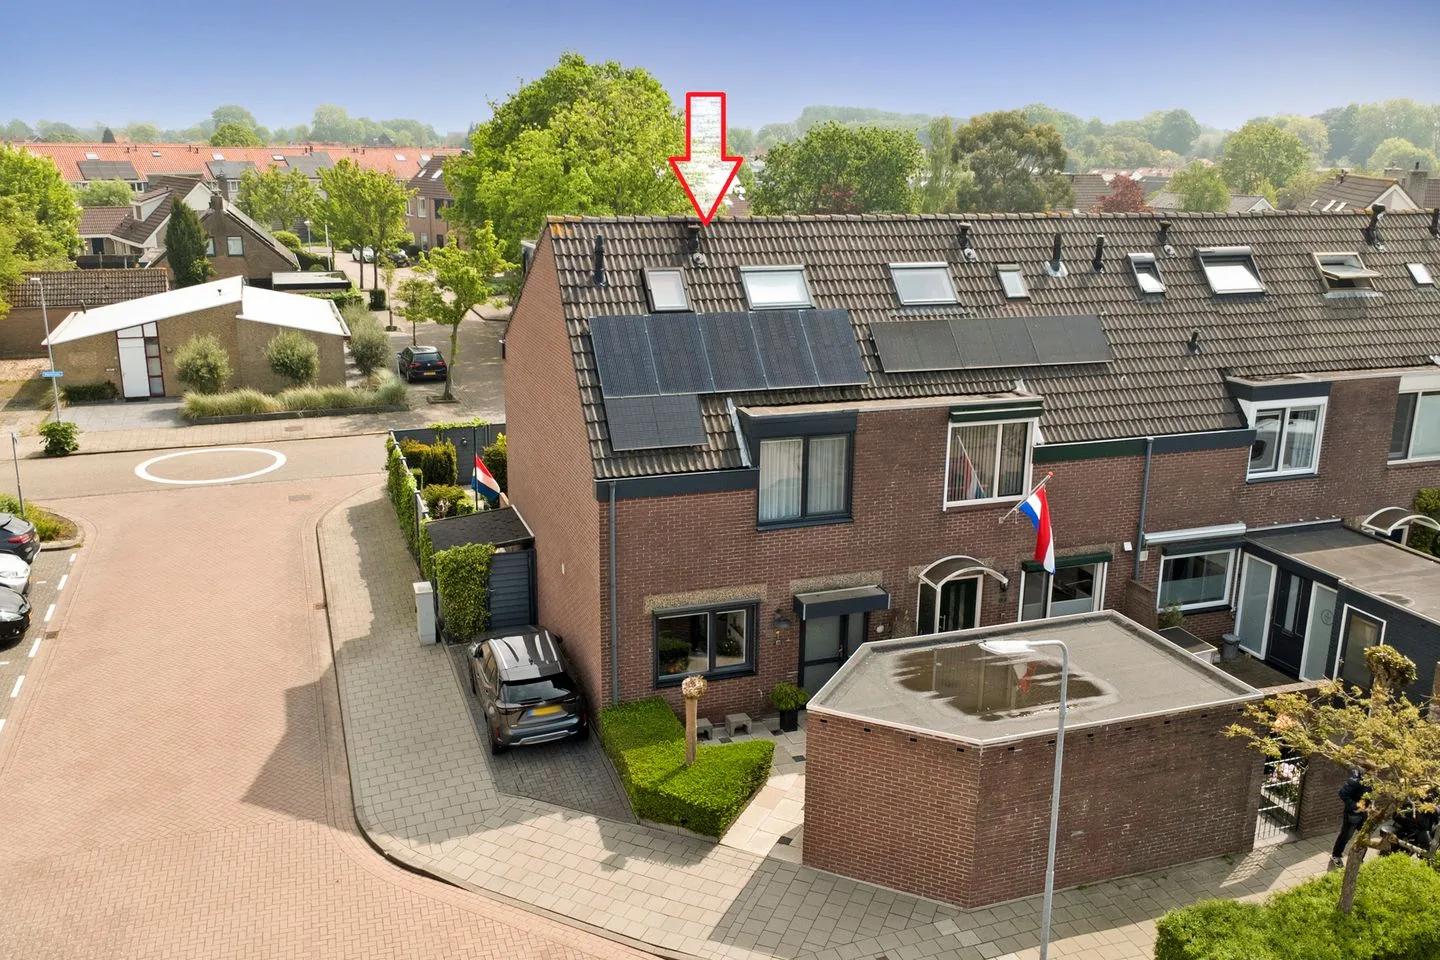
Vlissingsestraat 112
4388HG Oost-Souburg
€ 279.000 k.k.
€ 3.000/m²
GSave as favorite- Living area
- 93 m²
- Land area
- 175 m²
- Bedrooms
- 3
Reviews (77)
Review platforms
BronscoresTotal score
77 total reviews

Funda
54 reviews on Funda

23 reviews on Google
-
Singel 428
10Translated by AIPrime and fast contact after questions and taking actions. Expert advice and excellent sales support
-
Oosterscheldestraat 151
8Alles verliep goed. Een goede en rustige, betrouwbare en deskundige makelaar. Geen bijzonderheden.!
-
Hellenburg 13
10Zeer vriendelijk, professioneel en servicegericht. Alles perfect gedaan voor zowel verkoper alsook koper. Van harte aanbevolen, een sterke aanrader!
-
Singel 248
8Translated by AIThe contact was quick and clear. We expected the property to be sold quickly, given the positive reactions and demand on the market. This turned out to be somewhat against expectations but due to the positive efforts of the real estate agent, it resulted in a good outcome. We are satisfied with Bimmel and therefore also recommend this real estate agent.
-
Houtwal 21
8Translated by AIWe were helped by Arnold, a friendly and quiet man who takes the time for you during such a rather exciting period. Clear in his explanation I also definitely recommend Bert Bimmel.
-
Coosje Buskenstraat 15
9Translated by AIJust a no nonsense real estate agent with very friendly staff. Does what he needs to do.
-
Van Hogendorpweg 82
9 -
Nieuwstraat 7 a
8Translated by AIThe real estate agent was always easy to reach and acted quickly. The information we received from him after a viewing were also always clearly and promptly described in Move. So, in other words, we can recommend this real estate agent to others.
-
Willem Klooslaan 62
9Translated by AIThe appreciation in all respects, Very Good, in my opinion. A fantastic well-informed Team that complements each other perfectly where needed and communicates with the client in a pleasant & clear manner. Also, the buying party, as I asked my real estate agent, was not withheld anything that was important to them. Everything particularly transparent & pleasant sales process. Myself, I am clearly satisfied.
-
Strandwal 20
9Prettige begeleiding in dit verkoopproces. Kon altijd terecht met vragen en werd dan goed geholpen. Met veel dank!
-
Ruys de Beerenbrouckstraat 165
10Translated by AIFriendly people, personal guidance. Where for your money not the cheapest but real in pricing.
-
Bessie Smithstraat 7
10Translated by AIEverything perfectly arranged in the sales support, from the first conversations with Arnold to the final sale.
-
Schubertlaan 47
10Translated by AIExpertise and a personal approach make Bert Bimmel Real Estate into a successful partner in the sale of your home. No shouting sales pitches, but a calm and effective approach guarantee success.
-
Branderijstraat 20
10Translated by AIBert Bimmel Real Estate is a very competent, reliable real estate agent with knowledge of the local market, very communicative and easy to reach. Also on moments when it really matters, iron is broken by hand. We wholeheartedly and without any reservations recommend the office.
-
Weteringstraat 17
9Translated by AIA nice real estate agent who knows the market well in Vlissingen. Clear, and is punctual for his appointments. Definitely worth recommending!
-
Nieuwstraat 10
6Translated by AIThe real estate agent had already handed over the keys for the official handover so that we could no longer enter the apartment.
-
Noorderbaan 33
9Translated by AIDespite us having stayed in Spain, the contact was excellent. There was an immediate response to questions. After the handover, there was another contact moment.
-
Nolleweg 1
10Translated by AIVery good experiences with this small company (which means short communication lines) with a lot of knowledge regarding technical construction issues and commercial advice. Even more important to me: a good listening ear!
-
Rouaansekaai 115
9Translated by AIThe introduction with the explanation about the sale was very good and understandable. Bert Bimmel and his colleagues were very helpful and friendly. Actually, the process has been exactly as it was outlined beforehand, which demonstrates quite a bit of knowledge and experience.
-
Anna Blamanlaan 37
10Translated by AIBert and Arnold are both very skilled and friendly, and we were kept well informed. And when we had questions, we could always turn to them. And answers were given promptly or otherwise we were quickly called back. Nothing but words of praise. Definitely recommended.