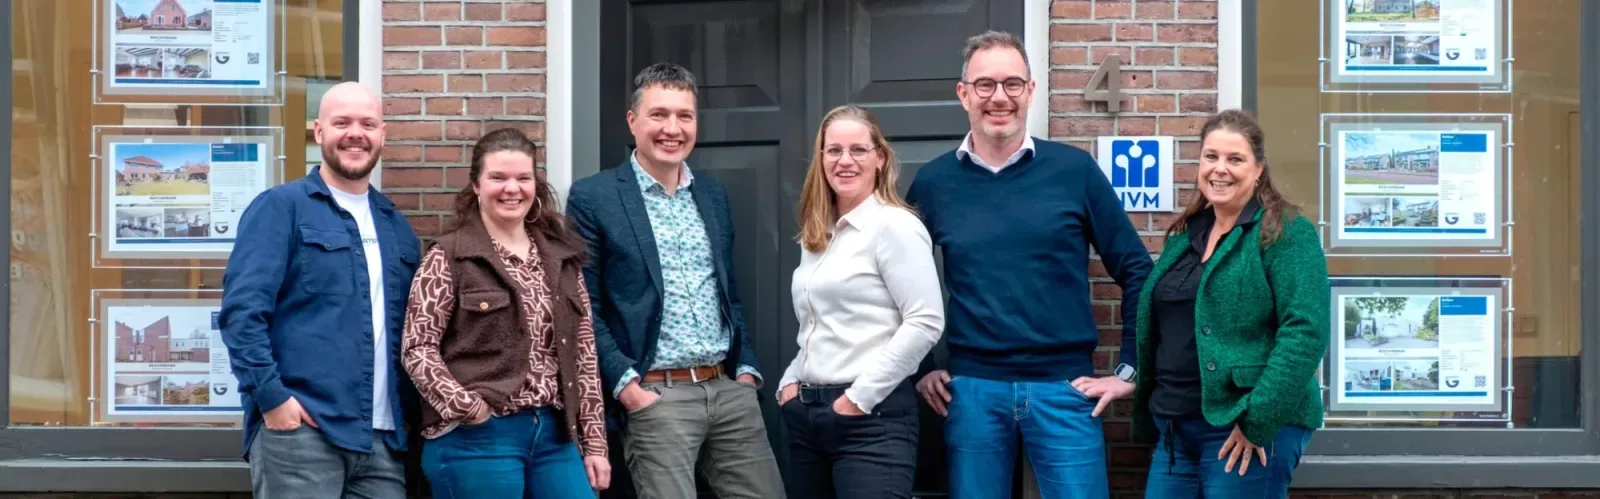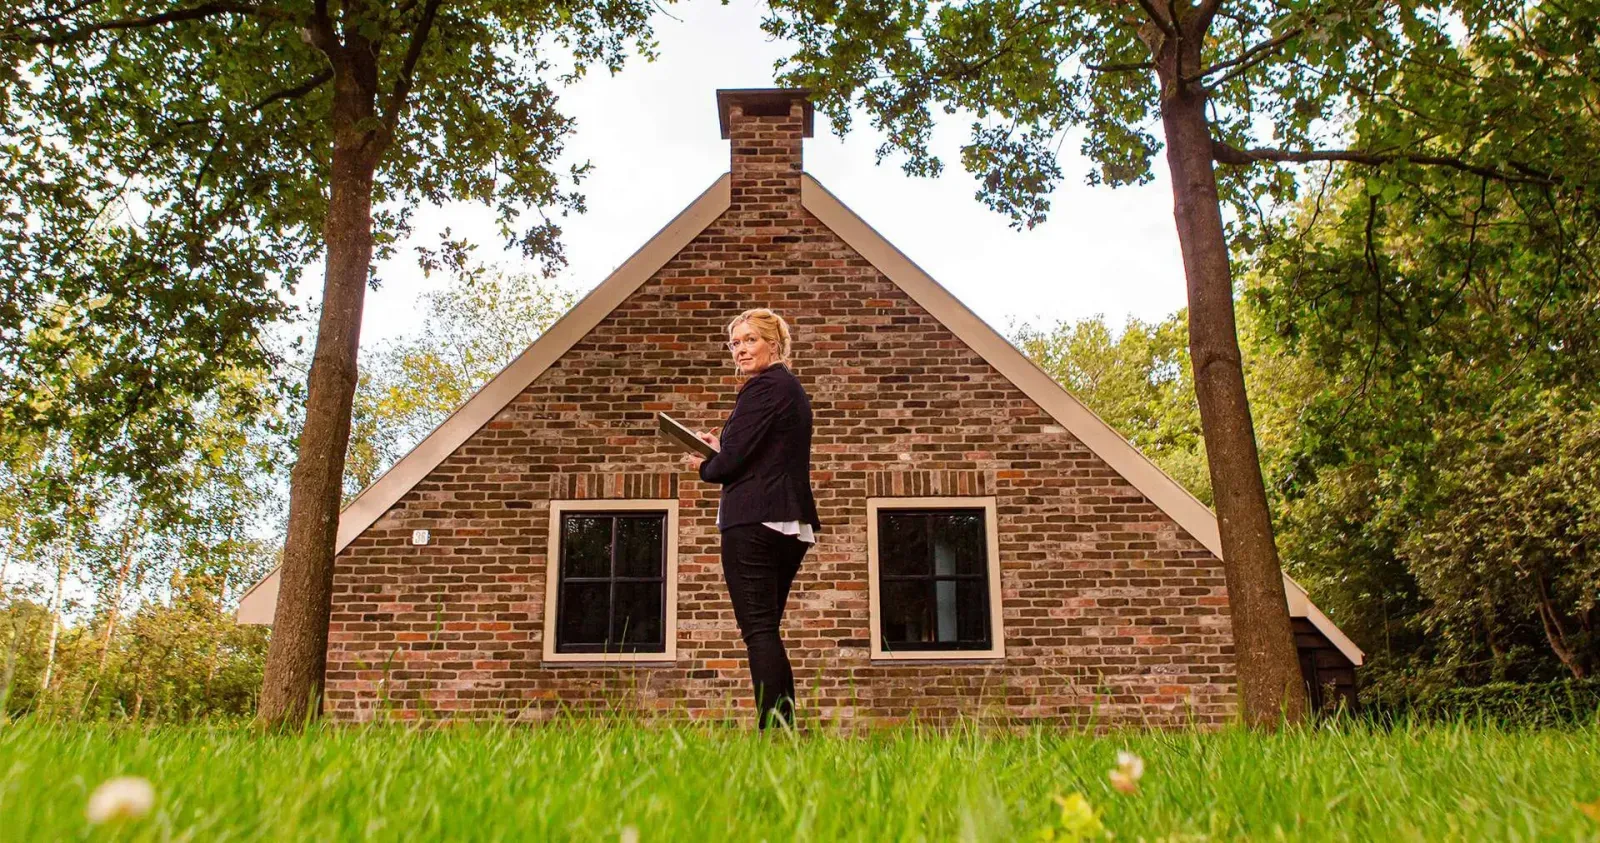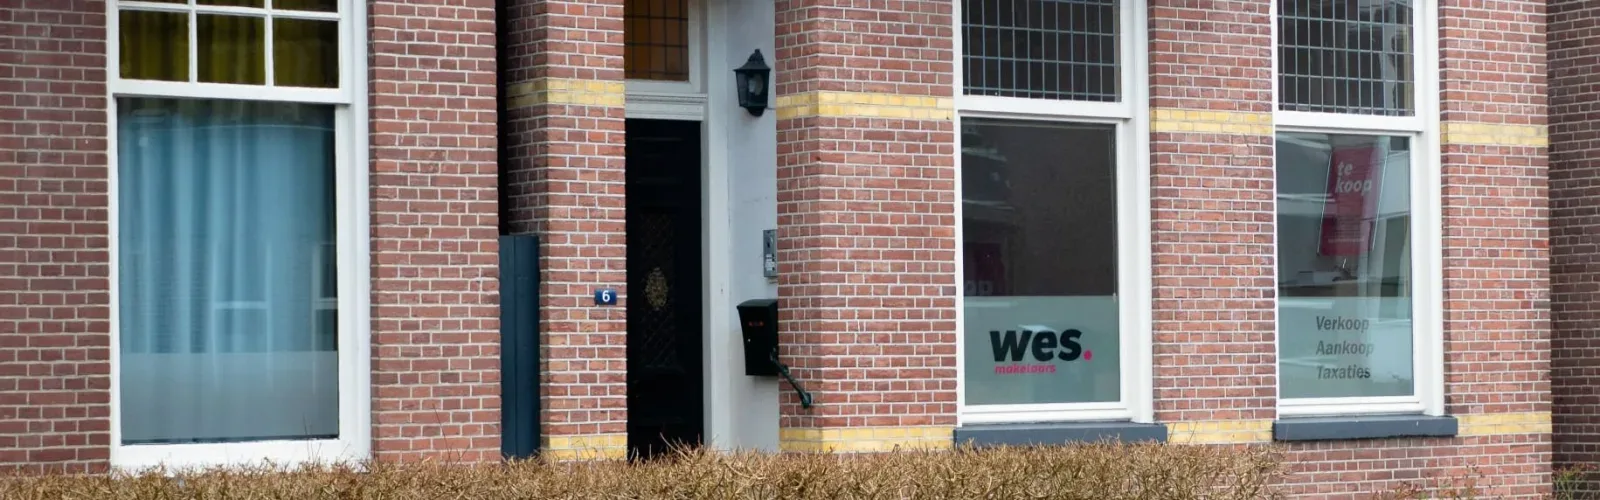
Wes Makelaars

WES Makelaars is a modern real estate agent in Assen that has specialized in the housing market of the region. With a fresh approach and a strong focus on personality, we offer both sales and purchase services. Our expertise lies in negotiations, valuations and land division, making use of our memberships with the NVM, NRVT, NWWI and VastgoedCert. Our working method is transparent, with fixed rates instead of commission. This way you kn...
Current housing stock
-
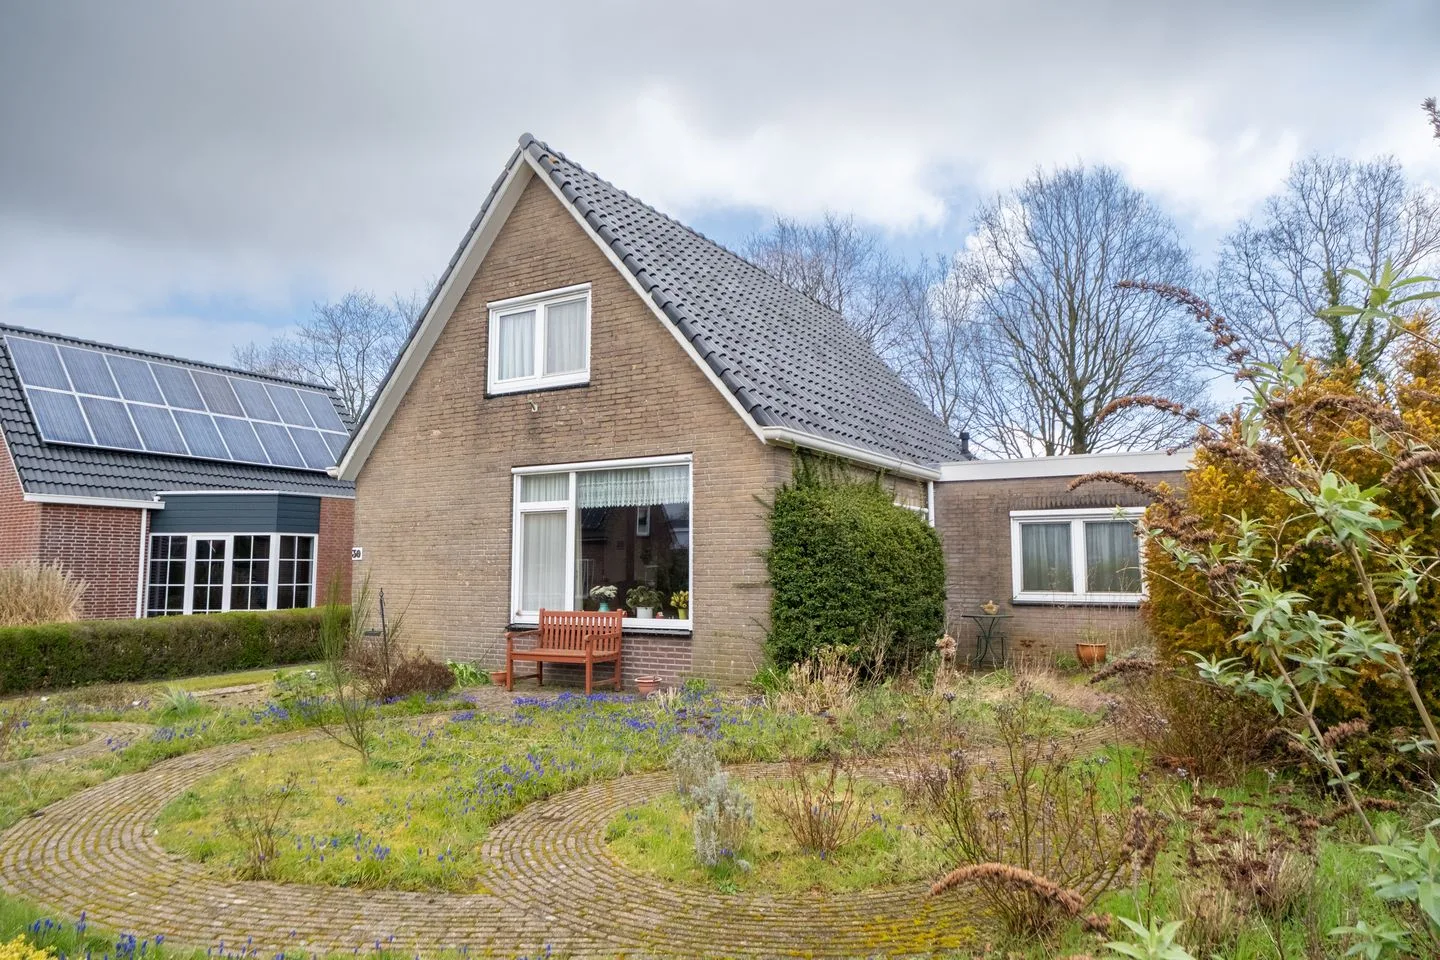
- Available
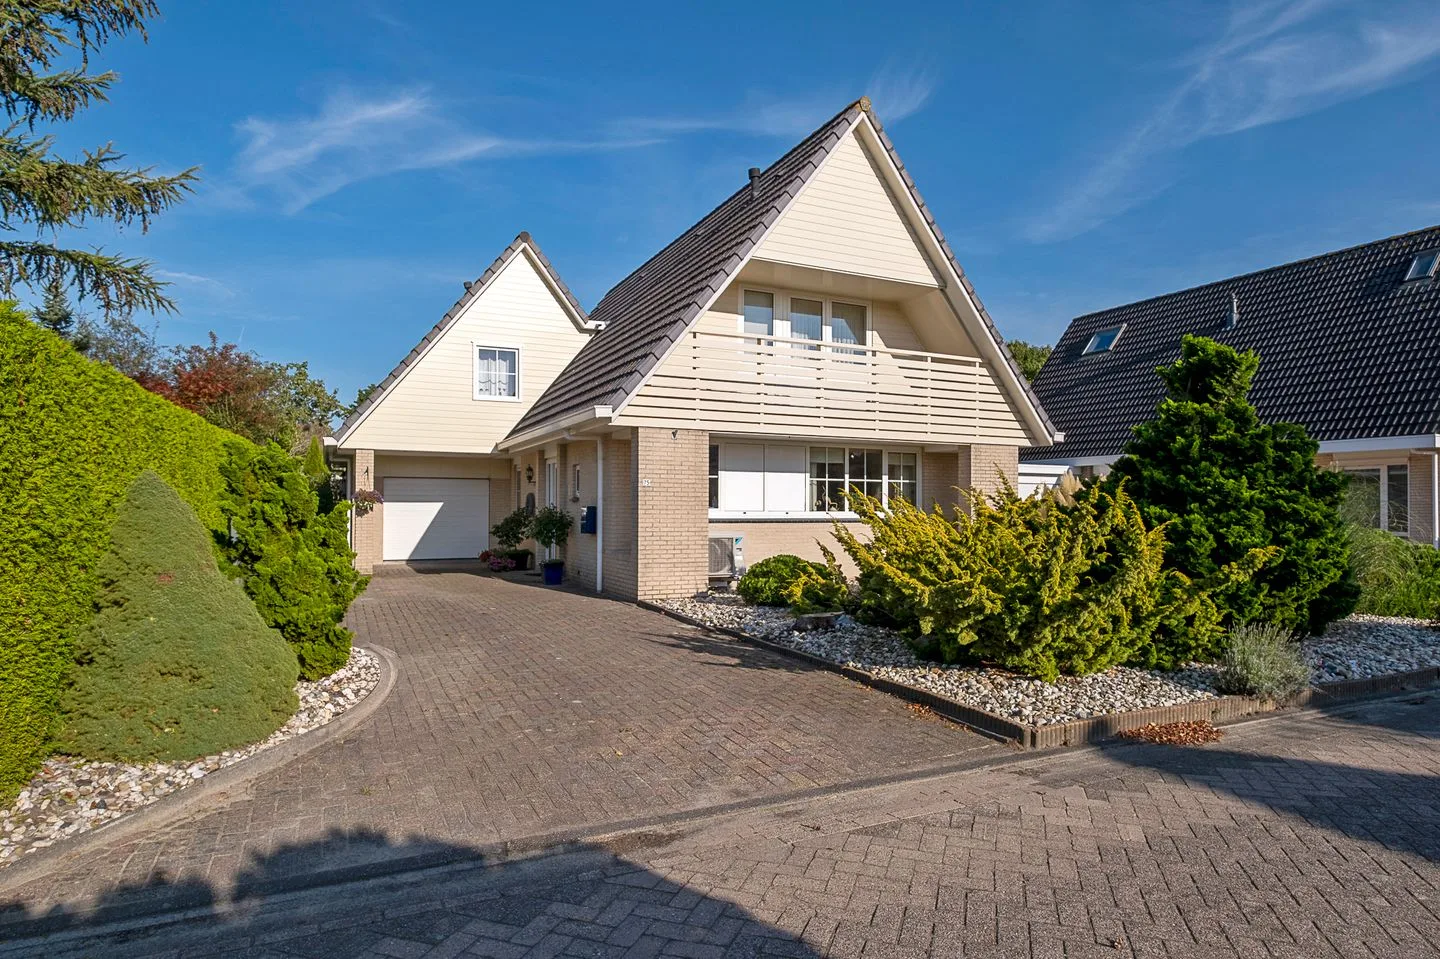
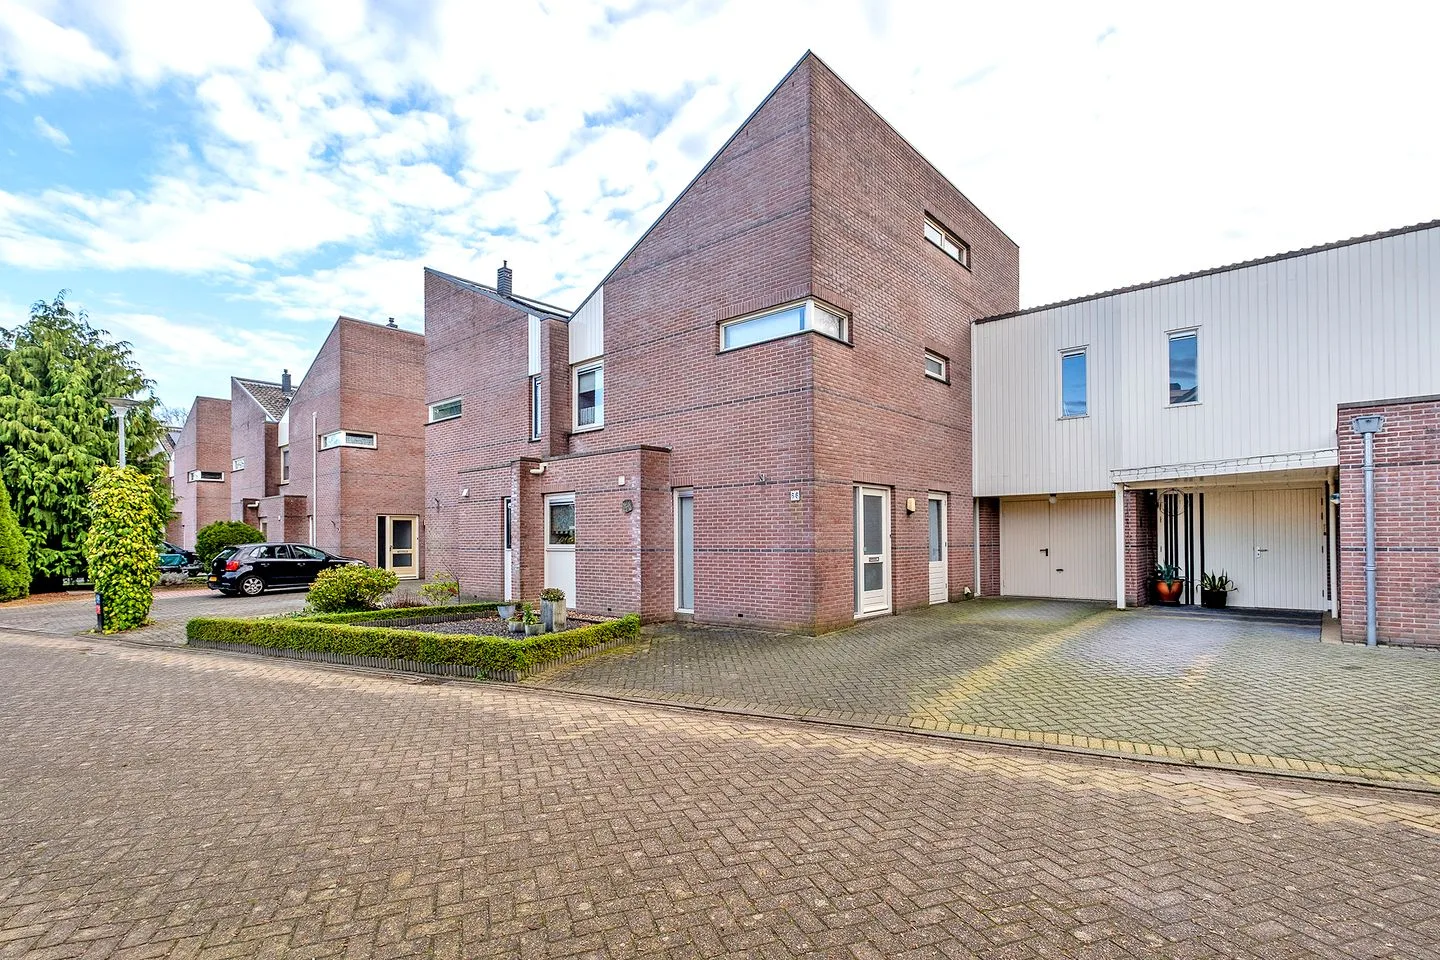
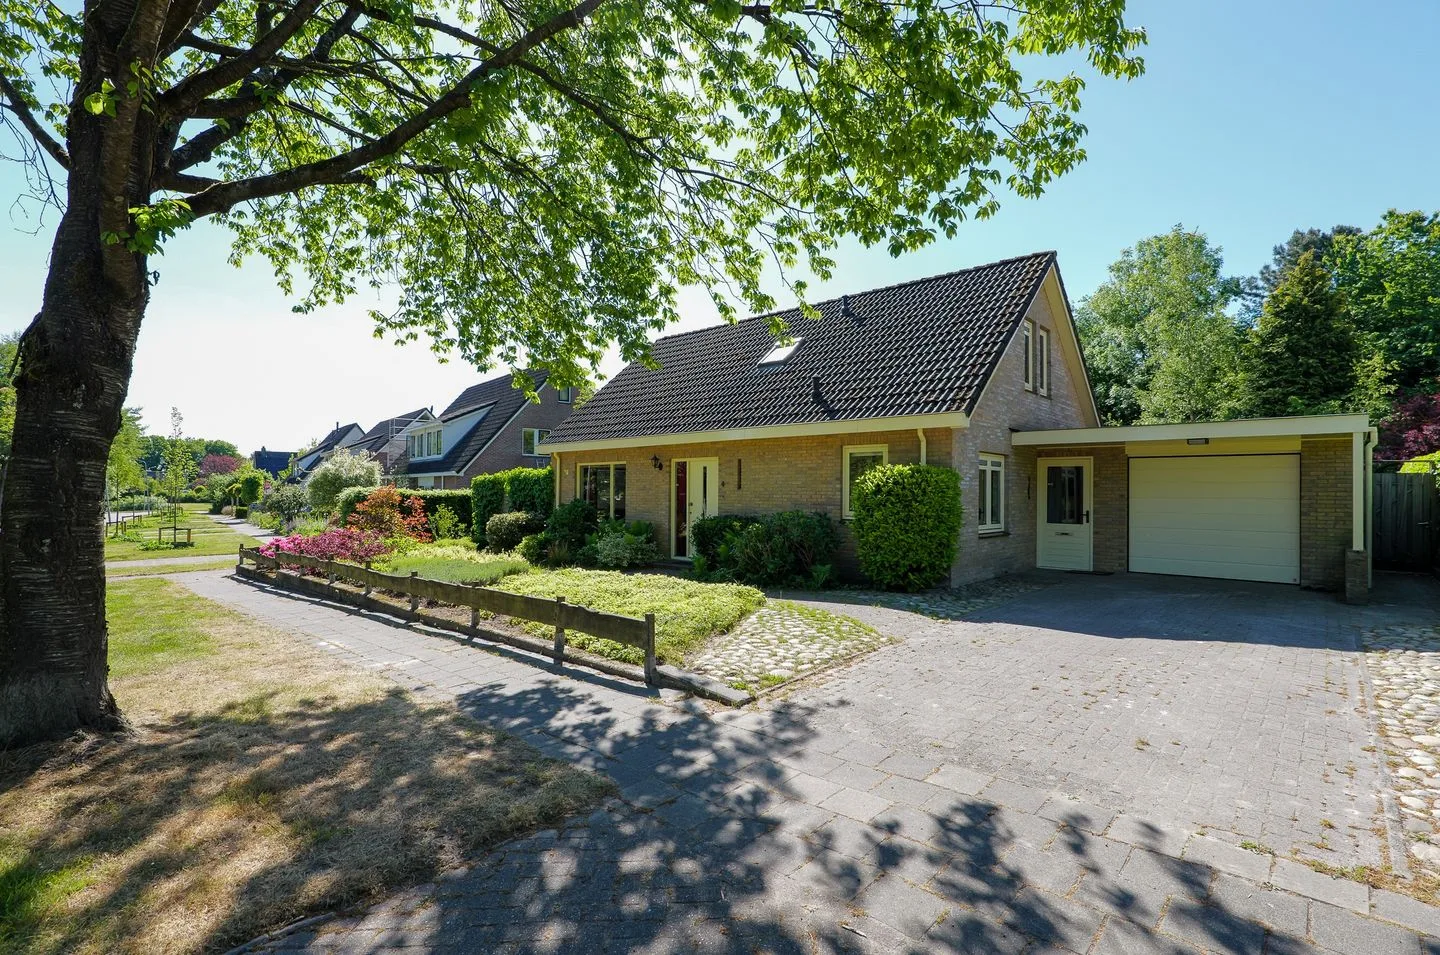
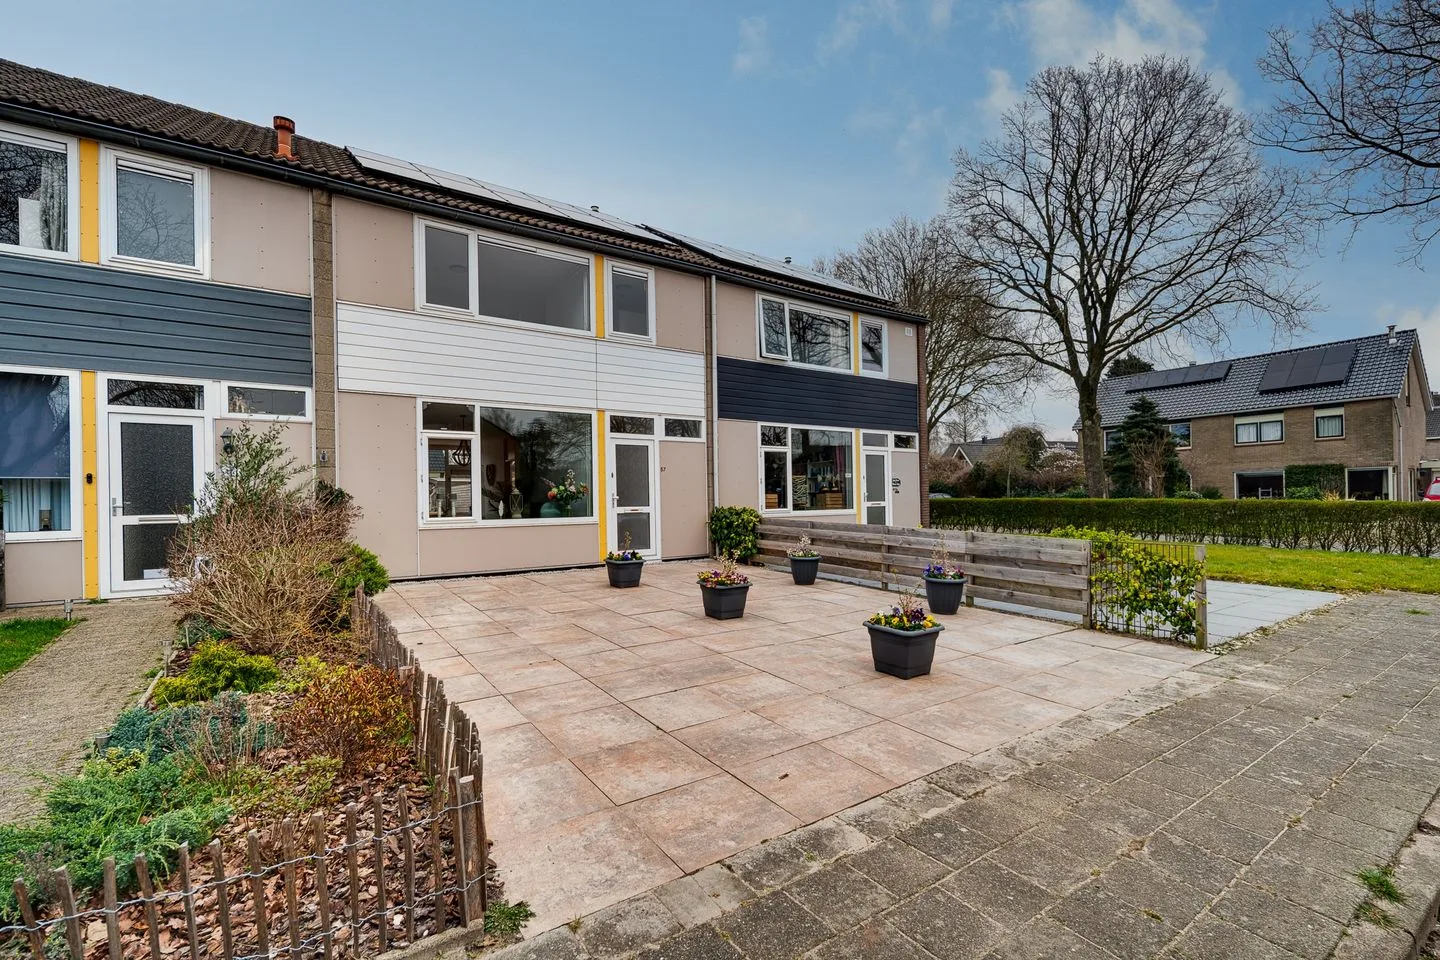
Keverkleuven 35
9403ZC Assen
€ 369.000 k.k.
ASave as favorite- Living area
- 104 m²
- Land area
- 165 m²
- Bedrooms
- 3
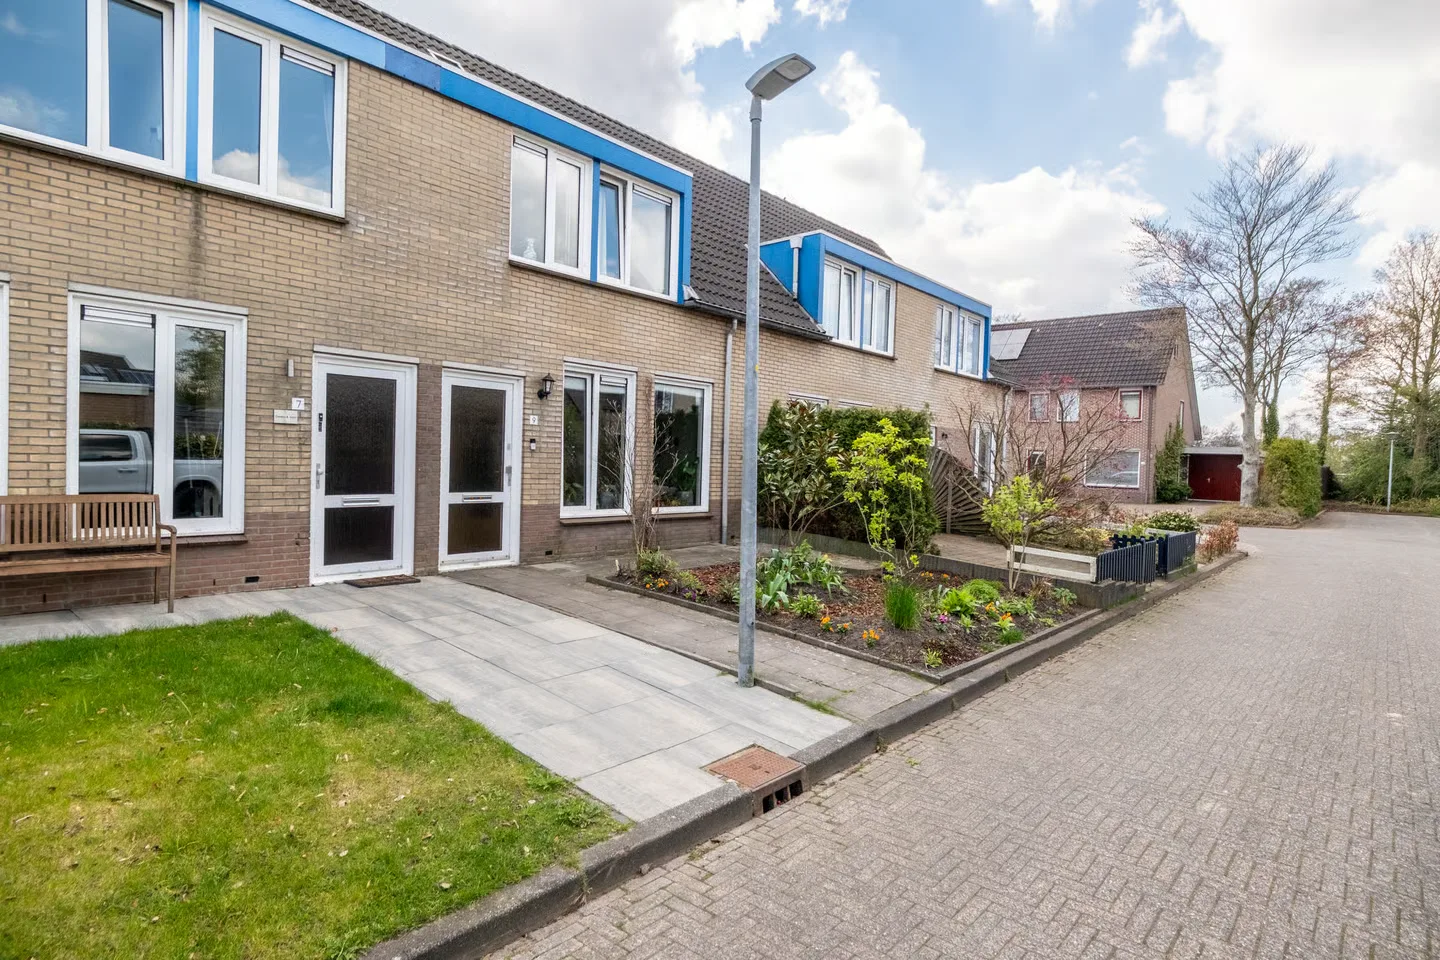
-
- Available
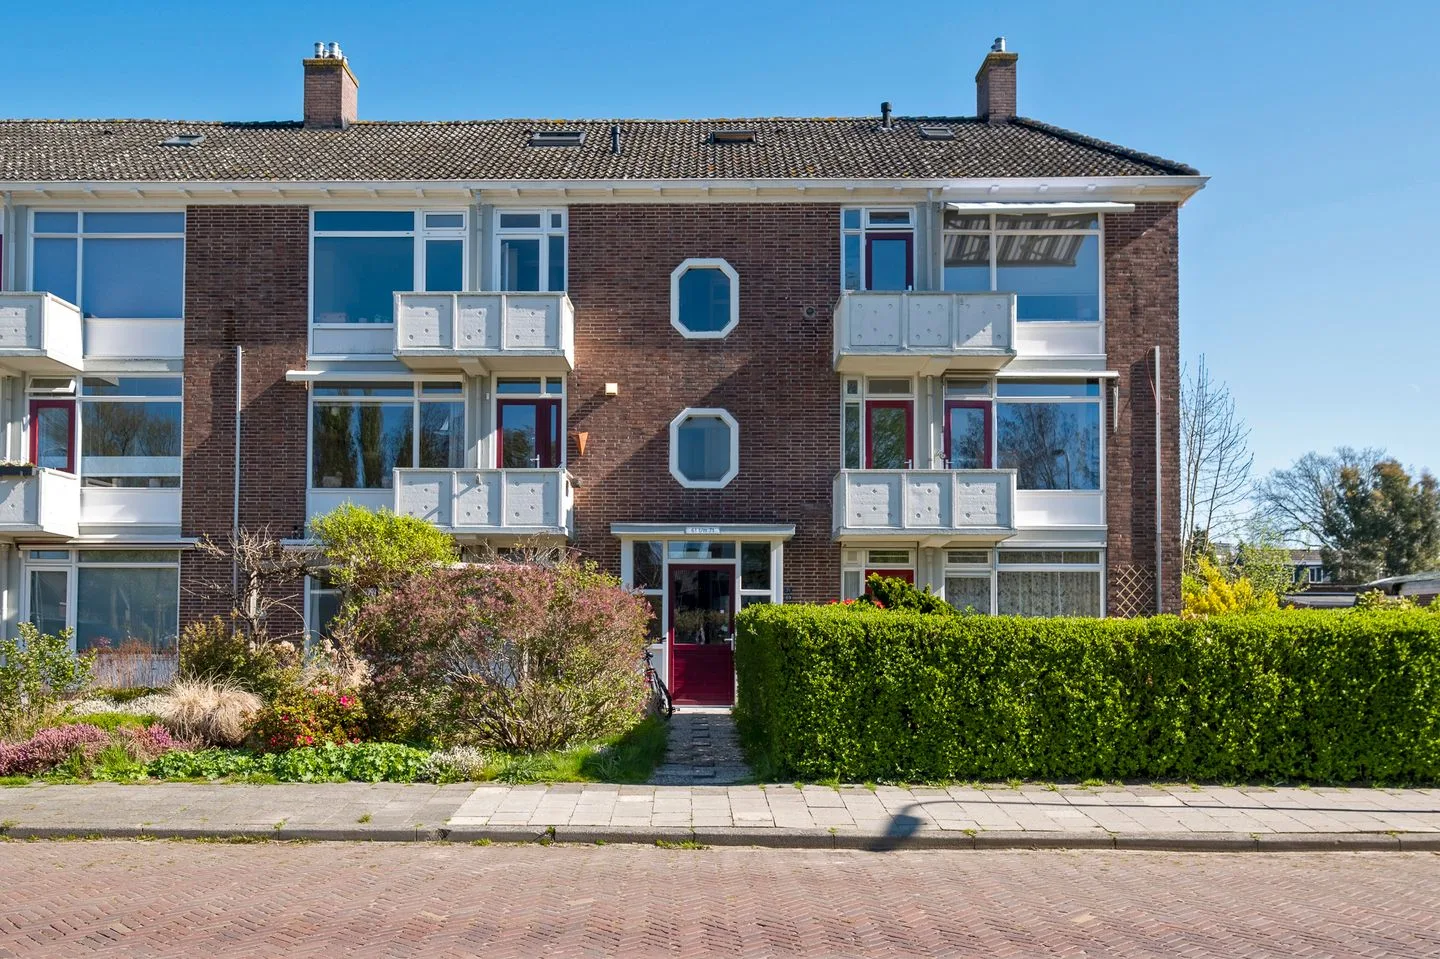
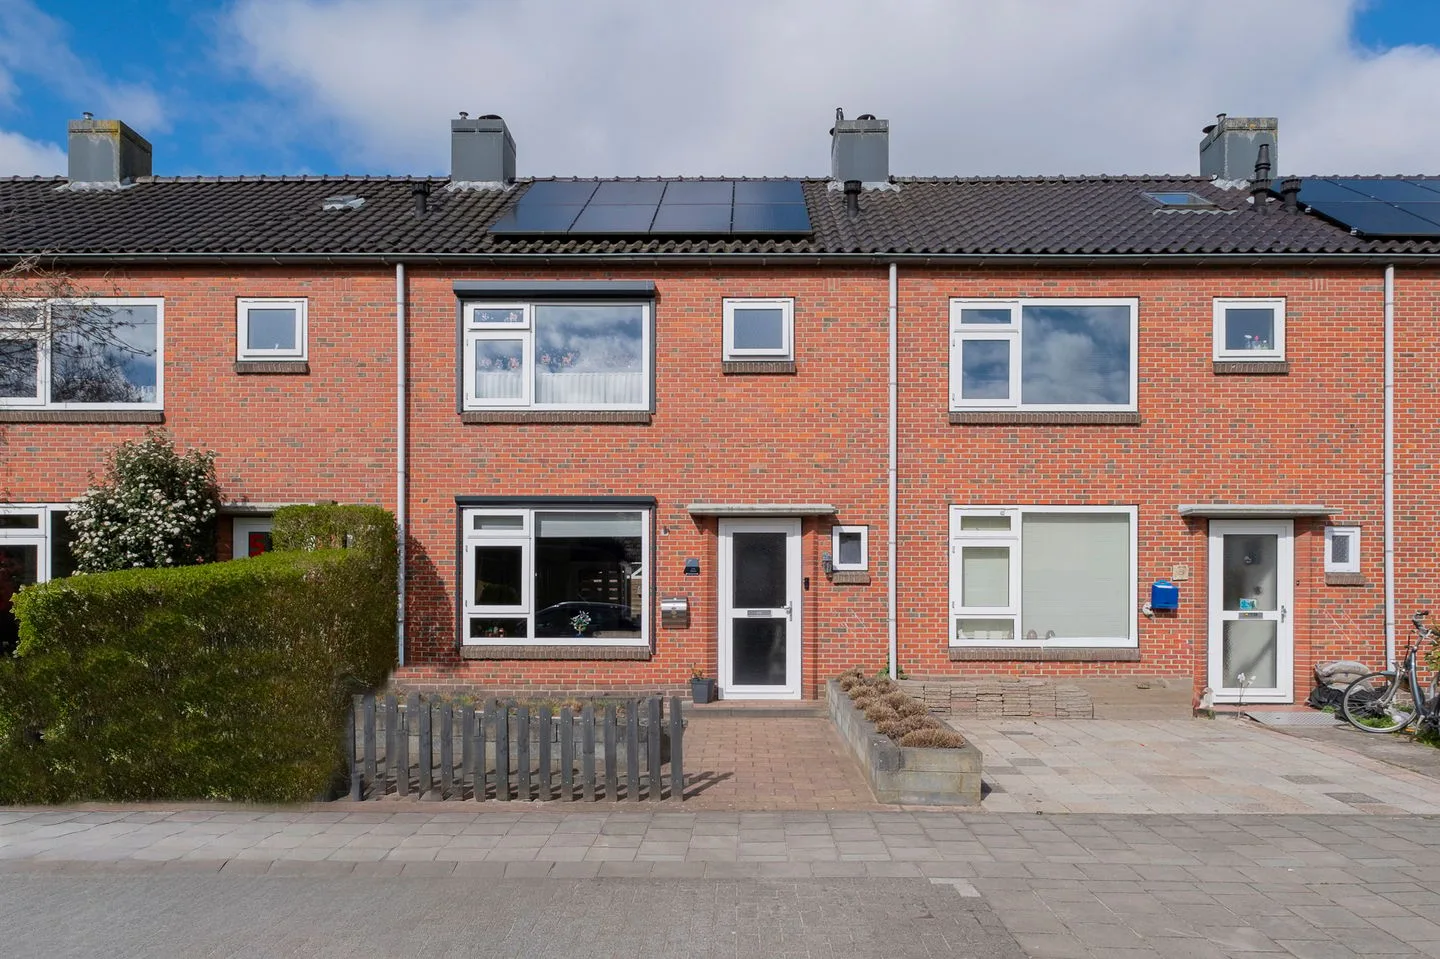
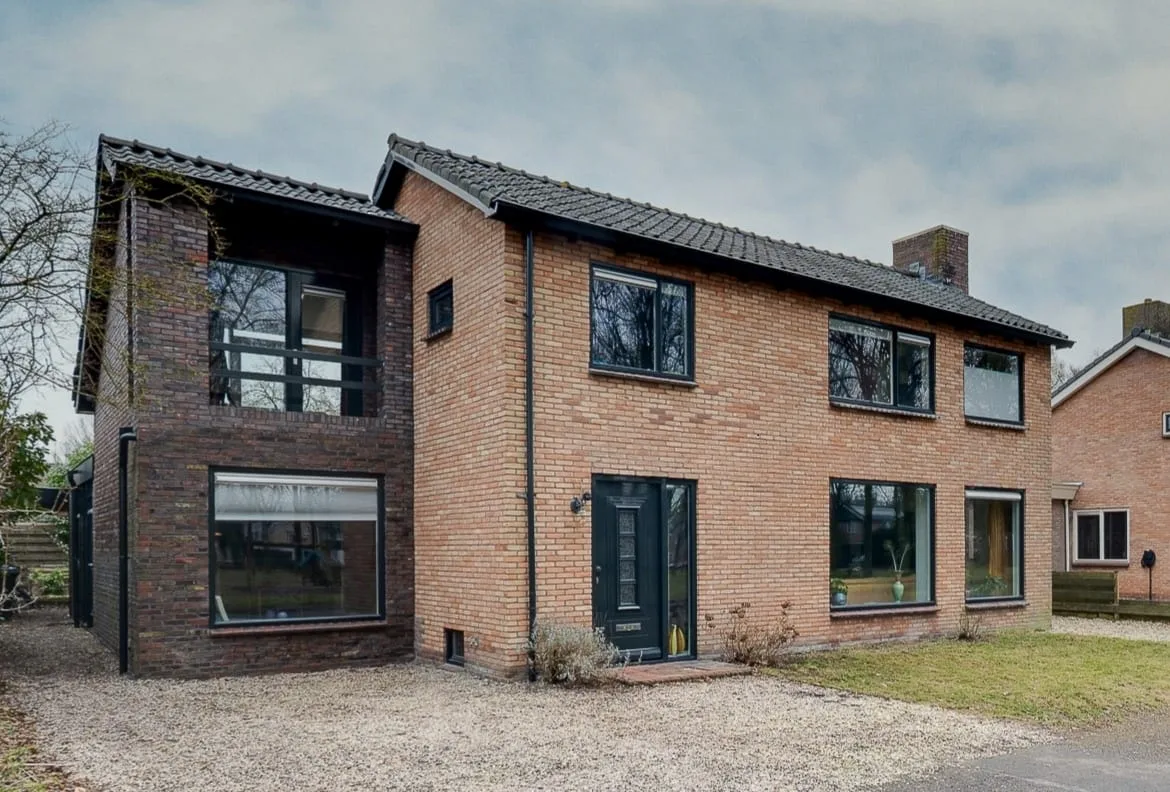
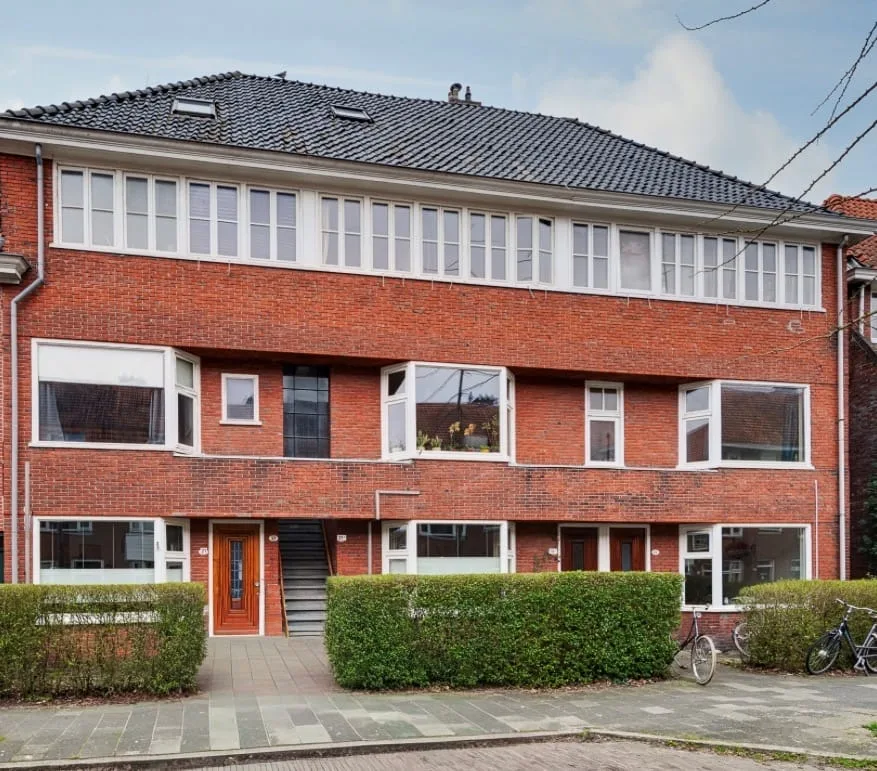
Tiendlanden 31
9407JA Assen
€ 275.000 k.k.
BSave as favorite- Living area
- 87 m²
- Land area
- 157 m²
- Bedrooms
- 3
-

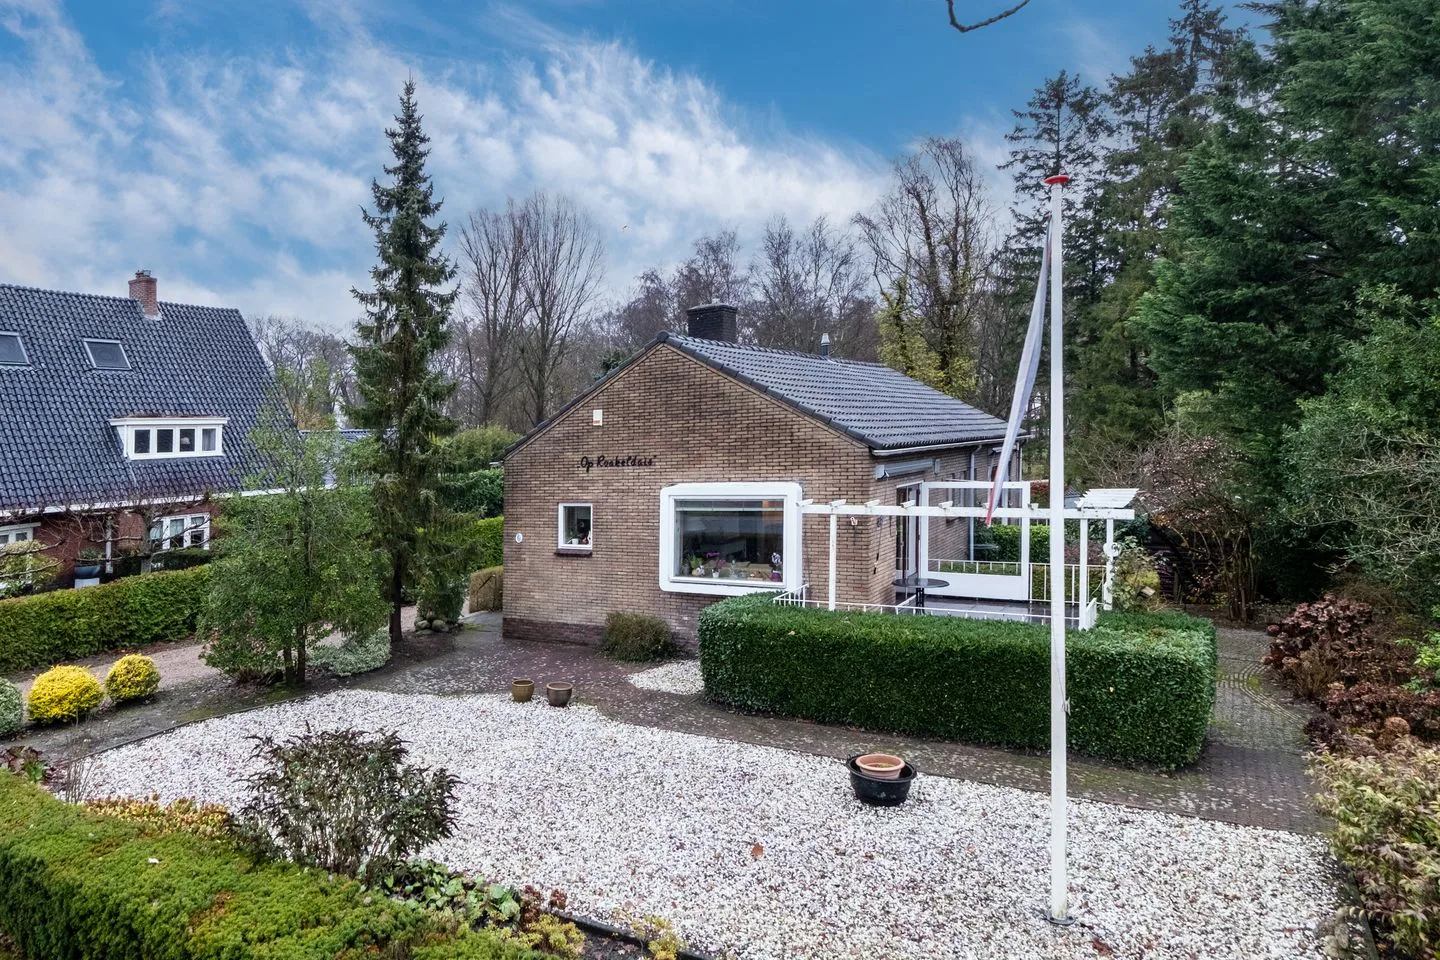
- Available
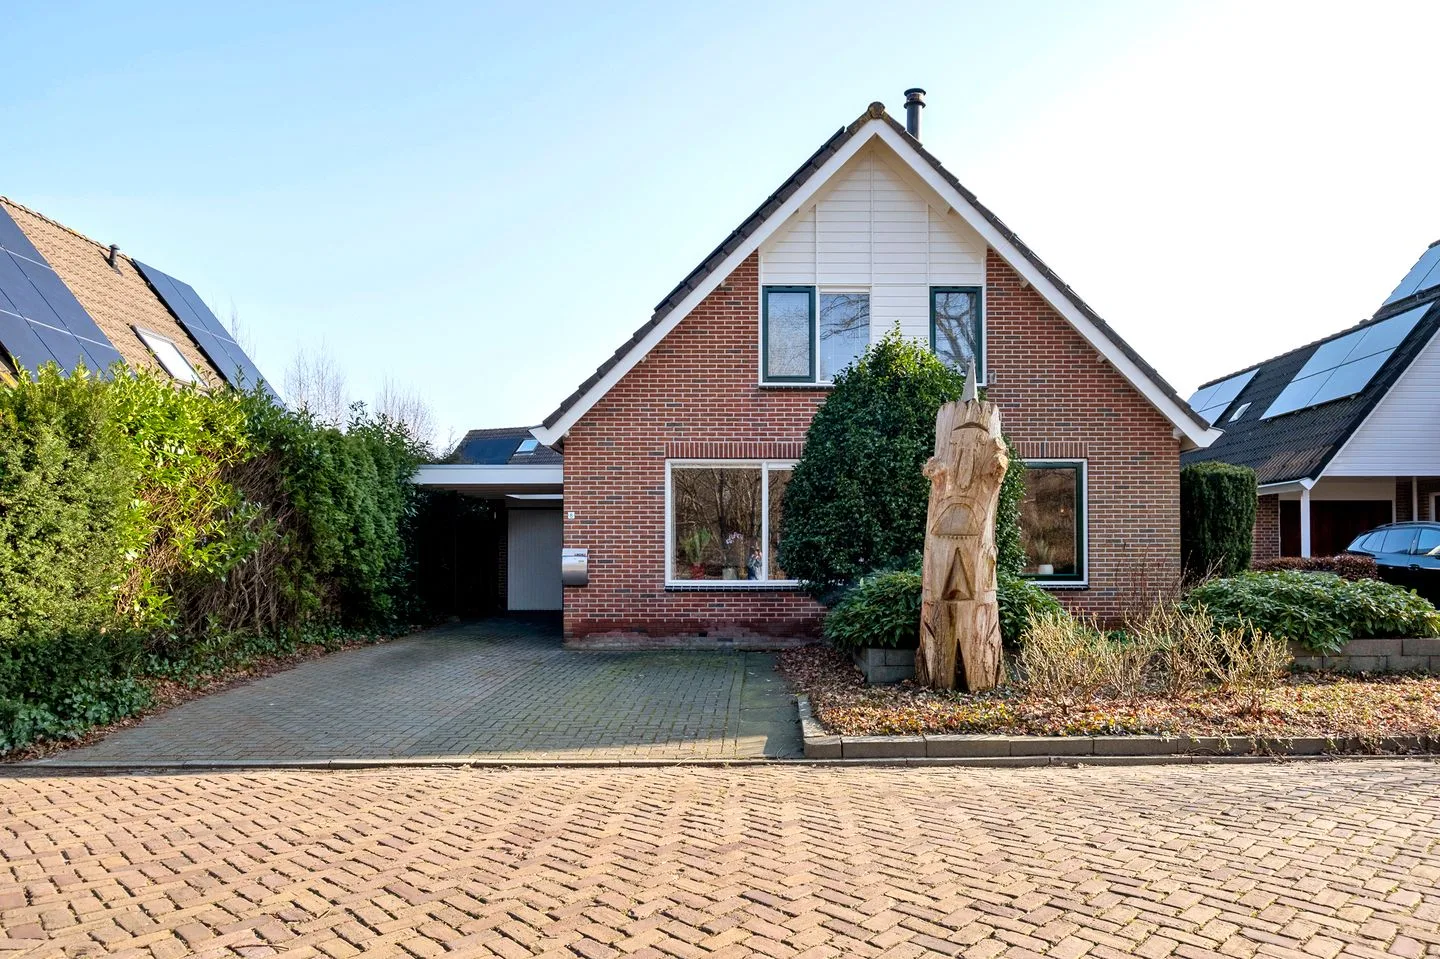
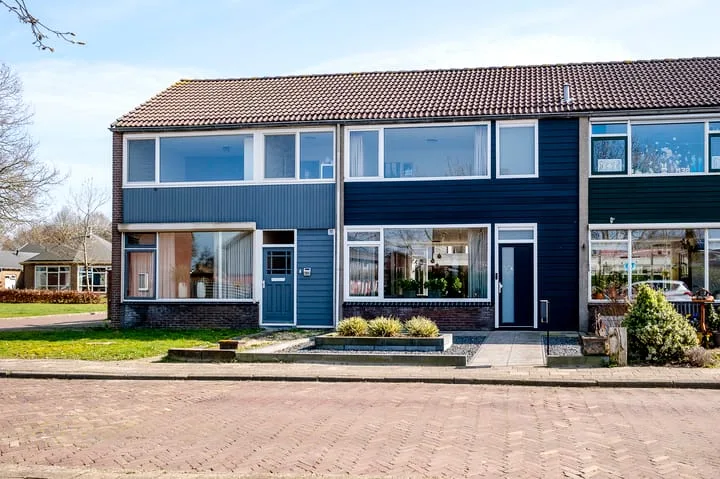
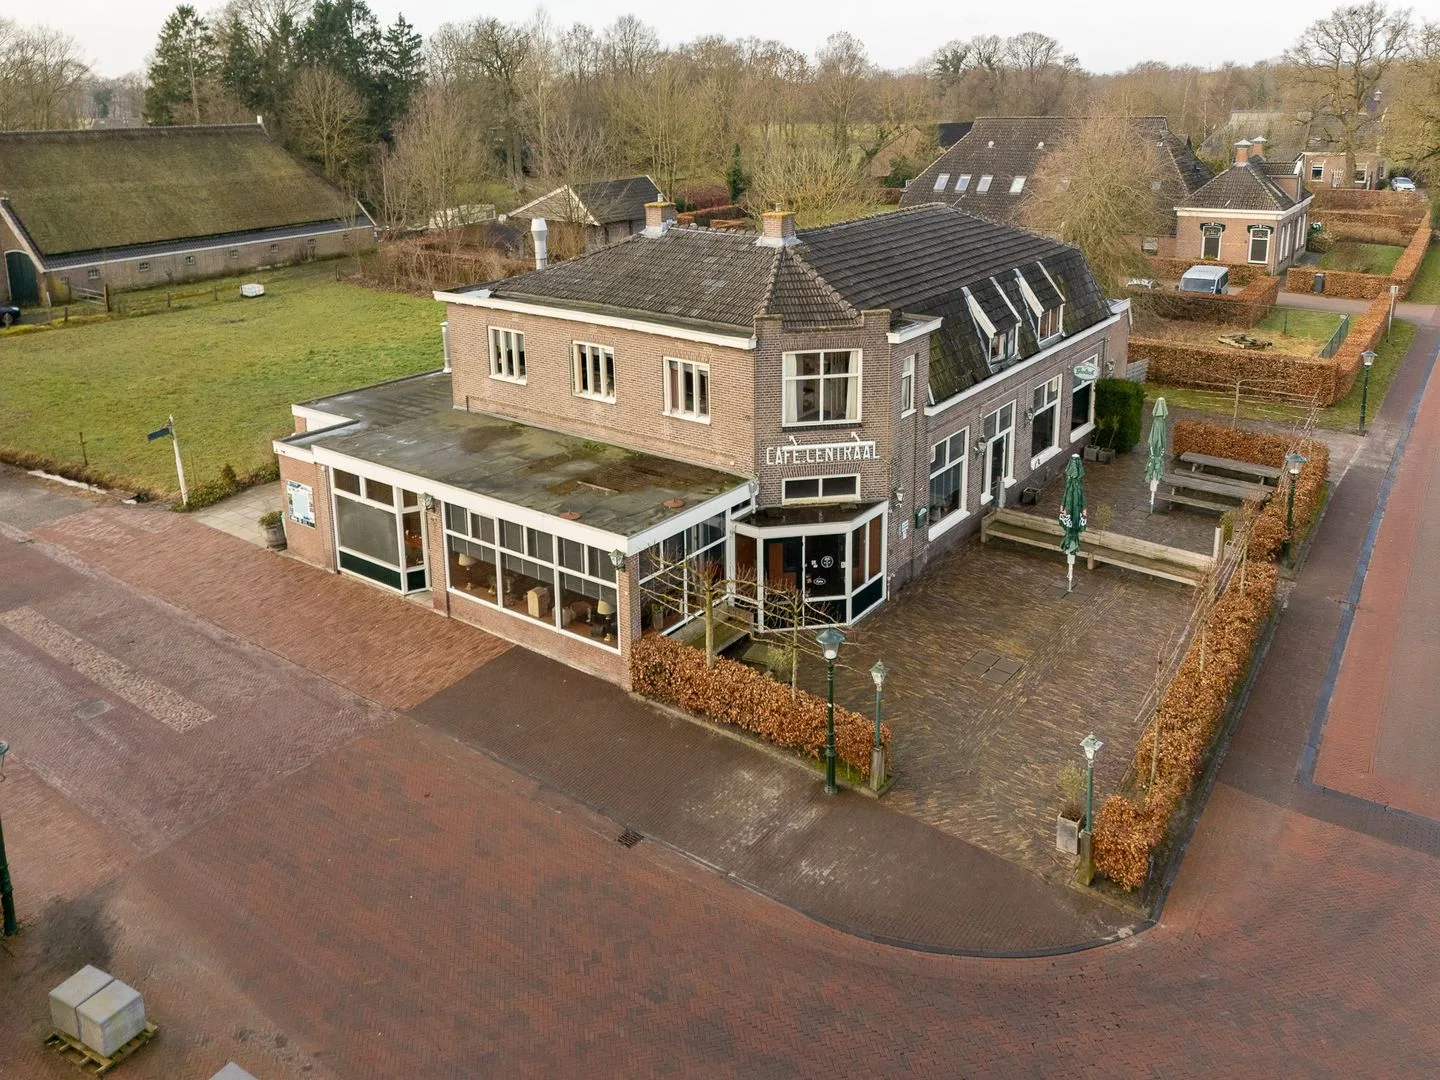
De Wouden 92
9405HM Assen
€ 375.000 k.k.
€ 2.534/m²
CSave as favorite- Living area
- 148 m²
- Land area
- 154 m²
- Bedrooms
- 3
-

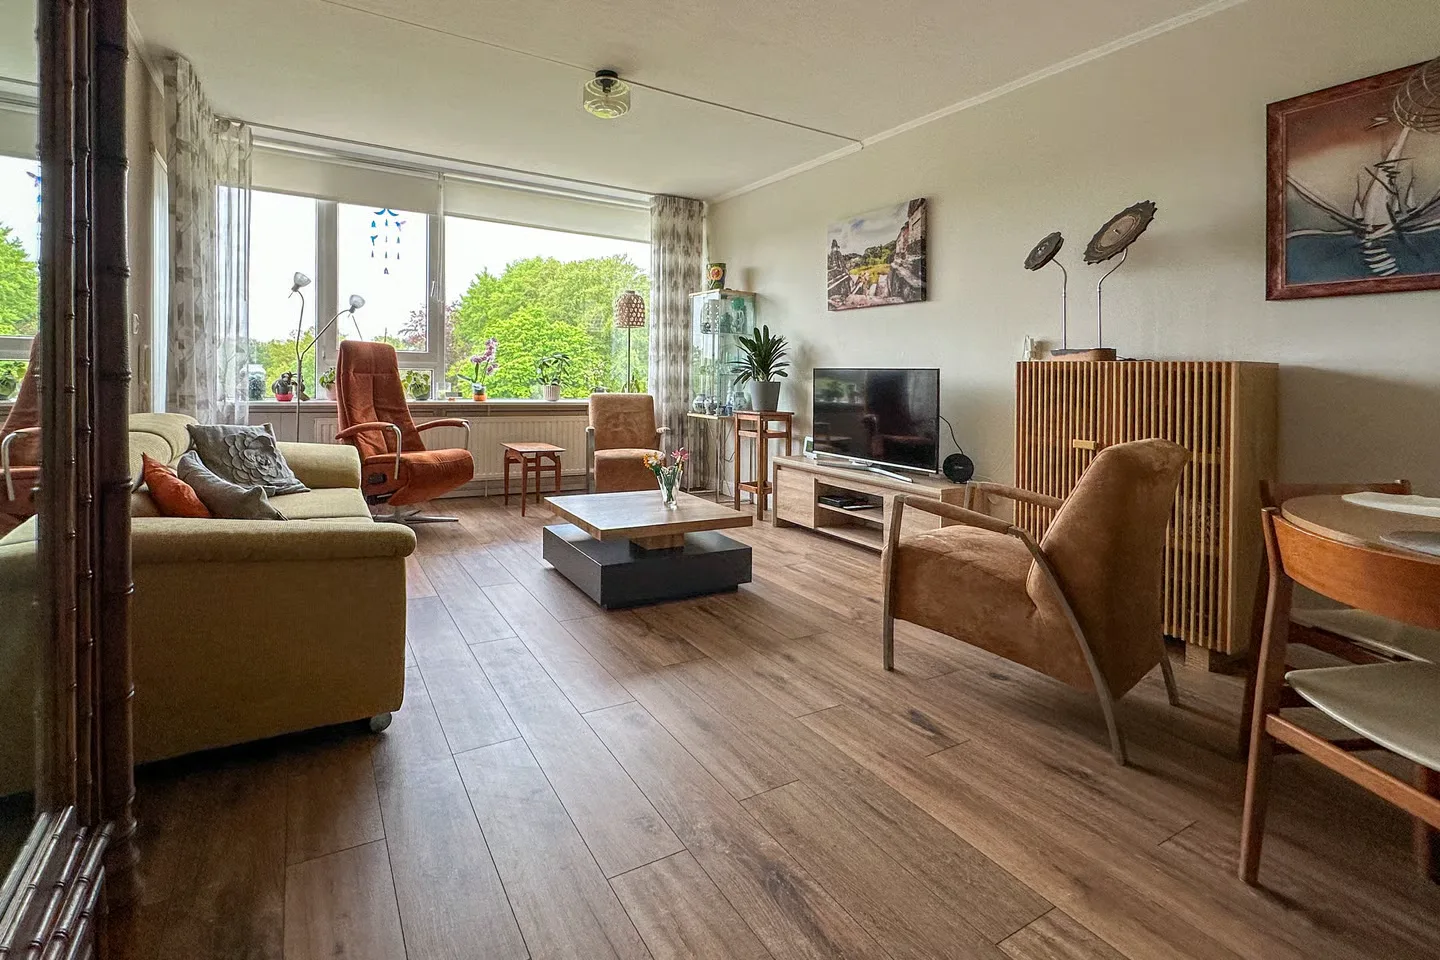
- Available
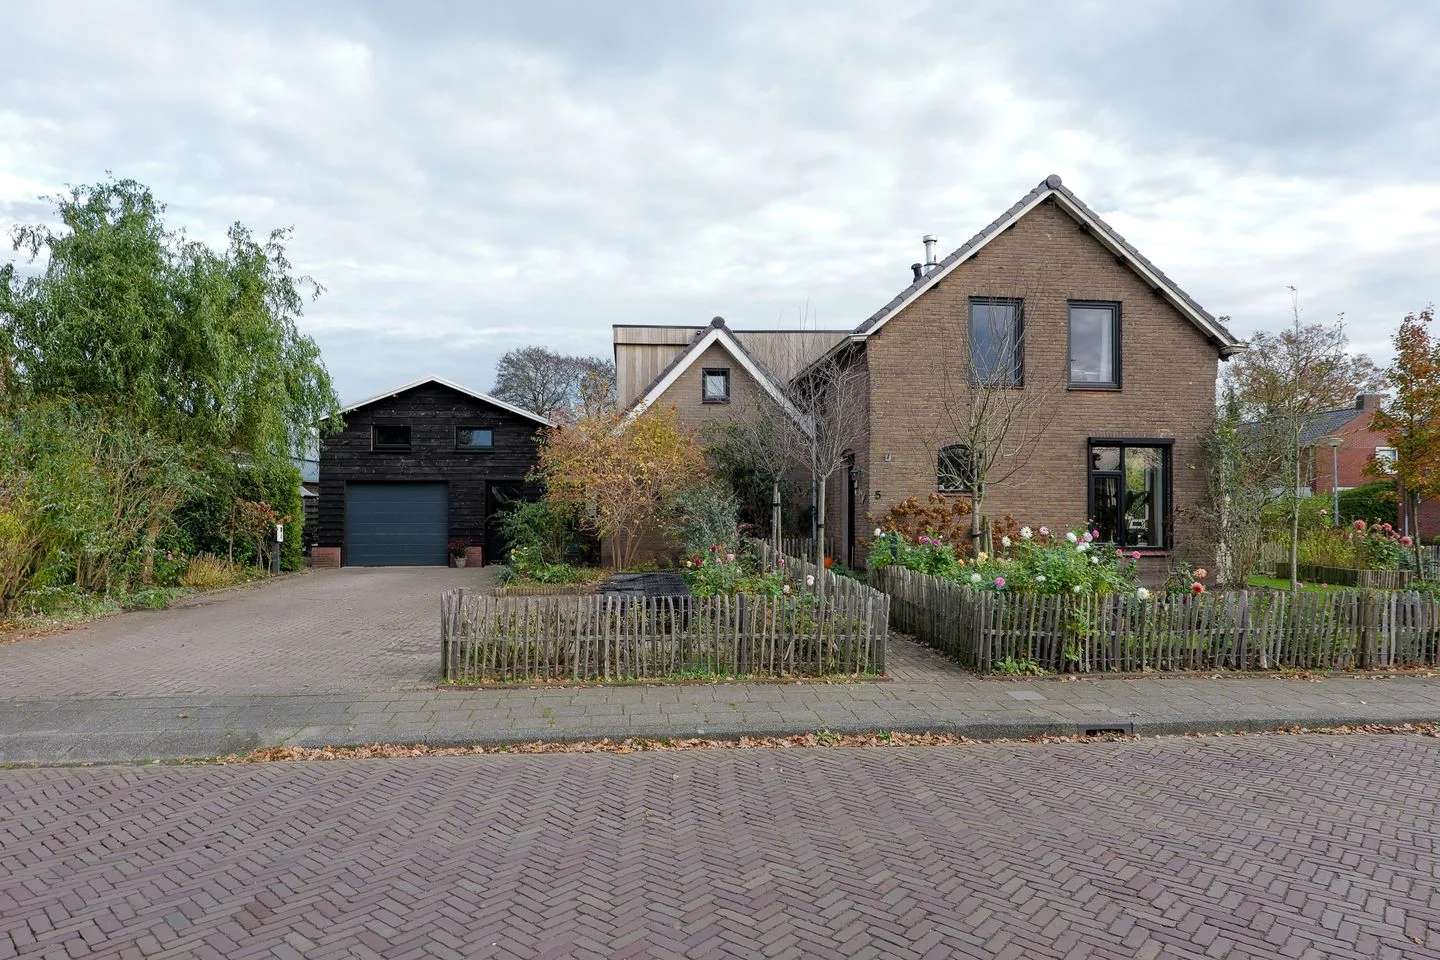
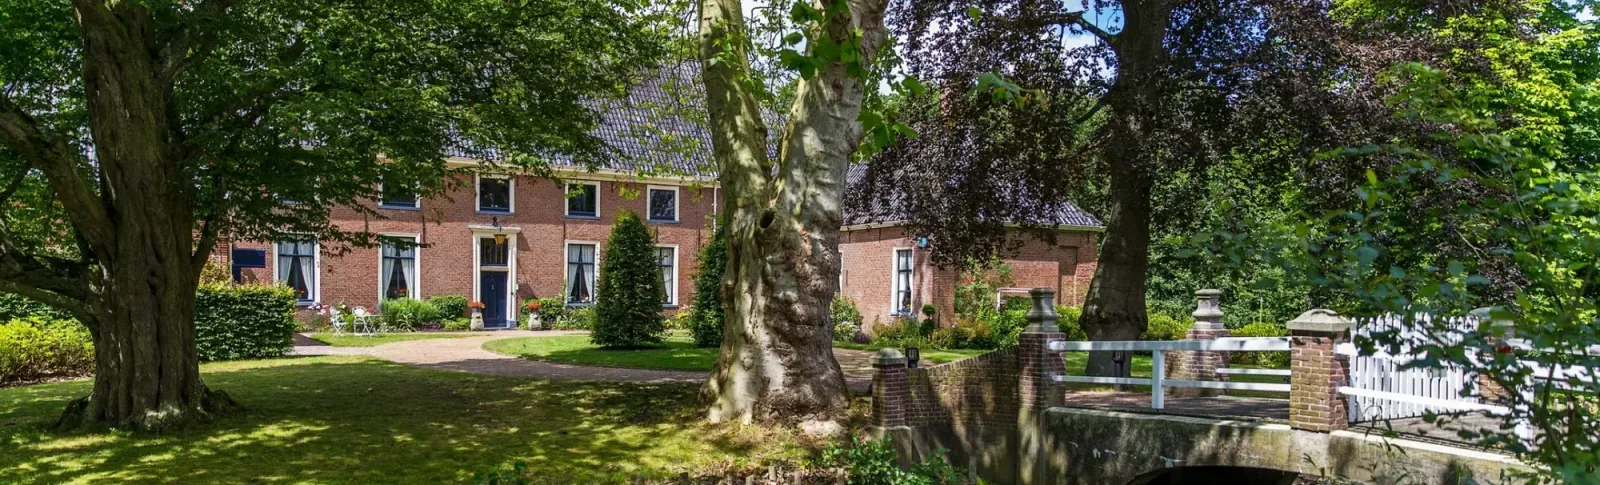
Perzikstraat 56
9408BS Assen
Buy: € 549.000 k.k.
€ 4.653/m²
Rent: € 2.000 p/m
€ 17/m²
ASave as favorite- Living area
- 118 m²
- Land area
- —
- Bedrooms
- 2
-
- Under consideration
Tichelkampen 24
9407RR Assen
€ 319.000 k.k.
€ 2.573/m²
ASave as favorite- Living area
- 124 m²
- Land area
- 163 m²
- Bedrooms
- 4
-

- Sold subject to confirmation
Nijstukken 37
9407KG Assen
€ 299.000 k.k.
€ 2.848/m²
ASave as favorite- Living area
- 105 m²
- Land area
- 169 m²
- Bedrooms
- 5
Reviews (55)
Review platforms
BronscoresTotal score
55 total reviews

Funda
41 reviews on Funda

14 reviews on Google
-
Smetanalaan 262
9Prettig en persoonlijk contact. Denkt mee, maar laat ook ruimte voor eigen ideeën. Attent en op tijd. Goed bereikbaar wanneer nodig. Geen onnodige poespas.
-
Zuringes 9
10Erg prettig contact ! Heel vriendelijk en kon voor elke vraag of opmerking terecht. Zowel formeel als informeel erg prettig ervaren. Goede service en altijd direct gehoor.al met al een fijne samenwerking voor de verkoop van mijn woning.
-
Floralaan 6
10Wij zijn zeer tevreden over de dienstverlening van de makelaar. Er werd deskundig en professioneel gehandeld gedurende het hele traject. De communicatie was helder en eerlijk, met een realistische kijk op de markt en onze mogelijkheden. Dit gaf ons vertrouwen en zorgde voor een prettig verloop van het proces.
-
Meidoornlaan 4
10Fijn makelaarskantoor, altijd goed geholpen zijn zeer tevreden. Communicatie is helemaal top, korte lijnen en goed bereikbaar. Zeer deskundig hebben veel kennis in huis. Er is een duidelijk plan gemaakt voor de verkoop van onze woning waar wij erg content mee waren. Zeker een aanrader!!!
-
Mike
10Translated by AIVery helpful real estate agent who is always ready for you! I can wholeheartedly recommend this party!
-
Fuutmesschen 81
9Translated by AIEverything was good. Common sense, good guidance, friendly. This real estate agent is certainly worth recommending.
-
Brinkstraat 19
8Translated by AIHelped us thoroughly. Did the maximum for us. The house was sold above the asking price. Always kept us well informed.
-
Broeklaan 24
8Translated by AIReputable real estate agent who has a good business sense and will guide you well through the sale or purchase of your home.
-
Kristalstoep 38
9Translated by AIWe are very satisfied with WES real estate agents. They are quick, accurate and have taken a lot of work off our hands. The communication was top-notch, short lines, easy to reach and appointment is appointment. René has advised us well and professionally on the purchase of our new house and on the sale of our old house. This gives confidence, so we can highly recommend them...
-
Steendijk 83
10Translated by AIExcellently guided and kept informed of all developments throughout the entire sales process by René & Wouter. Due to their knowledge of the local market, a realistic plan was outlined, with the aim of achieving a good sales result. Definitely recommended!
-
Lonerstraat 4
9Translated by AIProfessional, straightforward with an eye for detail. Satisfied with the advice and the expert and quick handling of this process.
-
Schoolstraat 17
9Translated by AII am very satisfied with Wes Real Estate. René and Wouter did their best and the contact went very well. They thought along properly! and were always reachable and kept me well informed.
-
Prinses Beatrixstraat 63
10Translated by AIWe had a nice introductory conversation which showed that there was a lot of knowledge about the neighborhood where the property is located. Then we gave them the task. They helped us well with the sale and all the arrangements around it. We could always call or come to their office to discuss things. In short, we are very happy with Wes as an agent.
-
Peesterweg 2 B
10Translated by AIRene is an honest, down-to-earth broker. He clearly states what things are and what you can expect. You feel like you're being treated as a person and not as a target.
-
Vredeveldseweg 8
10Translated by AIRené is good at his trade; he sees things from a structural perspective and provides good advice. Besides giving good advice, René is also pleasant to deal with.
-
Alteveerstraat 37
10Translated by AIAfter a long preparatory period, with much effort and patience from Wes Makelaars, a good sale was achieved. Quick and clear communication.
-
Lorentzstraat 17
10Translated by AIPersonal attention and great service. Involved, attentive and knowledgeable. In short; Wes real estate agents are highly recommended
-
Eswal 3
9Translated by AIQuickly being able to make an appointment With a good explanation the process explained Time for consideration given Then their strategy was explained Tips received on how we could best show the house. He got many viewers and bids on the house through his strategy. And thanks to that, quickly received a good offer. Very satisfied. Small office but precisely because of that very approachable, and they are well informed about all matters. Both men are very pleasant to deal with.
-
Tiendlanden 25
10Translated by AIKnowledgeable realtor who takes you through the process, thinks along and with his team offers excellent service!
-
Erasableclock
10Translated by AIWe sold our house with the help of real estate agent René, and how happy we are about that! From the first contact, it felt familiar. René knew exactly how to guide us through this exciting process. The communication was excellent – clear, honest, and always with a smile. Every viewing was carefully prepared and professionally executed. René kept us informed of the reactions from potential buyers, so we knew exactly where things stood. This gave us an incredibly good feeling. But what really makes René special is his commitment. He thinks along, seeks solutions, and is always ready to answer questions. He understands that selling your house isn't just a business transaction but an important moment in your life. René, thank you so much for your effort, your enthusiasm, and your personal approach. Thanks to you, our house was sold quickly and successfully. We wholeheartedly recommend you to anyone looking for a nice, reliable, and professional real estate agent! Thank you for everything, René! Tamim