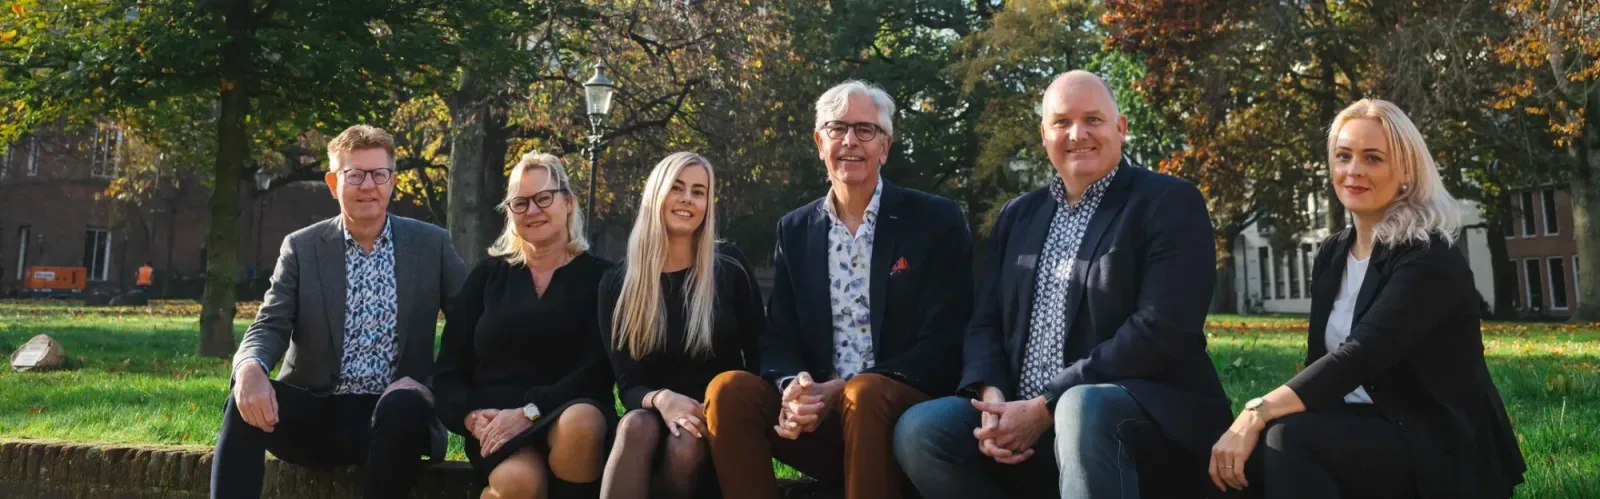
Makelaardij Prins van Wijngaarden BV
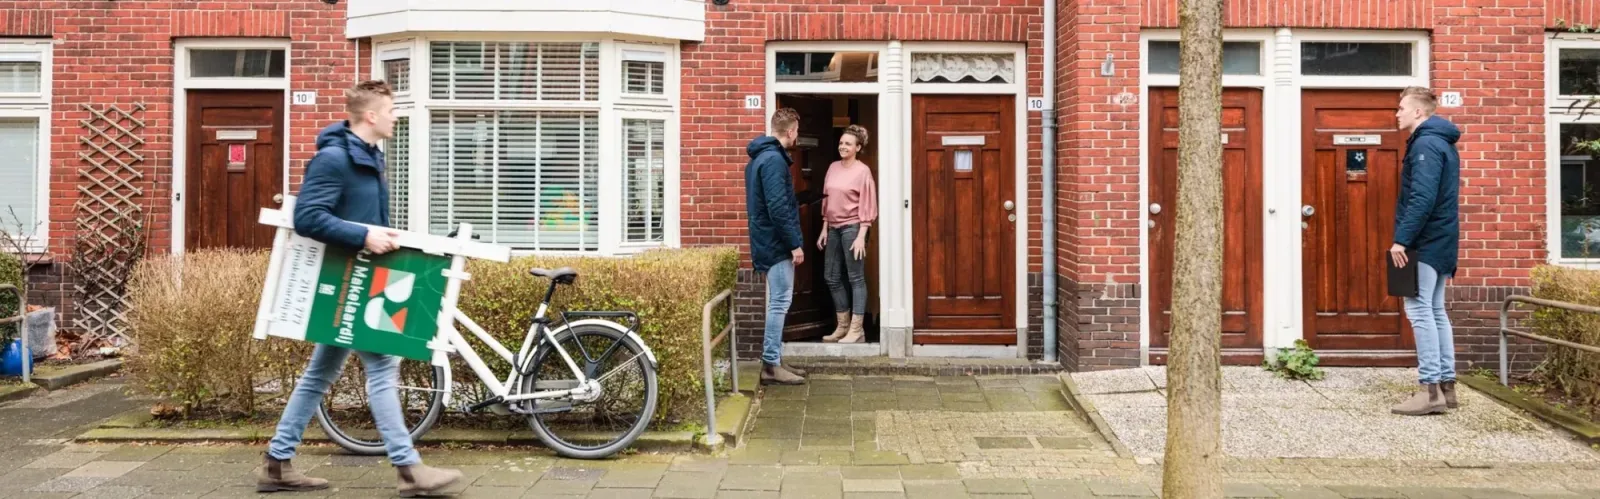
Real Estate Agency Prins van Wijngaarden B.V. stands for involvement, professionalism and results orientation in the current housing market. We understand that buying or selling a house can be complex and intensive, so we ensure smooth and successful guidance from the first moment until the last signature. With a broad expertise portfolio, including real estate styling, photography and legal knowledge, we help you achieve the best outco...
Current housing stock
-

- Available
Eerste Atjehstraat 116 A
1094KS Amsterdam
€ 950.000 k.k.
ASave as favorite- Living area
- 114 m²
- Land area
- —
- Bedrooms
- 2
-

- Available
Hamburgerstraat 54
9714JE Groningen
€ 325.000 k.k.
ASave as favorite- Living area
- 71 m²
- Land area
- —
- Bedrooms
- 2
-

- Available
Seinwachterstraat 35
1019TD Amsterdam
€ 900.000 k.k.
€ 7.965/m²
ASave as favorite- Living area
- 113 m²
- Land area
- —
- Bedrooms
- 3
-

- Available
Jean Desmetstraat 24
1087DR Amsterdam
€ 585.000 k.k.
€ 5.680/m²
ASave as favorite- Living area
- 103 m²
- Land area
- —
- Bedrooms
- 3
-

- Available
Prinsengracht 657 B
1016HV Amsterdam
€ 590.000 k.k.
€ 9.516/m²
ASave as favorite- Living area
- 62 m²
- Land area
- —
- Bedrooms
- 1
-

- Under consideration
Bloemstraat 166 C
1016LK Amsterdam
€ 450.000 k.k.
€ 9.783/m²
BSave as favorite- Living area
- 46 m²
- Land area
- —
- Bedrooms
- 1
Reviews (169)
Review platforms
BronscoresTotal score
169 total reviews

Funda
93 reviews on Funda

76 reviews on Google
-
Helper Westsingel 16 4
9Absolute aanrader voor aankoop én verkoop! Dit kantoor pakt echt door. Dag en nacht bereikbaar voor vragen met altijd een snelle reactie. Ze komen alle afspraken stipt na, houden je uitstekend op de hoogte en regelen bjjna alles van A tot Z. Zeer tevreden over de aanpak!
-
Karien Sanders
10Uitstekende ervaring! "Ik heb dit kantoor ingeschakeld voor zowel de aankoop als de verkoop van mijn woning en ik kan ze aan iedereen aanraden. Wat echt het verschil maakt, is dat ze letterlijk dag en nacht bereikbaar zijn voor vragen; je krijgt altijd razendsnel een reactie. Ze komen elke afspraak keurig na en houden je constant goed op de hoogte van de voortgang. Geen afwachtende houding, maar echt doorpakken en alles tot in de puntjes regelen. Het hele proces werd me bijna volledig uit handen genomen. Een betrouwbare partner die doet wat hij belooft!"
-
Diephuisstraat 43
10Wij zijn ontzettend tevreden over onze makelaar. Ze was altijd goed bereikbaar, dacht actief met ons mee en gaf eerlijk en deskundig advies. Het hele proces verliep soepel en we voelden ons echt ontzorgd. Absoluut een aanrader!
-
Lucas Perini
4Ik raad hun diensten niet aan. Ik had het gevoel dat ik niet goed werd geïnformeerd. Ik moest constant vragen stellen om er zeker van te zijn dat alles in orde was, anders zou ik misschien worden opgelicht. Ze zouden bij de bezichtigingen en het appartementbezoek aanwezig zijn tijdens het aankoopproces, maar dat waren ze niet. Het enige positieve aan hen is dat ze in ieder geval je vragen beantwoorden.
-
Roos van der Voort
10 -
Pelikaanstraat 9 A
10Ook voor de verkoop van onze woning, heeft onze makelaar weer alles gegeven! Super fijn, snel en laagdrempelig contact. Wij raden Makelaardij Prins van Wijngaarden zeker aan!
-
SW S
2Op 9 maart jl. heb ik een bod uitgebracht. De woning was vrij snel daarna verkocht aan een ander. Ik wilde via Move.nl het biedlogboek bekijken. Dat was echter nog niet geactiveerd. Een paar dagen later was de woning uit Move weg. Ik vroeg de makelaar het biedlogboek te activeren. "Wij doen niet aan een biedlogboek" was de reactie. Ik deed vervolgens het verzoek het biedlogboek naar me te mailen, maar kreeg geen reactie. Enkele dagen later stuurde ik een herhaald verzoek. Reactie van de makelaar: "We hebben overleg gehad met de verkoopster en ze vind het onprettig dat wij dit delen. Daarnaast zijn wij dit niet verplicht. Ondanks dit gegeven heb ik een uitdraai gemaakt. Echter staan hier niet de biedingen in die per mail zijn ontvangen van collega makelaars. We hadden dus nog meer..." De makelaar is aangesloten bij Vastgoed Nederland. Daarom verzocht ik om toezending van het verplichte officiële biedlogboek waarin eveneens de ontbindende voorwaarden van de bieders en eventuele andere afspraken worden vermeld. De letterlijke reactie van de makelaar: "Dit is het officiële logboek. Denk dat je in de war bent..wat dacht je dan dat ik stuurde. Dit is het logboek." In een laatste poging de makelaar te bewegen het officiële logboek inzichtelijk te maken, schreef ik: "Als ik de informatie op internet volg, kom ik er telkens bij uit dat de ontbindende voorwaarden -vooropgesteld dat die er zijn- in het biedlogboek vermeld dienen te worden. Dat is in dit geval extra belangrijk omdat de keuze van de verkoper blijkbaar is gevallen op een bod dat 10.000 lager ligt dan het hoogste bod. Ik zou graag willen weten welke ontbindende voorwaarden of andere voorbehouden deze keuze rechtvaardigen. Zoals in een eerdere mail aangegeven, zag ik dat het biedlogboek eind vorige week op Move.nl stond, maar de knop was nog niet geactiveerd. Toen ik het begin deze week weer probeerde, zag ik dat de woning uit Move was verwijderd. Aangezien ik, als bieder, recht heb op inzage in het biedlogboek via een gecertificeerd systeem als Move en het volgens Vastgoed Nederland en de erecode van NVM niet toegestaan is een logboek dat al in Move stond te verwijderen is mijn verzoek nogmaals om het biedlogboek per omgaande via Move inzichtelijk te maken." Daarop bleef het stil. Ik heb dit vervolgens voorgelegd aan Vastgoed Nederland. Zij schreven: "Het is inderdaad bijzonder dat de woning uit jouw account is verwijderd en je daardoor geen inzicht meer had. ‘Wij doen niet aan een biedlogboek’ kan niet, dat moet een lid van Vastgoed Nederland wel, wij hebben immers het convenant wel gesloten om te voldoen aan een aantal minimale vereisten ten aanzien van het Biedlogboek. Wat een verkoper er van vind dat data gedeeld wordt is niet relevant. Ik weet niet waar u gezien heeft dat de betreffende verkopende makelaar het Eerlijk Bieden logo voert, ik heb het niet kunnen vinden. Echter Move heeft die functionaliteit ook, dus daarin zou geen belemmering moeten zitten. Mocht u er daadwerkelijk een zaak van willen maken, moet ik u verwijzen naar de Klachtenloket Vastgoedprofessionals. Wij hebben onze klachteninstantie extern geplaatst wat de transparantie vergroot." Ik heb deze email doorgestuurd naar de makelaar met het klemmende verzoek het biedlogboek te heropenen en mij daarvan een bevestiging te sturen. Ook gaf ik aan dat ik me beraad op vervolgstappen. Toen volgde vrijwel direct deze reactie: "Ik heb het biedlogboek allang gestuurd. En je hebt ver onder de vraagprijs geboden. Ik heb besloten aangifte te doen van stalking. Dit kan echt niet. Ik voel mij onveilig bij jouw berichten." Ik heb deze reactie doorgestuurd naar Vastgoed Nederland en deze review geplaatst. NASCHRIFT: Vervolgens kreeg ik een telefoontje waarvan ik een geluidsopname heb gemaakt. De makelaar gaat daarin namelijk volledig buiten haar boekje. in de reactie hieronder staat dat het logboek allang naar me is gestuurd. Ja, maar dan zonder vermelding van de verplichte ontbindende voorwaarden. Wat daarbij opvalt is dat het winnende bod is uitgebracht nadat de biedtermijn al verstreken was.
-
Van Ostadestraat 26
10Super enthousiast is Makelaar Prins van Wijngaarden de samenwerking met ons aangegaan. Er was meteen een klik. Zeer kort lijntje qua communicatie en ongeveer 24/7 bereikbaar/beschikbaar. Altijd goed gemutst en tegelijkertijd zeer kundig. Zeer content met onze keuze.
-
Nobellaan 106
10Het is geen makelaar die alleen bereikbaar is van 9 tot 5 maar is ook in de weekenden en avonden ook bereikbaar, ze staat je bij met raad en daad. Een bijzondere fijne makelaar
-
Torenlaan 22 B
10Fijn, vlot en laagdrempelig contact! Pro-actief. Pakt zaken direct op. Wij raden deze makelaar zeker aan
-
Sloep 194
10Een makelaar die echt met je meedenkt! Oog voor het kleine stukje dat het verschil kan maken tijdens de verkoop.
-
Dion Gerbers
10 -
Kanaaldijk 24
10We kozen voor de makelaar in ons dorp en ze is zeer voortvarend, snel en vakkundig. Heeft een maximaal resultaat voor ons behaald.
-
Hermanstraat 15
10Dankzij de deskundige begeleiding van Prins van Wijngaarden hebben wij onze droomwoning kunnen aankopen. In de huidige krappe woningmarkt is een scherpe aankoopmakelaar onmisbaar, en zij hebben dat meer dan waargemaakt. De communicatie verliep vlot (fijn contact via WhatsApp!) en we werden bij elke stap in het proces volledig ontzorgd. Ze zijn eerlijk, kundig en zeer gedreven om het beste resultaat te behalen. We hadden ons geen betere begeleiding kunnen wensen!
-
Pionier 6
10Charlotte is heel goed in haar vak, weet goed wat er op de markt speel en hoe hierop in te spelen. Legt ook duidelijk uit, mocht je iets niet begrijpen en helpt je van A tot Z super goed.
-
Fleur Peltenburg
10Lieve, Charlotte en de gehele binnendienst zijn waanzinnig. We zijn op elk moment in het proces goed begeleid. Ik raad PvW Makelaar aan iedereen aan!
-
Roel Ladru
10Translated by AIWe were well assisted by the help of real estate agency Prins van Wijngaarden in the purchase and sale of our house. Dear Haak from the real estate agent answered our questions and removed our concerns during this process. The questions were immediately picked up and answered via WhatsApp. She arranged the house viewings, maintained contact with our financial advisor, and was present during the formalities at the notary. We felt assisted and relieved, fantastic job!
-
Jasmien Khattab
10Translated by AIOur real estate agent Lieve was, apart from being very professional, also very sincere and super nice to work with. She knew an awful lot about the housing market in Amsterdam, was incredibly involved in our search, and has negotiated fantastically when we had found our dream house.
-
Corrado Bergamaschi
10Lieve en het team hebben het kopen van een huis veel gemakkelijker gemaakt dan ik had verwacht. Iedereen was erg behulpzaam en duidelijk over alle noodzakelijke stappen, stelde de juiste vragen tijdens bezichtigingen en gaf me waardevolle feedback. Het hele team is goed bereikbaar en vriendelijk. Ik beveel Makelaardij Prins van Wijngaarden van harte aan.
-
Boris Mattijssen
10Translated by AIGreat real estate agent. Sharon helped me in a short time to find a beautiful house in the overheated housing market in Amsterdam. Sharon was present at every viewing, expert during the inspection of the property, always available, took the time to read through all the documents and was good at negotiating. She knows the Amsterdam housing market well and always gives good advice. Definitely recommended!