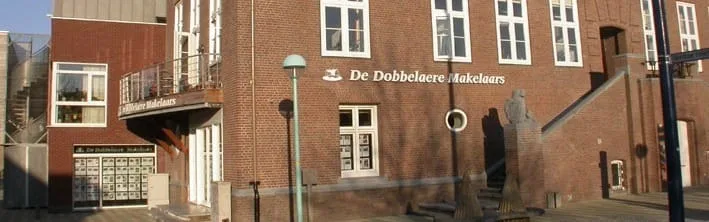
As a real estate professional in Zeeland-Flanders, De Dobbelaere Makelaars & Adviseurs offers reliable and thoughtful guidance for all real estate transactions. Whether it's about residential property, commercial or agricultural land, valuations or project development - we offer a wide range of services that match your needs. Our in-depth knowledge of the region, combined with access to current transaction data, ensures a sharp insight...
Current housing stock
-

- Available
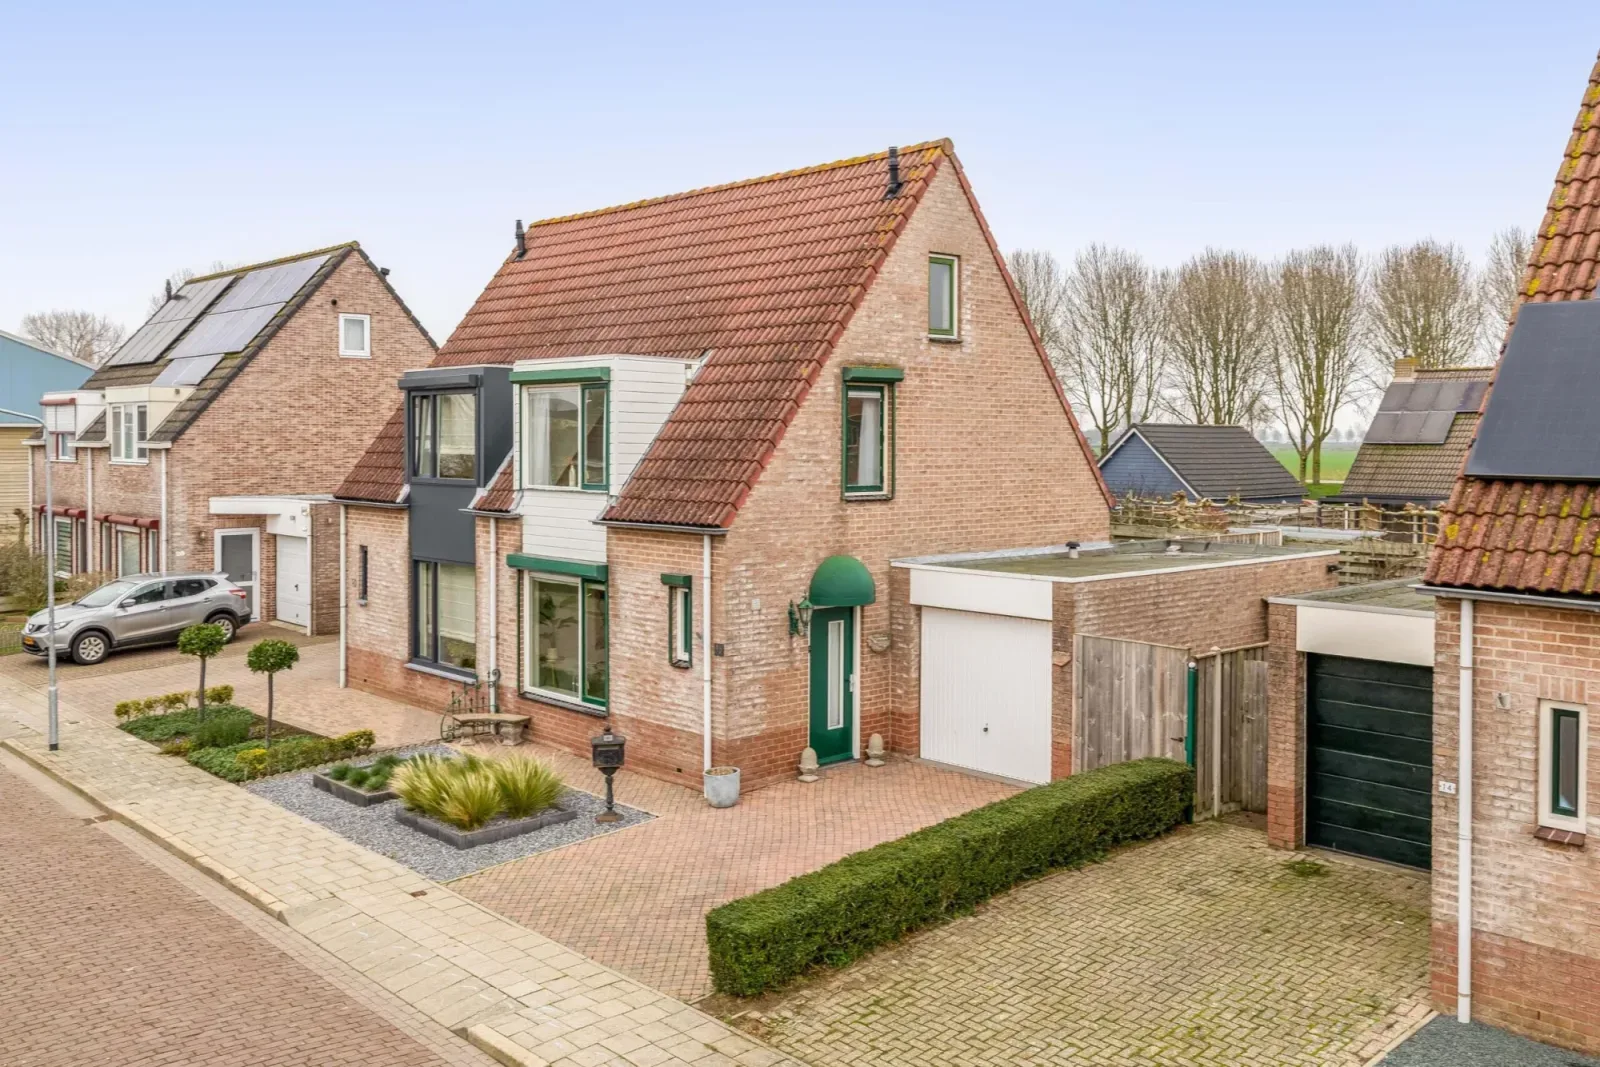
Vlamingpolderweg 4 B 203
4506HZ Cadzand
€ 595.000 k.k.
A+Save as favorite- Living area
- 86 m²
- Land area
- —
- Bedrooms
- 2
-

- Available
Boulevard de Wielingen 7 22
4506JH Cadzand
€ 479.000 k.k.
€ 5.771/m²
A+Save as favorite- Living area
- 83 m²
- Land area
- —
- Bedrooms
- 2
-

- Available
Eedeweg 8
4527AK Aardenburg
€ 569.000 k.k.
CSave as favorite- Living area
- 202 m²
- Land area
- 1552 m²
- Bedrooms
- 5
-

- Available
Burchtstraat 15
4527CH Aardenburg
€ 295.000 k.k.
€ 2.810/m²
FSave as favorite- Living area
- 105 m²
- Land area
- 192 m²
- Bedrooms
- 3
-

- Available
Westhavendam 5 401
4511RD Breskens
€ 775.000 k.k.
ASave as favorite- Living area
- 98 m²
- Land area
- —
- Bedrooms
- 2
-
- Available
Dijkeputten 10
4513KA Hoofdplaat
€ 179.000 k.k.
€ 2.754/m²
GSave as favorite- Living area
- 65 m²
- Land area
- 124 m²
- Bedrooms
- 2
Reviews (18)
Review platforms
BronscoresTotal score
18 total reviews

18 reviews on Google
-
Gerleen Leenhouts
10 -
Olaf Buskens
10Translated by AIExcellent informed and guided in selling a business property.
-
Pieter Claeijs
10Translated by AIExcellent service!
-
Mirle Buurma
10 -
Rick Wijffels
10Translated by AIA very skilled way of working and at the same time a very personal approach. Absolutely the right realtor in Zeelandic Flanders.
-
Anne Oosterhoff
10 -
rick lhachmi
10 -
Kyana Knipping
10 -
JLAL
10 -
Marcel Bink
2Translated by AII had made a request for a viewing of a penthouse (with recreational use) in Cadzand with Jan de Dobbelaere. We agreed there and Jan showed me around (with few words/explanations). Also viewed the associated wellness area and asked about the procedure/use of the wellness (exclusive or shared use, sharing with the chalet park next door? etc.). This was not entirely clear how that is arranged.(?) I left with a number of questions which I subsequently drafted and sent by email to the real estate agent. Questions about the rental agreement of the landlord and previous rental income from the apartments. Since you are obliged to rent out the plot, these are legitimate questions that are important for further consideration. After all, Jan could not answer these questions on the spot. Logical; However, after waiting more than a week, we still had heard nothing or received an email. Subsequently, we decided not to proceed and look elsewhere for a holiday home. We also shared this by email, but received no response here either. A pity, and particularly disappointing, because we were enthusiastic about the property. As far as I am concerned, a missed opportunity.
-
Michael Schramm
8Translated by AIFriendly staff
-
nilix bies
10 -
sabrina Vanhijfte
4 -
Thierry de Coninck
8 -
WDN
10 -
Vteckickedass
8 -
Jan Swaans
10Translated by AINice people exude confidence and that's what it's all about Great company 👍 …
-
Lucky Luck
6