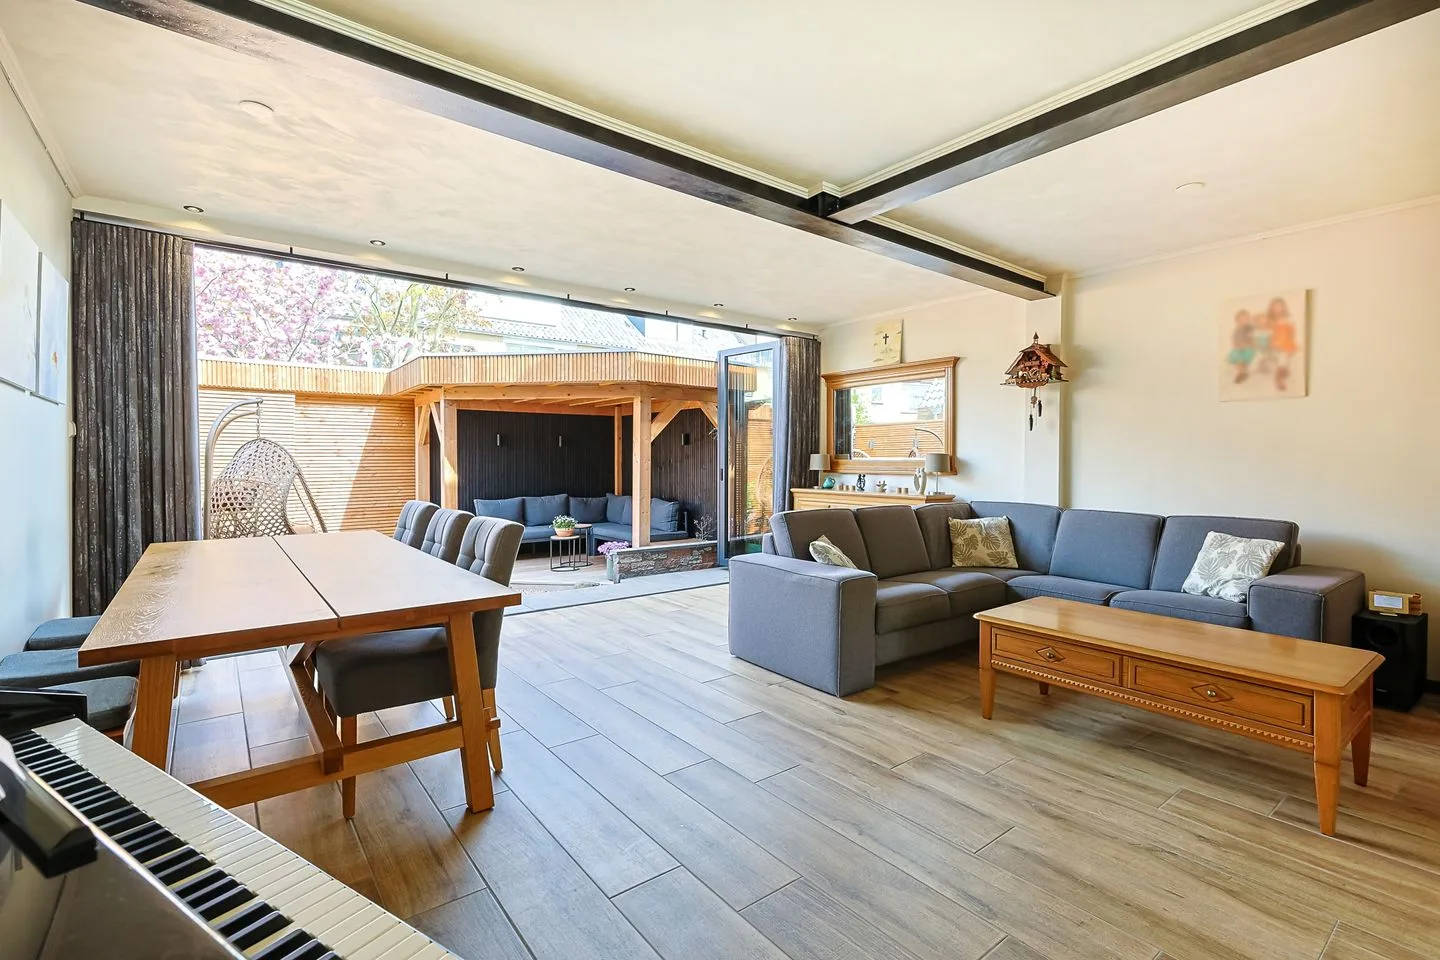
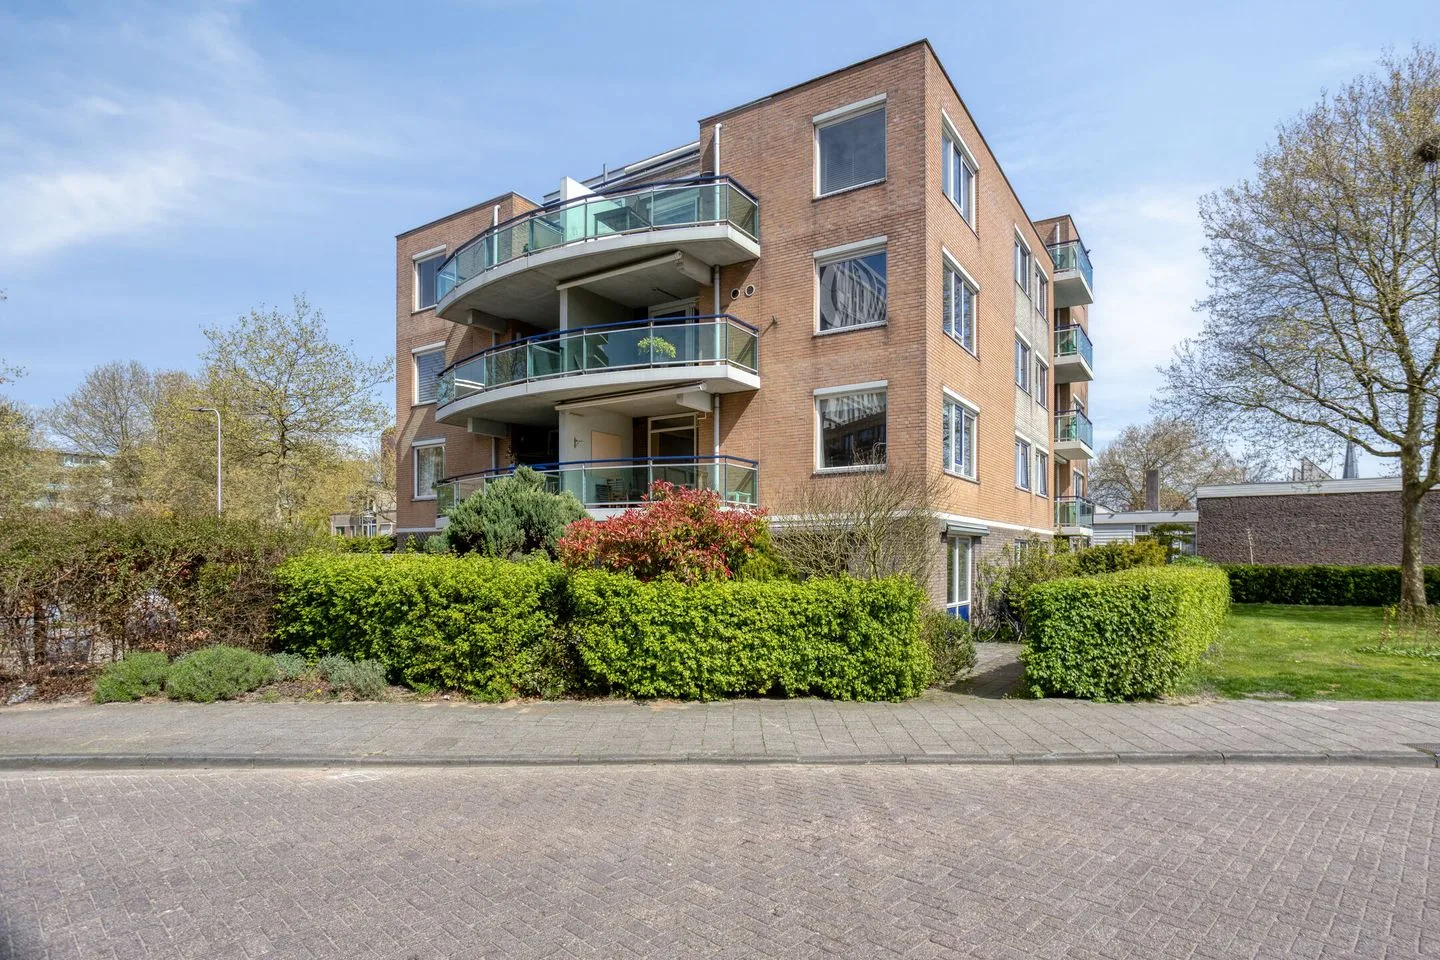
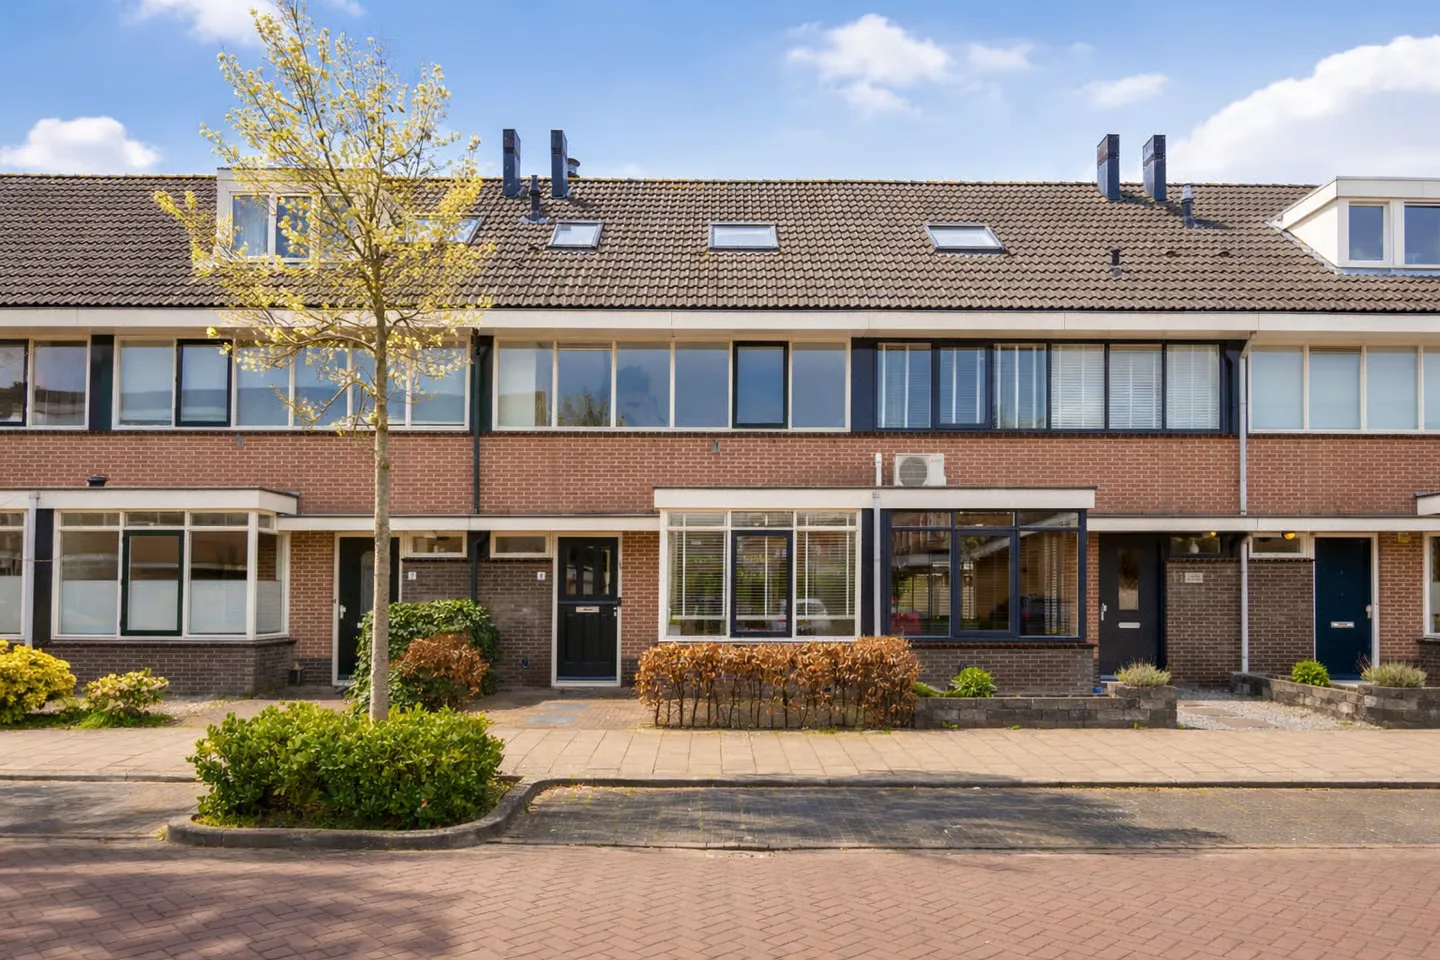
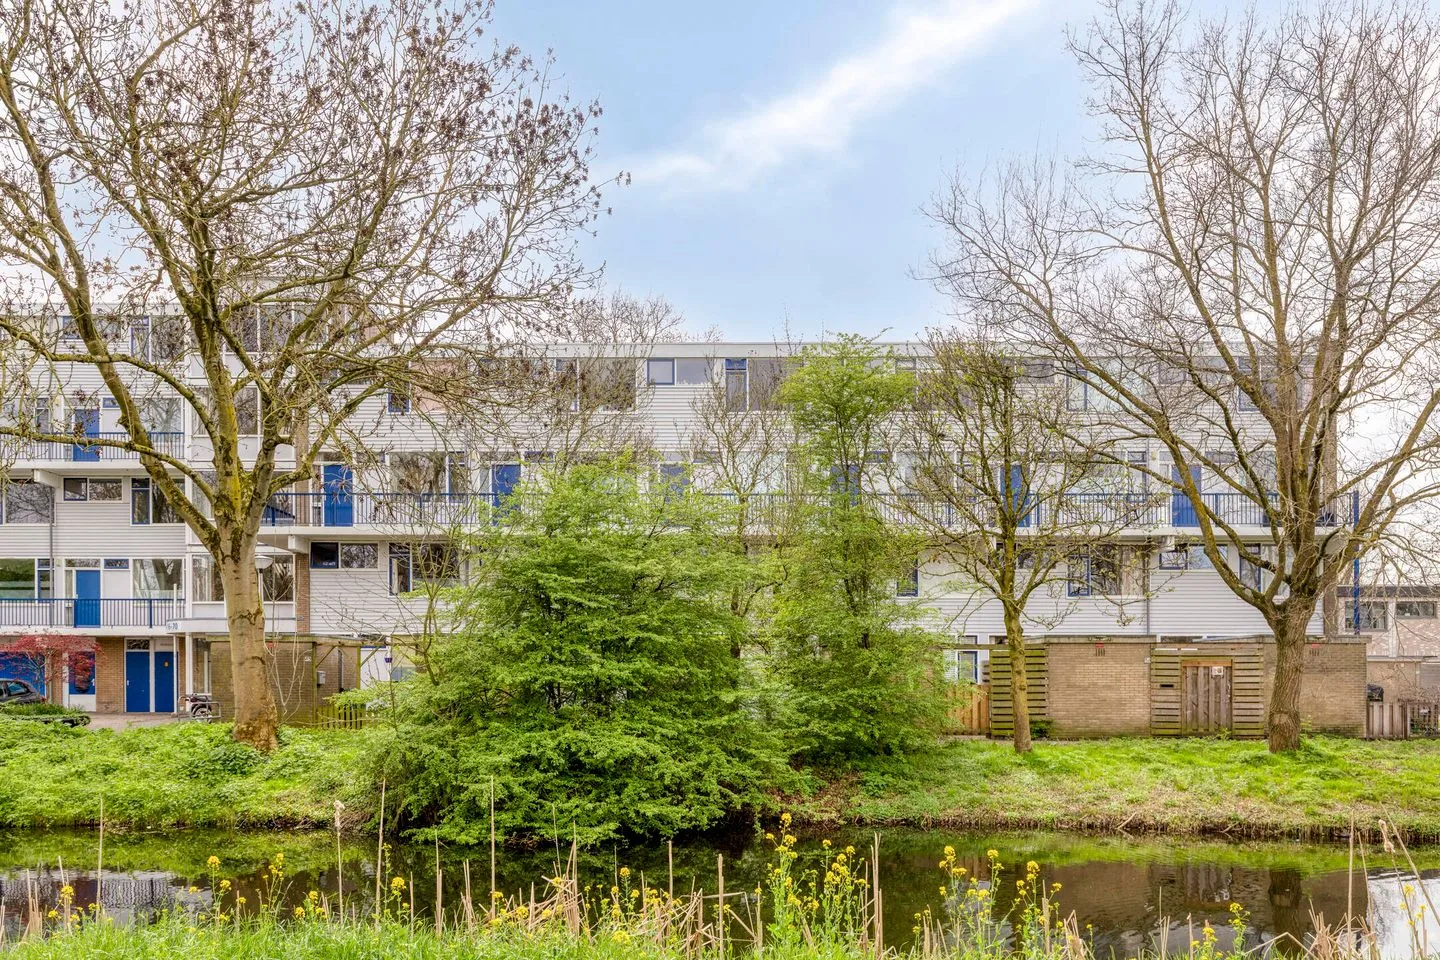
Housing offer in Alphen aan den Rijn

Found: 1.059 houses in Alphen aan den Rijn within your selection

Connected to: Vastgoed Nederland NVM Makelaars

View the current housing stock in Alphen aan den Rijn and quickly filter by price, living area, rooms and more. There are currently 1.059 houses in this place within our selection. View also 843 sold houses in Alphen aan den Rijn for extra insight into the local housing market.

Selection

Search and filter homes

Set your preferences and discover homes that suit you.

Total supply 240.765
Filters

Set price, area and other characteristics. Adjust a filter or click on Show homes. Location changes directly above.

Reset filters

You search for

  • Place Alphen aan den Rijn

Selling a home in Alphen aan den Rijn? Compare realtor offers

Get free quotes from realtors with local market knowledge in Alphen aan den Rijn.

Free request a quote

  • Quotes in Alphen aan den Rijn
  • Non-binding
  • Personal
  • Gratis tarieven vergelijken

Selling a home in Alphen aan den Rijn? Compare real estate agents who know the local housing market. Also check out all real estate agents in Alphen aan den Rijn or the top 10 real estate agents in Alphen aan den Rijn for extra context for your choice.

Save an average of €5000,-

By comparing brokers and requesting quotes

Frequently asked questions about homes in Alphen aan den Rijn

Practical answers about housing supply, sales and comparing real estate agents in Alphen aan den Rijn.

Residential and neighborhood statistics in Alphen aan den Rijn

View current location data on residents, WOZ development, housing stock, energy consumption, business activity and safety in Alphen aan den Rijn. In 2025 were there 75.495 residents. The average WOZ value in 2025 is EUR 378.269.

These figures help to better assess and compare the housing stock in Alphen aan den Rijn with recent sold homes. Orient yourself then on suitable top real estate agents in Alphen aan den Rijn for sales advice in this region.

Residents

75.495

Last year: 2025

Average WOZ

EUR 378.269

Last year: 2025

Average income per person.

EUR 35.744

Source: AllNumbers

Crimes (current year)

3.010

Total registered

Demographics and WOZ development

Inhabitants per year

Inhabitants per year in Alphen aan den Rijn
Year Residents
2021 73.880
2022 74.070
2023 74.790
2024 75.145
2025 75.495

Annual WOZ value

WOZ value per year in Alphen aan den Rijn
Year Average WOZ
2021 EUR 271.081
2022 EUR 295.207
2023 EUR 343.537
2024 EUR 355.376
2025 EUR 378.269

Composition of residents

Age build-up

65+: 15.240 0-15: 11.775 15-25: 8.635 25-45: 19.570 45-65: 20.255

Education level

Hoger

18.890

Praktisch

14.070

Middelbaar

23.670

Origin of residents (2025)

Europa

6.500

Nederland

53.890

Buiten Europa

15.100

Housing stock and construction periods

Types of homes

Hoekwoningen 4.348
Appartementen 16.323
Tussenwoningen 12.718
Vrijstaande woningen 1.113
Twee-onder-één-kap woningen 1.218

Construction period of buildings

Voor 1700 10
1700 tot 1900 117
1900 tot 1925 1.132
1925 tot 1950 1.333
1950 tot 1970 4.166
1970 tot 1980 4.057
1980 tot 1990 4.643
1990 tot 2000 3.373
2000 tot 2010 1.842
2010 tot 2020 1.448
2020 en later 852

Energy and sustainability

Energy label distribution

Label C

10.611

Label A

9.318

Label B

6.175

Label D

2.481

Label E

2.400

Label F

1.496

Label G

1.254

Label A+

866

Label A++

604

Label A+++

603

Label A++++

258

Label A+++++

9

Average energy consumption per year

Average energy consumption per year in Alphen aan den Rijn
Year Gas (m3) Electricity (kWh)
2020 1.035 2.747
2021 1.153 2.770
2022 896 2.575
2023 777 2.420
2024 751 2.467

Consumption per house type

Hoekwoning

Gas: 949 • Electricity: 2.762

Huurwoning

Gas: 686 • Electricity: 1.841

Koopwoning

Gas: 825 • Electricity: 2.755

Appartement

Gas: 636 • Electricity: 1.892

Tussenwoning

Gas: 802 • Electricity: 2.592

Vrijstaande woning

Gas: 1.489 • Electricity: 4.291

Twee-onder-één-kap woning

Gas: 1.154 • Electricity: 3.642

Business activity in Alphen aan den Rijn (2025)

Handel en HORECA 1.660
Nijverheid en energie 1.475
Zakelijke dienstverlening 2.500
Overheid, onderwijs en zorg 1.700
Landbouw, bosbouw en visserij 70
Vervoer, informatie en communicatie 880
Financiele diensten en onroerendgoed 460
Cultuur, recreatie en overige diensten 915

Total number of company establishments: 9.680

Recent crime statistics

Recent crime statistics in Alphen aan den Rijn
Period Crimes
jan 2025 244
jan 2026 250
jul 2025 258
jun 2025 265
mei 2025 227
mrt 2025 235
nov 2024 254
nov 2025 247
okt 2024 248
okt 2025 240
sep 2024 267
sep 2025 296

These figures give an indicative picture of safety trends in the living environment of Alphen aan den Rijn.

Frequently asked questions about living in Alphen aan den Rijn

Short answers based on current local statistics, handy for a quick comparison of the living environment.

Hoeveel inwoners heeft Alphen aan den Rijn?

Alphen aan den Rijn telt in 2025 ongeveer 75.495 inwoners.

Wat is de gemiddelde WOZ-waarde in Alphen aan den Rijn?

De gemiddelde WOZ-waarde in Alphen aan den Rijn is in 2025 circa € 378.269.

Wat is het gemiddelde inkomen per inwoner in Alphen aan den Rijn?

Het gemiddelde inkomen per inwoner in Alphen aan den Rijn ligt rond € 35.744 per jaar.

Hoe veilig is wonen in Alphen aan den Rijn?

Voor het huidige jaar gaat het om ongeveer 3.010 geregistreerde misdrijven. Gebruik deze cijfers als indicatie en vergelijk trends per periode.

Welke woningtypen komen het meest voor in Alphen aan den Rijn?

In Alphen aan den Rijn komt vooral "Appartementen" veel voor, met ongeveer 16.323 woningen.

Gratis vrijblijvende offertes ontvangen

Vergelijk meerdere makelaars en kies de beste match.