- Available
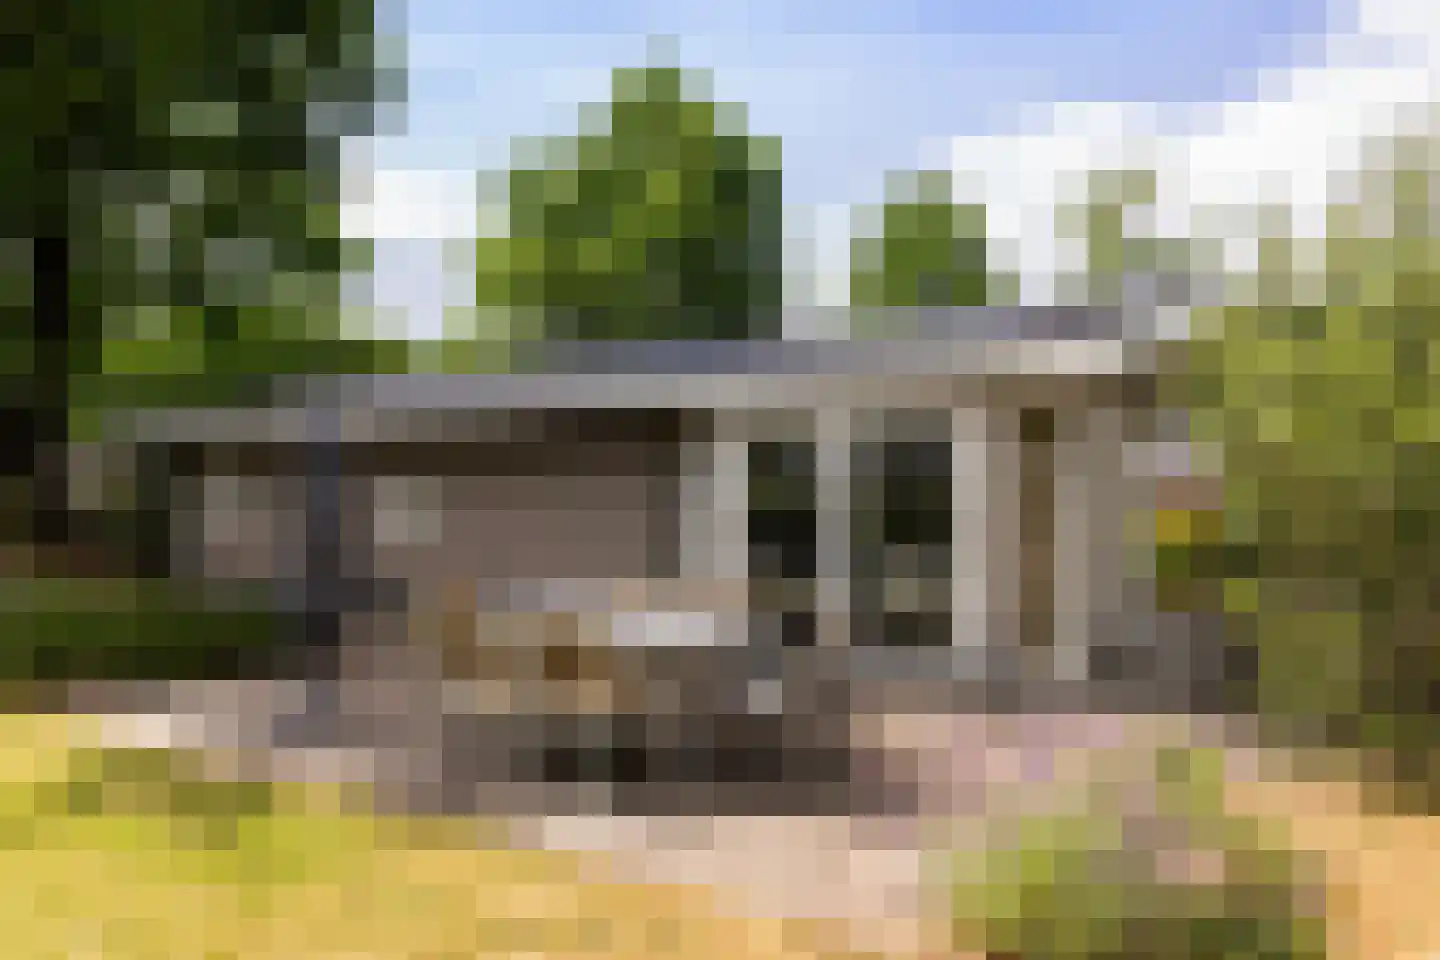
Lage Bergweg 31 TH23
7361GT Beekbergen
€ 69.500
€ 3.657/m²
- Living area
- 19 m²
- Land area
- 108 m²
- Bedrooms
- 1
Searching in 135 houses in Beekbergen
Type to search. Use arrow down and arrow up to navigate through results and press Enter to open.
Hidden search suggestions.
View current properties in Beekbergen or search targeted on street, postal code and property characteristics.
View the current housing stock in Beekbergen and quickly filter by price, living area, rooms and more. There are currently 135 houses in this place within our selection. View also 65 sold houses in Beekbergen for extra insight into the local housing market.
7361GT Beekbergen
€ 69.500
€ 3.657/m²
7361TC Beekbergen
€ 244.500 k.k.
€ 4.445/m²
7361TC Beekbergen
€ 145.000 k.k.
€ 3.936/m²
7361TC Beekbergen
€ 189.000 k.k.
€ 3.375/m²
7361GV Beekbergen
€ 649.000 k.k.
€ 5.364/m²
7361CN Beekbergen
€ 739.000 k.k.
7361TC Beekbergen
€ 125.000 k.k.
7361ZR Beekbergen
€ 450.000 k.k.
€ 5.625/m²
7361GS Beekbergen
€ 39.500
€ 1.012/m²
7361GS Beekbergen
€ 149.500 k.k.
€ 2.047/m²
7361TC Beekbergen
€ 525.000 k.k.
€ 6.105/m²
7361GT Beekbergen
€ 325.000 k.k.
€ 3.915/m²
7361AB Beekbergen
€ 849.000 k.k.
€ 6.243/m²
7361ZS Beekbergen
€ 415.000 k.k.
€ 3.029/m²
7361GT Beekbergen
€ 129.500 k.k.
€ 3.011/m²
7361AS Beekbergen
€ 389.500 k.k.
€ 6.085/m²
7361GT Beekbergen
€ 175.000 k.k.
€ 3.500/m²
7361CB Beekbergen
€ 699.000 k.k.
€ 2.841/m²
7361GT Beekbergen
€ 359.000 k.k.
€ 4.223/m²
7361BZ Beekbergen
€ 429.000 k.k.
€ 4.165/m²
7361CP Beekbergen
€ 825.000 k.k.
€ 3.618/m²
7361BJ Beekbergen
€ 389.000 k.k.
€ 4.322/m²
7361TG Beekbergen
€ 589.000 k.k.
€ 17.324/m²
7361GT Beekbergen
€ 339.500 k.k.
€ 3.947/m²
7361AS Beekbergen
€ 289.000 k.k.
€ 6.148/m²
7361AV Beekbergen
€ 359.000 k.k.
€ 4.986/m²
7361AD Beekbergen
€ 815.000 k.k.
€ 5.292/m²
7361ZL Beekbergen
€ 449.000 k.k.
€ 3.773/m²
Get free quotes from real estate agents with local market knowledge. Compare more than 52 real estate agents in Beekbergen.
Selling a home in Beekbergen? View the sales-oriented guide sell a house in Beekbergen, compare all real estate agents in Beekbergen or view the top 10 real estate agents in Beekbergen for extra context to your choice.
Real estate agents make sharper offers when they know you're comparing — ask for quotes for sale or purchase.
Practical answers about housing supply, sales and comparing real estate agents in Beekbergen.
The costs of a real estate agent in Beekbergen depend on commission, setup costs, property presentation and the chosen service. Compare the 52 real estate agents in Beekbergen via the real estate agent page and request multiple quotes to compare rates and approach well.
Within our selection, we are currently showing 135 houses in Beekbergen. View also the sold houses in Beekbergen to compare the current offering with recent transactions.
Take into account not only price and living area but also maintenance, energy label, location, outdoor space and sales status. This way you compare houses in Beekbergen on more than just the asking price.
A local real estate agent knows the neighborhoods, recent transactions and demand in Beekbergen. By comparing 52 real estate agents in the region you get a better insight into prices, sales strategy and expected yield; the top 10 in Beekbergen provides a useful starting point.
Yes, when making a sales plan, a valuation in Beekbergen is wise. You gain insight into a realistic asking price and can then compare offers from real estate agents specifically.
View current location data on residents, WOZ development, housing stock, energy consumption, business activity and safety in Beekbergen. In 2026 were there 5.261 residents. The average WOZ value in 2025 is EUR 525.000.
These figures help to better assess and compare the housing stock in Beekbergen with recent sold homes. Orient yourself then on suitable top real estate agents in Beekbergen for sales advice in this region.
Residents
5.261
Last year: 2026
Average WOZ
EUR 525.000
Last year: 2025
Average income per person.
EUR 37.800
Source: AllNumbers
Crimes (current year)
276
Total registered
| Year | Residents |
|---|---|
| 2021 | 4.935 |
| 2022 | 4.865 |
| 2023 | 4.925 |
| 2024 | 4.960 |
| 2025 | 5.055 |
| 2026 | 5.261 |
| Year | Average WOZ |
|---|---|
| 2021 | EUR 385.000 |
| 2022 | EUR 418.000 |
| 2023 | EUR 526.000 |
| 2024 | EUR 542.000 |
| 2025 | EUR 525.000 |
Hoger
1.010
Praktisch
1.200
Middelbaar
1.540
Europa
395
Nederland
4.170
Buiten Europa
490
Label A
720
Label D
629
Label B
516
Label C
489
Label G
320
Label F
122
Label E
65
Label A+++
47
Label A+
36
Label A++
7
Label A++++
2
Label A+++++
0
| Year | Gas (m3) | Electricity (kWh) |
|---|---|---|
| 2020 | 1.610 | 3.340 |
| 2021 | 1.810 | 3.400 |
| 2022 | 1.430 | 3.190 |
| 2023 | 1.180 | 3.070 |
| 2024 | 1.130 | 3.180 |
Hoekwoning
Gas: 1.070 • Electricity: 2.250
Huurwoning
Gas: 890 • Electricity: 2.120
Koopwoning
Gas: 1.310 • Electricity: 3.480
Appartement
Gas: 580 • Electricity: 1.800
Tussenwoning
Gas: 850 • Electricity: 2.230
Vrijstaande woning
Gas: 1.550 • Electricity: 4.060
Twee-onder-één-kap woning
Gas: 1.080 • Electricity: 2.940
Total number of company establishments: 695
| Period | Crimes |
|---|---|
| jan 2026 | 19 |
| jul 2025 | 45 |
| jun 2025 | 25 |
| mei 2025 | 13 |
| mrt 2025 | 21 |
| mrt 2026 | 17 |
| nov 2024 | 25 |
| nov 2025 | 22 |
| okt 2024 | 20 |
| okt 2025 | 18 |
| sep 2024 | 14 |
| sep 2025 | 26 |
These figures give an indicative picture of safety trends in the living environment of Beekbergen.
Short answers based on current local statistics, handy for a quick comparison of the living environment.
Beekbergen telt in 2026 ongeveer 5.261 inwoners.
De gemiddelde WOZ-waarde in Beekbergen is in 2025 circa € 525.000.
Het gemiddelde inkomen per inwoner in Beekbergen ligt rond € 37.800 per jaar.
Voor het huidige jaar gaat het om ongeveer 276 geregistreerde misdrijven. Gebruik deze cijfers als indicatie en vergelijk trends per periode.
In Beekbergen komt vooral "Vrijstaande woningen" veel voor, met ongeveer 751 woningen.