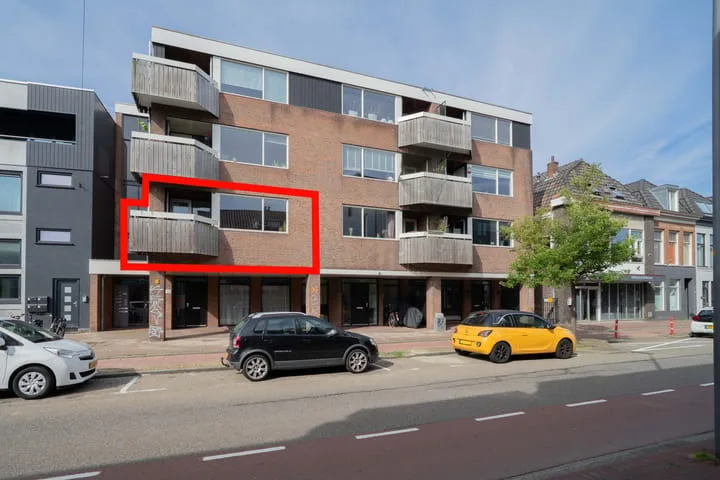
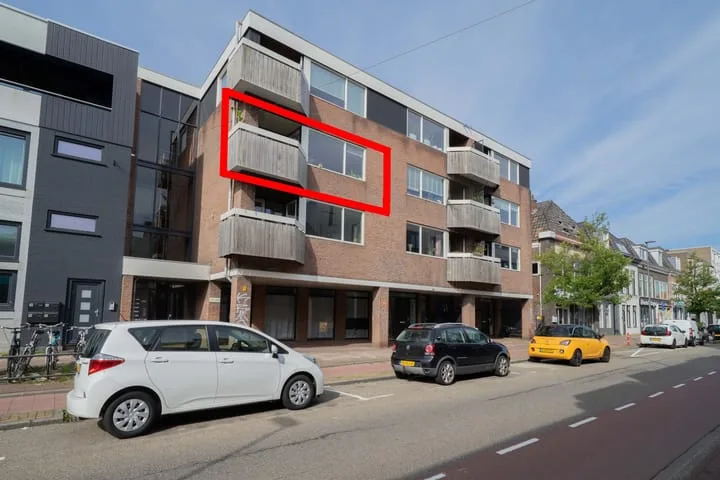
- Sold
Koude Horn 133
1941KB Beverwijk
€ 349.000 k.k.
€ 3.490/m²
- Living area
- 100 m²
- Land area
- —
- Bedrooms
- 2
View 364 sold houses in Beverwijk
Type to search. Use arrow down and arrow up to navigate through results and press Enter to open.
Hidden search suggestions.
Compare sold homes in Beverwijk or view the current offering in this location directly.
On this page you will find recently sold homes in Beverwijk. Use this overview to better estimate selling prices, popular neighborhoods, and the local housing supply before you choose a real estate agent. Also view the current housing supply with 515 houses in Beverwijk.
1941KB Beverwijk
€ 349.000 k.k.
€ 3.490/m²
1945WR Beverwijk
€ 315.000 k.k.
€ 3.888/m²
1942AR Beverwijk
€ 265.000 k.k.
€ 5.000/m²
1946SC Beverwijk
€ 435.000 k.k.
€ 4.027/m²
1942AX Beverwijk
€ 925.000 k.k.
€ 5.441/m²
1941JC Beverwijk
€ 435.000 k.k.
€ 3.246/m²
1942AS Beverwijk
€ 295.000 k.k.
€ 4.469/m²
1948CE Beverwijk
€ 519.000 k.k.
€ 3.931/m²
1944HD Beverwijk
€ 375.000 k.k.
€ 4.629/m²
1941KA Beverwijk
€ 369.000 k.k.
€ 3.481/m²
1944WS Beverwijk
€ 375.000 k.k.
€ 4.213/m²
1944HM Beverwijk
€ 395.000 k.k.
€ 3.558/m²
1941EH Beverwijk
€ 295.000 k.k.
€ 4.916/m²
1944DV Beverwijk
€ 549.000 k.k.
€ 3.839/m²
1943KZ Beverwijk
€ 347.500 k.k.
€ 6.096/m²
1947DB Beverwijk
€ 335.000 k.k.
€ 4.085/m²
1947KJ Beverwijk
€ 425.000 k.k.
€ 3.663/m²
1941CE Beverwijk
€ 350.000 k.k.
€ 3.301/m²
1944GW Beverwijk
€ 315.000 k.k.
€ 3.423/m²
1943DM Beverwijk
€ 389.000 k.k.
€ 4.686/m²
1943BC Beverwijk
€ 325.000 k.k.
€ 4.012/m²
1947KJ Beverwijk
€ 425.000 k.k.
€ 3.899/m²
1941JC Beverwijk
€ 400.000 k.k.
€ 4.123/m²
1941EB Beverwijk
€ 309.000 k.k.
€ 4.352/m²
1942AR Beverwijk
€ 259.000 k.k.
€ 4.886/m²
1945ED Beverwijk
€ 475.000 k.k.
€ 4.241/m²
1948AH Beverwijk
€ 1.175.000 k.k.
€ 5.176/m²
1943GP Beverwijk
€ 485.000 k.k.
€ 4.330/m²
View recent sales and receive free quotes from local real estate agents. Compare more than 79 real estate agents in Beverwijk.
Sold recently in Beverwijk? Read the sales-oriented guide sell your home in Beverwijk, compare sales agents in Beverwijk or view the top sales agents in Beverwijk for reference in your choice.
Real estate agents make sharper offers when they know you're comparing — ask for quotes for sale or purchase.
Short answers about housing prices, sold homes and comparing real estate agents in Beverwijk.
The costs of a real estate agent in Beverwijk vary per office, property type and sales approach. In Beverwijk you can compare 79 real estate agents; therefore also look at the real estate agents in Beverwijk to better compare fees, presentation and local experience.
On this page we currently show 364 sold houses in Beverwijk from our selection. This helps you to better assess recent transactions and the local housing market.
Houses sold in Beverwijk give insight into asking prices, house types and neighborhoods where recent transactions have taken place. Compare this also with the current housing stock in Beverwijk to better understand the market.
You can use sold homes as a first market indication, but a local real estate agent can better take into account finishing, location, maintenance and current demand in Beverwijk. Plan the next step via the guide selling a house in Beverwijk.
Compare the 79 real estate agents in Beverwijk on local sales experience, reviews, expected yield, commission and marketing approach. View real estate agents in Beverwijk or the top 10 agents in Beverwijk to quickly discover strong offices.
View current location data on residents, WOZ development, housing stock, energy consumption, business activity and safety in Beverwijk. In 2025 were there 40.915 residents. The average WOZ value in 2025 is EUR 357.212.
These figures help to better assess and compare the housing stock in Beverwijk with recent sold homes. Orient yourself then on suitable top real estate agents in Beverwijk for sales advice in this region.
Residents
40.915
Last year: 2025
Average WOZ
EUR 357.212
Last year: 2025
Average income per person.
EUR 29.731
Source: AllNumbers
Crimes (current year)
1.779
Total registered
| Year | Residents |
|---|---|
| 2021 | 39.690 |
| 2022 | 39.915 |
| 2023 | 40.515 |
| 2024 | 40.705 |
| 2025 | 40.915 |
| Year | Average WOZ |
|---|---|
| 2021 | EUR 258.943 |
| 2022 | EUR 286.931 |
| 2023 | EUR 341.943 |
| 2024 | EUR 336.624 |
| 2025 | EUR 357.212 |
Hoger
7.530
Praktisch
9.000
Middelbaar
14.160
Europa
4.410
Nederland
27.555
Buiten Europa
8.950
Label C
5.027
Label A
5.010
Label B
2.753
Label G
1.671
Label D
1.393
Label E
1.262
Label F
1.148
Label A+
596
Label A+++
507
Label A++
260
Label A++++
105
Label A+++++
1
| Year | Gas (m3) | Electricity (kWh) |
|---|---|---|
| 2020 | 1.044 | 2.565 |
| 2021 | 1.187 | 2.609 |
| 2022 | 919 | 2.434 |
| 2023 | 803 | 2.282 |
| 2024 | 787 | 2.315 |
Hoekwoning
Gas: 1.005 • Electricity: 2.715
Huurwoning
Gas: 716 • Electricity: 1.850
Koopwoning
Gas: 865 • Electricity: 2.597
Appartement
Gas: 648 • Electricity: 1.779
Tussenwoning
Gas: 829 • Electricity: 2.476
Vrijstaande woning
Gas: 1.211 • Electricity: 3.104
Twee-onder-één-kap woning
Gas: 1.080 • Electricity: 2.870
Total number of company establishments: 5.630
| Period | Crimes |
|---|---|
| jan 2025 | 156 |
| jan 2026 | 135 |
| jul 2025 | 158 |
| jun 2025 | 131 |
| mei 2025 | 137 |
| mrt 2025 | 179 |
| nov 2024 | 150 |
| nov 2025 | 118 |
| okt 2024 | 152 |
| okt 2025 | 137 |
| sep 2024 | 173 |
| sep 2025 | 131 |
These figures give an indicative picture of safety trends in the living environment of Beverwijk.
Short answers based on current local statistics, handy for a quick comparison of the living environment.
Beverwijk telt in 2025 ongeveer 40.915 inwoners.
De gemiddelde WOZ-waarde in Beverwijk is in 2025 circa € 357.212.
Het gemiddelde inkomen per inwoner in Beverwijk ligt rond € 29.731 per jaar.
Voor het huidige jaar gaat het om ongeveer 1.779 geregistreerde misdrijven. Gebruik deze cijfers als indicatie en vergelijk trends per periode.
In Beverwijk komt vooral "Appartementen" veel voor, met ongeveer 9.009 woningen.